Fig. B.1
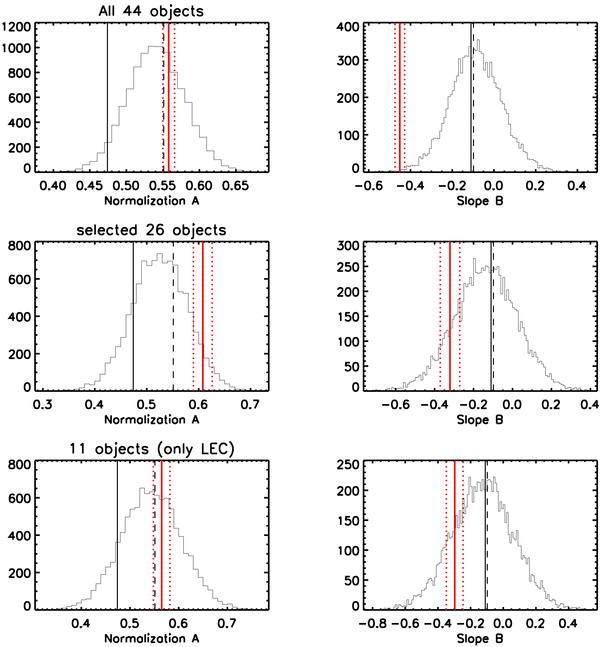
Distribution of the best-fit values of the normalization A and slope B after 10 000 MC realizations. The input values (in these plots from M08 / WMAP-5) are indicated with vertical solid (for all the simulated objects) and dashed (for the relaxed ones) lines. The red solid line represents the central value for the corresponding sample as quoted in Table 5. The red dotted lines show the 1σ uncertainties.
Current usage metrics show cumulative count of Article Views (full-text article views including HTML views, PDF and ePub downloads, according to the available data) and Abstracts Views on Vision4Press platform.
Data correspond to usage on the plateform after 2015. The current usage metrics is available 48-96 hours after online publication and is updated daily on week days.
Initial download of the metrics may take a while.