Fig. 7
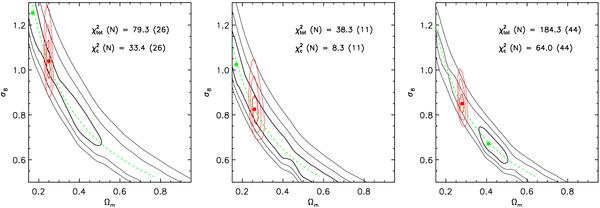
Cosmological constraints in the
(Ωm,σ8) plane obtained from
Eqs. (6) and (7) by using predictions from the model by
Eke et al. (2001). The confidence contours at
1,2,3σ on 2 parameters (solid
contours) are displayed. The combined likelihood with the probability distribution
provided from the cluster gas mass fraction method is shown in red. The dashed green
line indicates the power-law fit  .
The best-fit results are quoted in Table 6. A
relative logarithmic scatter of 0.139 (see Sect. 6) is considered in the models. Systematic uncertainties on
c200 and
fgas(<R500)
as quoted in Table 4 are also propagated.
(Left) From the subsample of 26 clusters satisfying the condition
(rs + ϵrs) < Rsp;
(center) from the subsample of the LEC objects;
(right) from all the 44 clusters.
.
The best-fit results are quoted in Table 6. A
relative logarithmic scatter of 0.139 (see Sect. 6) is considered in the models. Systematic uncertainties on
c200 and
fgas(<R500)
as quoted in Table 4 are also propagated.
(Left) From the subsample of 26 clusters satisfying the condition
(rs + ϵrs) < Rsp;
(center) from the subsample of the LEC objects;
(right) from all the 44 clusters.
Current usage metrics show cumulative count of Article Views (full-text article views including HTML views, PDF and ePub downloads, according to the available data) and Abstracts Views on Vision4Press platform.
Data correspond to usage on the plateform after 2015. The current usage metrics is available 48-96 hours after online publication and is updated daily on week days.
Initial download of the metrics may take a while.