| Issue |
A&A
Volume 524, December 2010
|
|
|---|---|---|
| Article Number | A9 | |
| Number of page(s) | 11 | |
| Section | Stellar atmospheres | |
| DOI | https://doi.org/10.1051/0004-6361/201015007 | |
| Published online | 19 November 2010 | |
Metal abundances in the hottest known DO white dwarf (KPD 0005+5106) ⋆
1
Institute for Astronomy and Astrophysics, Kepler Center for Astro and
Particle Physics, Eberhard Karls Universität Tübingen,
Sand 1,
72076
Tübingen,
Germany
e-mail: This email address is being protected from spambots. You need JavaScript enabled to view it.
2
Department of Physics and Astronomy, Johns Hopkins
University, Baltimore, MD
21218,
USA
Received: 17 May 2010
Accepted: 24 July 2010
Abstract
We present the analysis of ultraviolet and optical spectra of KPD 0005+5106. Redetermination of the atmospheric parameters is necessary because the recent discovery of highly ionised metals (Ne viii, Ca x) indicates that the effective temperature is significantly higher than previously thought. Here we announce the discovery of lines from highly ionised silicon, sulphur, and iron (Si vii, S vii, Fe x) which were never found before in any stellar photosphere. Our analysis of these lines and those from helium and several other metals gives Teff = 200000 ± 20000 K, log g = 6.7 ± 0.3. Mass and luminosity follow from a comparison with evolutionary tracks: M = 0.64 M⊙ and log L/L⊙ = 3.7, so that, strictly speaking, the star is a helium-burning pre-white dwarf. The mass fractions of the metals in the helium-dominated atmosphere are in the range 0.7−4.3 solar. Hydrogen is not detectable and we derive an upper abundance limit of 0.034 solar. This abundance pattern is probably unaffected by gravitational settling and radiative levitation. Its origin lies in previous evolutionary stages. We discuss the link of KPD 0005+5106 to RCrB stars and the possibility that it results from a double-degenerate merger event.
Key words: stars: abundances / stars: atmospheres / stars: evolution / stars: AGB and post-AGB / white dwarfs / stars: individual: KPD 0005+5106
Based on observations made with the NASA-CNES-CSA Far Ultraviolet Spectroscopic Explorer. FUSE was operated for NASA by the Johns Hopkins University under NASA contract NAS5-32985.
Current address: NASA Goddard Space Flight Center, Greenbelt, MD 20771, USA.
© ESO, 2010
1. Introduction
Since its discovery (Downes et al. 1985) the He-rich DO white dwarf (WD) KPD 0005+5106 has attracted particular attention because, unlike any other WD, it displays sharp emission lines. A first comprehensive NLTE model-atmosphere analysis (Werner et al. 1994) showed that KPD 0005+5106 is the hottest known DO (Teff = 120 000 K). In subsequent years, many new DOs were discovered, in particular by the Sloan Digital Sky Survey, and some of them challenged the role of KPD 0005+5106 as the hottest representative of its class (Hügelmeyer et al. 2006). High-resolution spectroscopy with the Far Ultraviolet Spectroscopic Explorer (FUSE), however, pointed at an even higher Teff for KPD 0005+5106. The discovery of Ne viii and Ca x lines suggested Teff ≈ 200 000 K and preliminary modelling showed that this high Teff also improves the model fit to the He ii line spectrum (Werner et al. 2007, 2008). This solved a problem connected with a number of emission features that were previously identified as O viii lines. These would require extremely high temperatures (≈106 K) so that their origin was attributed to shock fronts in a stellar wind. Instead, it turned out that these features are Ne viii lines that form in the hot photosphere.
We perform a systematic analysis of UV and optical spectra to constrain Teff , log g, and element abundances. Determination of the element abundance pattern offers the possibility of connecting KPD 0005+5106 to other He-rich post-AGB stars in order to establish the possible existence of another He-rich evolutionary sequence in parallel to the [WC]–PG1159 phases. Going beyond our exploratory work (Werner et al. 2007), we use here NLTE model atmospheres with extended model atoms for all identified species. We perform abundance determinations for metals (C, N, O, Ne, Si, S, Ca, Fe) and derive an upper limit for H. In our previous study (Werner et al. 1994) we examined C, N, O, but the results became spurious with the revision of Teff . As before, our analysis utilises Hubble Space Telescope (HST) GHRS and FOS UV spectra and medium-resolution optical spectroscopy. In addition we now have far-UV FUSE spectra available plus high-resolution optical spectra obtained with the 10 m Keck telescope. FUSE spectroscopy turned out to be the most useful observation.
Ultraviolet photospheric lines (λ < 3000 Å, vacuum wavelengths) identified in KPD 0005+5106.
continued. Lines with λ > 3000 Å (air wavelengths).
In the next part (Sect. 2) we present an overview of the observational data and perform a detailed line identification. This is worthwhile because KPD 0005+5106 has the most highly ionised photosphere of any star known (aside from neutron stars, of course), and thus serves as a reference for any future discovery of similar objects. In particular, we have found for the first time lines of Si vii, S vii, and Fe x, whose mere presence confirms the high Teff .
We then describe our model atmospheres in some detail with respect to the design of our NLTE model atoms (Sect. 3). The results of our analysis are presented in Sect. 4. We conclude with a discussion of the evolutionary context in Sect. 5.
2. Observations and line identifications
We utilised HST, FUSE, Calar Alto, and Keck spectroscopy. All datasets were described in our earlier publications cited in the introduction. In essence, the FUSE spectra cover the FUV range (912−1180 Å) with a resolution of 0.05−0.1 Å. The HST spectra cover the UV range (1150−3300 Å) with different resolutions (0.1−1 Å), depending on the detailed instrumental setup. In the optical range, we used spectra obtained with the Calar Alto 3.5 m telescope (3350−6700 Å) at resolutions of 1.5−3 Å and Keck data (4270−6710 Å) with 0.1 Å resolution. We did inspect archival UV spectra obtained with IUE, ORFEUS, and HUT, but their quality is inferior.
All spectra were scrutinised for photospheric lines that have not been discovered or identified before. In many cases, this was done by looking in synthetic spectra for possible line candidates. Problems with imprecisely known line positions are described in some detail below. All identified photospheric lines are specified in Table 1. In summary, we see lines from the following metal ions: C iv, N v, O vi, Ne vii-viii, Si vii, S vi–vii, Ca x, and Fe x.
For a few lines, the observed positions deviate significantly from those given in the atomic databases (or those calculated from the given level energies). These are the discovered S vii line (see Sect. 2.3) and a pair of Fe x lines (Sect. 2.4), plus two Ca x lines (reported by Werner et al. 2008) in the FUSE spectrum, as well as two Ne vii lines in the optical (λλ 5665, 5669 Å; Werner et al. 2007). We also note that a few O vi UV lines have positions that were empirically determined from observations of PG1159−035 (Jahn et al. 2007).
2.1. Hydrogen and helium
The spectrum of KPD 0005+5106 is dominated by ionised helium lines, which are mostly broad and shallow except for the UV Balmer lines (Fig. 1). The He ii λλ 4686, 6560 Å lines exhibit prominent central emission reversals. The emission line near λ 4339 Å is not from He ii but from Ne viii. There is no hint of any features from the hydrogen Balmer lines (Fig. 2).
It turns out that fine-structure splitting of the λ He ii 4686 Å line is large enough to have a detectable effect on the sharp Doppler emission-line core at the spectral resolution of the Keck spectrum. The individual components have a maximum separation of 0.54 Å, which is of the same order of magnitude as the Doppler width at T = 200000 K (0.50 Å). The emission-peak height is slightly reduced, but it is still too high compared to the observation (Fig. 3). An additional broadening agent could be stellar rotation. When the line is folded with a rotation profile according to 3sini = 52 km s-1, then the observation is matched much better. However, the emission-peak height is very sensitive to atmospheric parameters, in particular to the metal abundances.
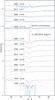 |
Fig. 1 Observed He ii line profiles of the Pickering, Fowler, and Balmer series (from top to bottom) compared to a model with Teff = 200 000 K and log g= 6.7. The model includes metals with the finally adopted abundances. For comparison, the λ 6560 Å line (top) from a pure-helium model is shown (dashed). The corresponding temperature structures are displayed in Fig. 11. |
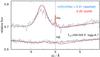 |
Fig. 2 He ii line cores near the positions of Hα and Hβ. Overplotted are two models with different hydrogen abundance. The more hydrogen-rich model exhibits an unobserved emission core in Hα whereas it produces an unobserved depression in the range ± 5 Å around the line centre of Hβ. |
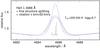 |
Fig. 3 Effect of fine-structure splitting (dashed line) and rotational broadening (thick full line) on the emission core of He ii λ 4686 Å (thin full line; strongest emission core). To account for instrumental broadening, all model profiles were convolved with a Gaussian with FWHM = 0.1 Å. The positions of the individual line components are indicated by vertical bars, whose length is proportional to the gf-value. The data gap around 4684 Å stems from incomplete coverage of Echelle orders. |
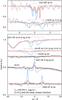 |
Fig. 4 Observed C iv lines and two models with different carbon abundances. Note the absence of the 3s-3p doublet at λ 5800 Å. The model with the higher carbon abundance exhibits much too strong emission lines. Here and in following figures: wavelengths given at line identifications correspond to Δλ = 0 Å. |
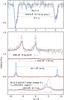 |
Fig. 5 Observed N v lines and two models with different nitrogen abundances. |
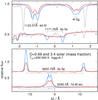 |
Fig. 6 Observed O vi lines and two models with different oxygen abundances. |
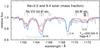 |
Fig. 7 Observed Ne viii lines and two models with different neon abundances. |
2.2. C, N, O, Ne, and Ca
A number of lines (well known from PG1159 stellar spectra) from lithium-like C, N, and O ions (C iv, N v, O vi; e.g. Miksa et al. 2002) is present (Figs. 4−6). It is remarkable that a few other, usually prominent lines from these ions are not seen in KPD 0005+5106. The complete lack of the emission feature of O vi λ 5292 Å and the C iv λλ 5801/5812 Å emission doublet imposes strong constraints on the photospheric parameters (Sect. 4.1). We do not confirm Feibelman’s (1999) identification of an O vii line at λ 1522 Å in IUE data. Our test calculations indicate that KPD 0005+5106 is not hot enough to exhibit excited O vii lines. The existence of this feature is not confirmed by the higher quality FOS spectrum.
Several Ne viii lines are found in the entire UV and optical wavelength regions (Fig. 7). Most of them have already been reported in Werner et al. (2007). We do not see Ne vii λ 3644 Å, imposing a lower limit on Teff . On the other hand, two weak Ne vii emission lines appear at λλ 5665/5669 Å; however, they stem from very highly excited levels, which are not included in our model atom.
The appearance of the Ca x λλ 1137/1159 Å doublet in KPD 0005+5106 was reported earlier (Werner et al. 2008). Together with the Ne viii lines, they point to very high Teff .
2.3. Silicon and sulphur
We have identified lines of Si vii. This is the first discovery of such highly ionised silicon in a stellar photosphere. In the λ 1132–1156 Å range, we find six lines from the triplet and quintet systems (Fig. 8), and a singlet at λ 1236 Å. We do not see lines from the adjacent ionisation stages Si vi and Si viii (Fig. 9). This serves to confirm and constrain the very high Teff of KPD 0005+5106.
The S vi λλ 933/944 Å resonance doublet is strongly blended by interstellar lines. The λ 944 Å component is probably present. Another subordinate and unblended line of S vi at λ 1118 Å was discovered (Fig. 10). A search for weak S vii lines that are predicted by our models was positive (3s 3Po−3p 3S transitions at λλ 1051.54, 1102.83, 1175.4 Å; Kentucky database1 wavelengths). The first component was discovered at a slightly redshifted (≈0.2 Å) position (listed in Table 1). The second and third components are weaker and are not identified in the observation. S viii lines are very weak in the models and cannot be detected in the FUSE spectra. With S vi/S vii we have another independent ionisation balance in hand to constrain Teff .
2.4. Iron
KPD 0005+5106 is much too hot to exhibit Fe vii lines. This confirms our earlier suspicion (Werner et al. 1996; Miksa et al. 2002) that the Fe vii λ 1232.69 Å line identified by Feibelman & Bruhweiler (1990) is in fact an interstellar Mg ii line. Only two Fe ix lines from the Kurucz (2009) POS list (λλ 955.84, 973.71 Å) are predicted by our models to be potentially strong enough to be identified in KPD 0005+5106, but only if the abundance is roughly 1 dex oversolar. The former is the strongest but unfortunately, it is located in the wing of a strong blend of interstellar lines.
The iron ionisation structure (Fig. 11) shows that it is more promising to look for lines from Fe x and Fe xi, however, no Kurucz data are available for these ions. The Opacity Project (OP) and Iron Project (TIPTOPbase2, Seaton et al. 1994; Hummer et al. 1993) line lists used for our model calculations give only computed (and no observed) line positions, and the lines are not fine-structure split.
For Fe x we found candidates from the Kentucky and CHIANTI (Dere et al. 1997, 2009) databases. They are three lines from a transition in the doublet system, located at λλ 980.2, 1017.9, and 1023.1 Å. Their positions are uncertain by 0.9 Å, according to the Kentucky database. The two strongest components (λλ 980.2 and 1023.1 Å) have high gf-values (1.90 and 1.33). Within the uncertainty range, there are two strong features in the FUSE spectrum (at λλ 979.3 and 1022.9 Å) that we identify with these lines (Fig. 12, Table 1). We can calculate the true fine-structure splitting of the energy levels from the two observed lines’ positions and determine the expected position of the third component (which is much weaker; gf = 0.095). It is almost 1 Å blueward of the listed position: λ 1016.95 Å. In the spectrum of KPD 0005+5106 this is located in the wing of an interstellar H2 line and cannot be detected.
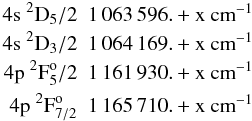
For our spectrum calculation, we used the oscillator strength of this doublet transition from the OP database. The gf values of the fine-structure split lines were calculated according to quantum-mechanical prescription. Our empirically derived level energies related to this particular Fe x transition represent an improvement of the atomic databases:
We also discovered the Fe x lines in the hottest PG1159 stars, which for the first time enables us to determine the iron abundance in this spectral class (Werner et al. 2010).
2.5. Unidentified photospheric lines
A few, probably photospheric lines remain unidentified (Table 2). In the UV some sulphur or silicon lines with uncertain wavelength positions appear in our synthetic spectra for which we fail to identify a counterpart in the observation. The two unidentified optical emission lines could stem from highly excited Ne vii or Ne viii Rydberg states with unknown level energies.
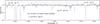 |
Fig. 8 Observed Si vii multiplets and two models with different silicon abundances. Some components of a triplet and a quintet transition are identified (top identification bars). Two weak components of another modelled triplet transition (lower identification bar) are not detectable in the observation. Other absorption lines have interstellar origins. |
3. Model atmospheres and synthetic spectra
3.1. Course of analysis
We used the Tübingen Model Atmosphere Package TMAP (Werner et al. 2003; Rauch & Deetjen 2003) to compute plane-parallel non-LTE line-blanketed model atmospheres in radiative and hydrostatic equilibrium. The models include all the elements ever discovered in KPD 0005+5106 except iron, plus hydrogen (i.e. H, He, C, N, O, Ne, Si, S, Ca). Table 3 summarises the utilised model atoms. For computational reasons, the model atmosphere structure was computed with somewhat smaller model atoms for nitrogen and calcium. N viii was omitted and N vii represented by its ground state only, and Ca x had 15 NLTE levels linked by 44 lines. Numbers of NLTE levels and lines for silicon ions were (15, 20), (20, 36) for Si v,vi, respectively. The larger versions of these model atoms as listed in Table 3 were subsequently used to further iterate the atomic population numbers, keeping fixed the atmospheric temperature and pressure structure. Iron was not included in the model computations. Its NLTE level populations were then computed for a fixed model structure.
The computing time for a single model atmosphere is too long to compute an extensive grid with Teff , log g, and element abundances as parameters. We first computed a grid of pure-helium models with different Teff and log g in order to achieve a fit to the He ii lines. We then performed an element-by-element study by including one additional species in the helium models to derive a first estimate for the metal abundances. In this step we also checked whether the metal lines give additional constraints to Teff and log g by inspecting ionisation equilibria. Then a small grid of full model atmospheres (including all metals with a particular abundance pattern) with different Teff and log g was computed in the vicinity of the finally adopted values 200 000 K and 6.7, respectively. We then made fine adjustments to these parameters by cross-checking the He ii and metal line fits and adjusting the individual element abundances.
In Fig. 11 we display the ionisation structure of the model with the finally adopted parameters, as well as the run of temperature. For comparison we show the temperature structure of a pure-helium model, which has a high-temperature plateau in the outer layers. The influence of the metals by line blanketing and surface cooling are very strong and justify the computationally expensive NLTE modelling. As an example, we compared the He ii λ 6560 Å line of our final model to that of a pure-helium model (Fig. 1) and realise that the latter profile is much too shallow to fit the observation.
An unexpected numerical problem occurred with our model atmosphere code. Unrealistic upward and downward spikes in the form of a narrow hysteresis curve occurred around a particular frequency point on the red and blue sides of the emission core of the He ii λ 6560 Å line (and to a less significant extent in the weaker emission cores of He ii λλ 5412, 4859 Å). That effect can escape attention when the frequency grid is coarse enough, such that this hysteresis feature is not sampled. Close inspection revealed that the problem originates from the radiation transfer solver that, under certain circumstances, runs into numerical problems when the total opacity becomes negative between two adjacent depth points. The problem arises regardless of the solution technique used, whether a short-characteristic method or a Feautrier method. We suspect that the problem can be solved with an improved Feautrier scheme that leads to better numerical conditioning for small optical depth increments (Rybicki & Hummer 1991).
A simple way to work around this problem is to refine the depth grid of the model atmosphere and then to perform a final formal solution of the transfer equation. To do this, we refined our depth grid from 90 to 1000 points with a linear interpolation of all population densities and temperature, and the problem disappeared completely.
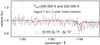 |
Fig. 9 The absence of Si viii lines puts an upper limit to Teff . We show two lines of a strong multiplet from two models with different Teff . The hotter model shows deeper lines. They are not detectable in the FUSE spectrum. The depression at λ > 1184 Å is due to broad Ne viii lines. |
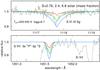 |
Fig. 10 Observed S vi (top panel) and S vii (bottom) lines and profiles from three models with different sulphur abundance. |
Measured wavelength positions of unidentified lines, possibly of photospheric origin.
Summary of model atoms used in the NLTE calculations.
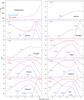 |
Fig. 11 Vertical run of temperature (top left panel) and ionisation fractions fi of elements in a model with Teff = 200 000 K and log g= 6.7. The temperature structure of a pure-helium model is shown for comparison. |
3.2. Model atoms
Model atoms for most species were taken over from previous work. Those for H, He, C, N, and O were described, e.g. in Jahn et al. (2007). CNO models were extended to higher ionisation stages in order to obtain correct ionisation equilibria. For Ne and Ca models see Werner et al. (2007, 2008). Generally, fine-structure splitting of energy levels and detailed line broadening is accounted for in the final formal solution for the radiation transfer equation, by which the synthetic spectra are obtained.
Strong effort in the present context was necessary for the new construction of high ionisation stages of sulphur and, in particular, silicon model atoms, because of the discovery of several Si vii lines in the FUSE spectra. Figure 13 is a Grotrian diagram of our Si v-viii model which, together with the information given in Table 1, allows us to locate the investigated line transitions.
As sources for atomic data, we used the atomic databases of NIST3 and CHIANTI for the energy levels and the OP and Iron Project for the oscillator strengths. The Kentucky database was used for spectral line positions and oscillator strengths. The energy levels and line lists from Kurucz (2009) were used for the iron model ions Fe vii-ix.
We must refrain here from a detailed description of the design of the model atoms. Many test calculations were performed, e.g., in order to decide which f-values are selected from which database. However, all our model atoms are publicly available. They were developed within the framework of the German Astrophysical Virtual Observatory (GAVO4) project and are staged in the Tübingen Model-Atom Database TMAD5.
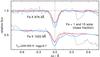 |
Fig. 12 Observed Fe x lines and two models with different Fe abundances. A strong ISM line is cut out at Δλ = 0.5 Å. |
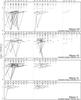 |
Fig. 13 Grotrian diagrams of our model ions for Si v-viii. All levels that are linked by line transitions are treated in NLTE, others in LTE. Thick drawn are levels with energies from NIST, all others are from OP. |
Derived parameters and distance of KPD 0005+5106.
Element abundances in KPD 0005+5106 given in various units: number ratio relative to helium nX/nHe, mass fractions βX, and mass fractions in solar units βX/β⊙.
4. Results
The results of our analysis are summarised in Tables 4 and 5.
4.1. Effective temperature and surface gravity
There is not a single model that perfectly fits all line features simultaneously. We adopted error estimates for Teff (10%) and log g (±0.3 dex) such that we did find a model that can reproduce the spectral lines of different elements in the respective parameter range. For example, to have the Ca x lines in emission the model needs to have a relatively low log g(6.5 at Teff = 200 000 K). On the other hand, the lack of the emission features of O vi at λ 5292 Å and C iv λ 5801/5812 Å requires a model with relatively low Teff (about 180 000 K at log g= 6.7). The presence of Ne viii lines over the entire UV and optical bands and the lack of Ne vii λ 3644 Å initiated our revision of Teff from 120 000 K to 200 000 K, as already mentioned.
Silicon turned out to be another independent Teff indicator. The presence of Si vii lines and the absence of any line of the adjacent ionisation stages excludes temperatures below 180 000 K and above 220 000 K (Figs. 8, 9). The sulphur ionisation balance is even more useful, because S vi and S vii lines are detected (Fig. 10). The best fit is obtained at Teff = 200 000 K. Increasing or decreasing Teff by 10% results in S vi or S vii lines, respectively, that are too weak. There is a dependence of the metal ionisation balances, hence their line strengths, on gravity. This was accounted for by constraining Teff and log g from the fit to the He ii lines.
4.2. Abundances
We varied the metal abundances in a Teff /log ggrid of models within the error ranges of these parameters. The effect of these abundance variations on the line profiles is exemplified for carbon (Fig. 4), nitrogen (Fig. 5), oxygen (Fig. 6), neon (Fig. 7), silicon (Fig. 8), sulphur (Fig. 10), and iron (Fig. 12). For a detailed study of the Ca x lines see Werner et al. (2008). The resulting abundances are listed in Table 5. We estimate the errors to be in the order of 0.5 dex, except for calcium. The Ca x emission lines are most sensitive to Teff and log g such that an error of 1 dex must be accepted. To significantly reduce the uncertainties we would primarily need to put a tighter constraint on Teff . This could be achieved with high-resolution UV spectra in the wavelength range accessible to HST, where we expect many more weak metal lines of different ionisation stages.
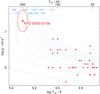 |
Fig. 14 Location of KPD 0005+5106 in the log g–log Teff diagram together with all other known DO white dwarfs. The evolutionary tracks for H-deficient WDs are from Althaus et al. (2009). They are labeled with the respective masses in solar units. |
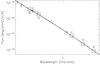 |
Fig. 15 Extinction-corrected synthetic spectrum and broad-band photometry. |
4.3. Mass, luminosity, distance
The position of KPD 0005+5106 in the Teff /log g diagram is shown in Fig. 14. We derived stellar mass, radius, and luminosity (see Table 4) from a comparison with evolutionary tracks for DO white dwarfs taken from Althaus et al. (2009). The star is about to enter the WD cooling sequence. Strictly speaking, it is still a pre-WD: About 80% of its luminosity is generated by helium-shell burning.
The spectroscopic distance was estimated from
 using the derived mass, where Fν is the astrophysical flux at the surface of the star taken from the synthetic spectrum, and Fobs is the observed flux after correction for extinction. Extinction was determined by a comparing the synthetic photometry derived from the model spectrum with the observed visible (Downes et al. 1985) and 2MASS (Skrutskie et al. 2006) NIR photometry; the resulting parameters were E(B−V) = 0.124 and RV = 2.59. Zero points for the visible and NIR magnitudes were taken from Cohen et al. (2003a) and Cohen et al. (2003b), respectively.
The extinction A(λ) was then calculated with the formalism of Cardelli et al. (1989). Essentially identical results were obtained using the mean extinction curve given by Fitzpatrick & Massa (2007; hereafter FM07), as amended in the NIR by Fitzpatrick & Massa (2009). Table 6 gives the measured and extinction-corrected magnitudes, and the spectroscopic distance computed from the flux in each band. Extinction in each band (Col. 3) was obtained by fitting synthetic photometry derived from the model spectrum to the observed magnitudes (Col. 2). Corrected magnitudes are in Col. 4, and the corresponding spectroscopic distances are in Col. 5. The mean spectroscopic distance is 581 pc. The extinction-corrected synthetic spectrum and broad-band photometry are plotted in Fig. 15.
These extinction parameters provide a good fit to the broad-band photometry, but overestimate the extinction in the UV. A fit to the entire spectral energy distribution, from the NIR through the FUV, yields extinction parameters of RV = 3.0 and E(B−V) = 0.07. These parameters give a slightly greater distance of 600 pc. However, as discussed in detail by FM07, the parameters describing the UV extinction are poorly correlated with those describing the optical-NIR extinction. As we are interested in obtaining an estimate of the distance and not in the extinction itself, we have restricted this analysis to optical-NIR wavelengths. This has the advantage that the extinction is smaller, resulting in less sensitivity to measurement uncertainties, and the shape of the extinction curve varies less from one sightline to another (see, e.g., Fig. 15 of FM07).
Broad-band photometry for KPD 0005+5106.
5. Summary and conclusions
We have determined the photospheric parameters of KPD 0005+5106 using all relevant spectroscopic UV and optical observations in concert with line-blanketed non-LTE model atmospheres. We confirm the extremely high effective temperature and relatively low surface gravity. This clearly separates KPD 0005+5106 from all other known DO white dwarfs. Strictly speaking, it is a pre-white dwarf, located before the “knee” in the HRD. It is still helium-shell burning and has not yet reached its maximum Teff . We determined the element abundance pattern. All metals are trace elements in a helium-dominated atmosphere that is devoid of hydrogen.
Effective temperature and luminosity of KPD 0005+5106 are so high that a very weak radiation driven wind prevents gravitational settling of heavy elements in the atmosphere (Unglaub & Bues 2000). It therefore must have descended from the AGB as an object with an already helium-dominated surface. It is possible that KPD 0005+5106 could be a descendant of the RCrB stars, which are relatively cool post-AGB objects.
For RCrB stars two origins for their H-deficiency have been discussed in the literature for many years (e.g. Clayton 1996; de Marco et al. 2002). Either they are the result of a late thermal pulse (LTP) or of a merging process of two white dwarfs (double-degenerate scenario). Saio & Jeffery (2002) have established the CO + He white dwarf merger as the best viable model for the majority of the RCrB stars. On the other hand, the LTP scenario can be ruled out, because it does not result in a helium-rich surface abundance as encountered in KPD 0005+5106 (Werner & Herwig 2006). Thus it seems inevitable that both KPD 0005+5106 and the RCrB stars are mergers and form a distinct evolutionary post-AGB sequence. This would be a third sequence with the canonical hydrogen-rich and the LTP-initiated hydrogen-deficient sequences (PG1159 and [WC] stars).
If true, then we expect similar element abundances in KPD 0005+5106 and the RCrB stars. We compare them in Table 5. We used the abundances determined for the so-called majority RCrB stars (Rao & Lambert 1996), except for neon, which is determined only in a few RCrB stars. We selected the abundance of Y Mus, the only member of the majority RCrBs for which Asplund et al. (2000) could measure the Ne abundance. The uncertainties are in the range 0.2−0.5 dex, varying from element to element. There seems to be surprisingly good agreement between the RCrB and KPD 0005+5106 abundances, except for calcium and iron. Calcium, however, has the greatest uncertainty in our analysis (about 1 dex). More difficult to reconcile are the solar iron abundance in KPD 0005+5106 and the 1 dex subsolar iron abundances in RCrBs.
Acknowledgments
T.R. is supported by the German Aerospace Center (DLR) under grant 05 OR 0806. Some of the data presented in this paper were obtained from the Multimission Archive at the Space Telescope Science Institute (MAST). This work made use of the profile-fitting procedure OWENS developed by M. Lemoine and the FUSE French Team. This research made use of the SIMBAD Astronomical Database, operated at the CDS, Strasbourg, France. This publication makes use of data products from the Two Micron All Sky Survey, which is a joint project of the University of Massachusetts and the Infrared Processing and Analysis Center/California Institute of Technology, funded by the National Aeronautics and Space Administration and the National Science Foundation.
References
- Althaus, L. G., Panei, J. A., Miller Bertolami, M., et al. 2009, ApJ, 704, 1605 [NASA ADS] [CrossRef] [Google Scholar]
- Asplund, M., Gustafsson, B., Lambert, D. L., & Rao, N. K. 2000, A&A, 353, 287 [NASA ADS] [Google Scholar]
- Asplund, M., Grevesse, N., Sauval, A. J., & Scott, P. 2009, ARA&A, 47, 481 [NASA ADS] [CrossRef] [Google Scholar]
- Cardelli, J. A., Clayton, G. C., & Mathis, J. S. 1989, ApJ, 345, 245 [NASA ADS] [CrossRef] [Google Scholar]
- Clayton, G. 1996, PASP, 108, 225 [NASA ADS] [CrossRef] [Google Scholar]
- Cohen, M., Megeath, S. T., Hammersley, P. L., Martín-Luis, F., & Stauffer, J. 2003a, AJ, 125, 2645 [CrossRef] [Google Scholar]
- Cohen, M., Wheaton, W. A., & Megeath, S. T. 2003b, AJ, 126, 1090 [NASA ADS] [CrossRef] [Google Scholar]
- De Marco, O., Clayton, G., Herwig, F., et al. 2002, AJ, 123, 3387 [NASA ADS] [CrossRef] [Google Scholar]
- Dere, K. P., Landi, E., Mason, H. E., Monsignori Fossi, B. C., & Young, P. R. 1997, A&AS, 125, 149 [NASA ADS] [CrossRef] [EDP Sciences] [Google Scholar]
- Dere, K. P., Landi, E., Young, P. R., et al. 2009, A&A, 498, 915 [NASA ADS] [CrossRef] [EDP Sciences] [Google Scholar]
- Downes, R. A., Liebert, J., & Margon, B. 1985, ApJ, 290, 321 [NASA ADS] [CrossRef] [Google Scholar]
- Feibelman, W. A. 1999, PASP, 111, 221 [NASA ADS] [CrossRef] [Google Scholar]
- Feibelman, W. A., & Bruhweiler, F. C. 1990, ApJ, 357, 548 [NASA ADS] [CrossRef] [Google Scholar]
- Fitzpatrick, E. L., & Massa, D. 2007, ApJ, 663, 320 [NASA ADS] [CrossRef] [EDP Sciences] [Google Scholar]
- Fitzpatrick, E. L., & Massa, D. 2009, ApJ, 699, 1209 [NASA ADS] [CrossRef] [Google Scholar]
- Hügelmeyer, S. D., Dreizler, S., Homeier, D., et al. 2006, A&A, 454, 617 [NASA ADS] [CrossRef] [EDP Sciences] [Google Scholar]
- Hummer, D. G., Berrington, K. A., Eissner, W., et al. 1993, A&A, 279, 298 [NASA ADS] [Google Scholar]
- Jahn, D., Rauch, T., Reiff, E., et al. 2007, A&A, 462, 281 [NASA ADS] [CrossRef] [EDP Sciences] [Google Scholar]
- Kurucz, R. L. 2009, in Recent Directions in Astrophysical Quantitative Spectroscopy and Radiation Hydrodynamics, ed. I. Hubeny, J. M. Stone, K. MacGregor, & K. Werner, AIP Conf. Proc., 1171, 43 [Google Scholar]
- Miksa, S., Deetjen, J. L., Dreizler, S., et al. 2002, A&A, 389, 953 [NASA ADS] [CrossRef] [EDP Sciences] [Google Scholar]
- Rao, N. K., & Lambert, D. L. 1996, in Hydrogen-Deficient Stars, ed. C. S. Jeffery, & U. Heber, ASP Conf. Ser., 96, 43 [Google Scholar]
- Rauch, T., & Deetjen, J. L. 2003, in Stellar Atmosphere Modeling, ed. I. Hubeny, D. Mihalas, & K. Werner, ASP Conf. Ser., 288, 103 [Google Scholar]
- Rybicki, G. B., & Hummer, D. G. 1991, A&A, 245, 171 [NASA ADS] [Google Scholar]
- Saio, H., & Jeffery, C. S. 2002, MNRAS, 333, 121 [NASA ADS] [CrossRef] [Google Scholar]
- Seaton, M. J., Yan, Y., Mihalas, D., & Pradhan, A. K. 1994, MNRAS, 266, 805 [NASA ADS] [CrossRef] [Google Scholar]
- Skrutskie, M. F., Cutri, R. M., Stiening, R., et al. 2006, AJ, 131, 1163 [NASA ADS] [CrossRef] [Google Scholar]
- Unglaub, K., & Bues, I. 2000, A&A, 359, 1042 [NASA ADS] [Google Scholar]
- Werner, K., & Herwig, F. 2006, PASP, 118, 183 [NASA ADS] [CrossRef] [Google Scholar]
- Werner, K., Heber, U., & Fleming, T. 1994, A&A, 284, 907 [NASA ADS] [Google Scholar]
- Werner, K., Dreizler, S., Heber, U., et al. 1996, A&A, 307, 860 [NASA ADS] [Google Scholar]
- Werner, K., Dreizler, S., Deetjen, J. L. et al. 2003, in Stellar Atmosphere Modeling, ed. I. Hubeny, D. Mihalas, & K. Werner, ASP Conf. Ser., 288, 31 [Google Scholar]
- Werner, K., Rauch, T., & Kruk, J. W. 2007, A&A, 474, 591 [NASA ADS] [CrossRef] [EDP Sciences] [Google Scholar]
- Werner, K., Rauch, T., & Kruk, J. W. 2008, A&A, 492, L43 [NASA ADS] [CrossRef] [EDP Sciences] [Google Scholar]
- Werner, K., Rauch, T., & Kruk, J. W. 2010, ApJ, 719, L32 [NASA ADS] [CrossRef] [Google Scholar]
All Tables
Ultraviolet photospheric lines (λ < 3000 Å, vacuum wavelengths) identified in KPD 0005+5106.
Measured wavelength positions of unidentified lines, possibly of photospheric origin.
Element abundances in KPD 0005+5106 given in various units: number ratio relative to helium nX/nHe, mass fractions βX, and mass fractions in solar units βX/β⊙.
All Figures
|
Fig. 1 Observed He ii line profiles of the Pickering, Fowler, and Balmer series (from top to bottom) compared to a model with Teff = 200 000 K and log g= 6.7. The model includes metals with the finally adopted abundances. For comparison, the λ 6560 Å line (top) from a pure-helium model is shown (dashed). The corresponding temperature structures are displayed in Fig. 11. |
| In the text | |
|
Fig. 2 He ii line cores near the positions of Hα and Hβ. Overplotted are two models with different hydrogen abundance. The more hydrogen-rich model exhibits an unobserved emission core in Hα whereas it produces an unobserved depression in the range ± 5 Å around the line centre of Hβ. |
| In the text | |
|
Fig. 3 Effect of fine-structure splitting (dashed line) and rotational broadening (thick full line) on the emission core of He ii λ 4686 Å (thin full line; strongest emission core). To account for instrumental broadening, all model profiles were convolved with a Gaussian with FWHM = 0.1 Å. The positions of the individual line components are indicated by vertical bars, whose length is proportional to the gf-value. The data gap around 4684 Å stems from incomplete coverage of Echelle orders. |
| In the text | |
|
Fig. 4 Observed C iv lines and two models with different carbon abundances. Note the absence of the 3s-3p doublet at λ 5800 Å. The model with the higher carbon abundance exhibits much too strong emission lines. Here and in following figures: wavelengths given at line identifications correspond to Δλ = 0 Å. |
| In the text | |
|
Fig. 5 Observed N v lines and two models with different nitrogen abundances. |
| In the text | |
|
Fig. 6 Observed O vi lines and two models with different oxygen abundances. |
| In the text | |
|
Fig. 7 Observed Ne viii lines and two models with different neon abundances. |
| In the text | |
|
Fig. 8 Observed Si vii multiplets and two models with different silicon abundances. Some components of a triplet and a quintet transition are identified (top identification bars). Two weak components of another modelled triplet transition (lower identification bar) are not detectable in the observation. Other absorption lines have interstellar origins. |
| In the text | |
|
Fig. 9 The absence of Si viii lines puts an upper limit to Teff . We show two lines of a strong multiplet from two models with different Teff . The hotter model shows deeper lines. They are not detectable in the FUSE spectrum. The depression at λ > 1184 Å is due to broad Ne viii lines. |
| In the text | |
|
Fig. 10 Observed S vi (top panel) and S vii (bottom) lines and profiles from three models with different sulphur abundance. |
| In the text | |
|
Fig. 11 Vertical run of temperature (top left panel) and ionisation fractions fi of elements in a model with Teff = 200 000 K and log g= 6.7. The temperature structure of a pure-helium model is shown for comparison. |
| In the text | |
|
Fig. 12 Observed Fe x lines and two models with different Fe abundances. A strong ISM line is cut out at Δλ = 0.5 Å. |
| In the text | |
|
Fig. 13 Grotrian diagrams of our model ions for Si v-viii. All levels that are linked by line transitions are treated in NLTE, others in LTE. Thick drawn are levels with energies from NIST, all others are from OP. |
| In the text | |
|
Fig. 14 Location of KPD 0005+5106 in the log g–log Teff diagram together with all other known DO white dwarfs. The evolutionary tracks for H-deficient WDs are from Althaus et al. (2009). They are labeled with the respective masses in solar units. |
| In the text | |
|
Fig. 15 Extinction-corrected synthetic spectrum and broad-band photometry. |
| In the text | |
Current usage metrics show cumulative count of Article Views (full-text article views including HTML views, PDF and ePub downloads, according to the available data) and Abstracts Views on Vision4Press platform.
Data correspond to usage on the plateform after 2015. The current usage metrics is available 48-96 hours after online publication and is updated daily on week days.
Initial download of the metrics may take a while.