Fig. 1
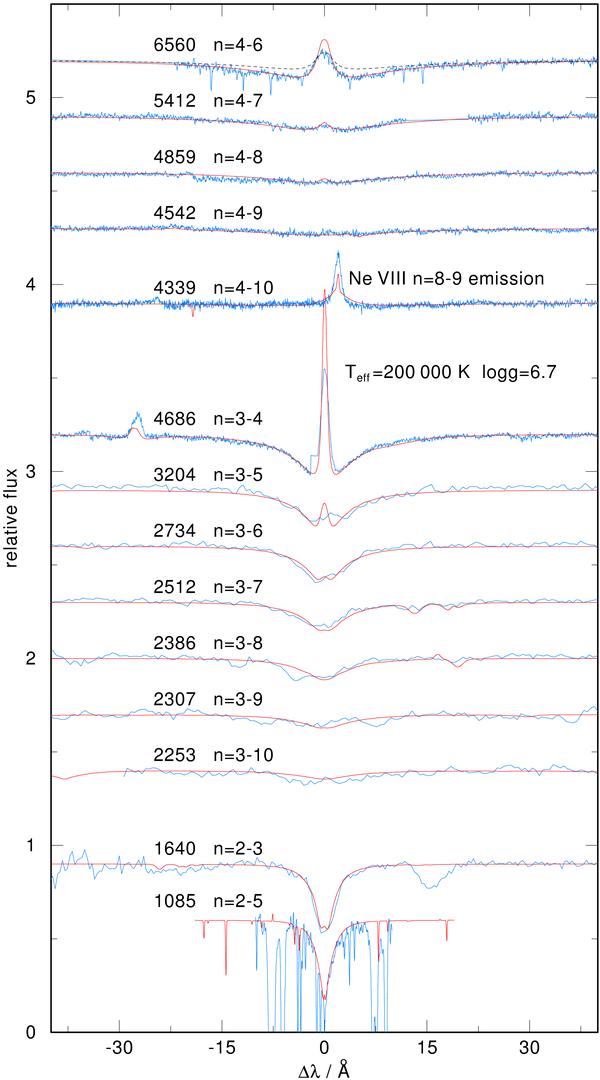
Observed He ii line profiles of the Pickering, Fowler, and Balmer series (from top to bottom) compared to a model with Teff = 200 000 K and log g= 6.7. The model includes metals with the finally adopted abundances. For comparison, the λ 6560 Å line (top) from a pure-helium model is shown (dashed). The corresponding temperature structures are displayed in Fig. 11.
Current usage metrics show cumulative count of Article Views (full-text article views including HTML views, PDF and ePub downloads, according to the available data) and Abstracts Views on Vision4Press platform.
Data correspond to usage on the plateform after 2015. The current usage metrics is available 48-96 hours after online publication and is updated daily on week days.
Initial download of the metrics may take a while.