Free Access
Fig. 4
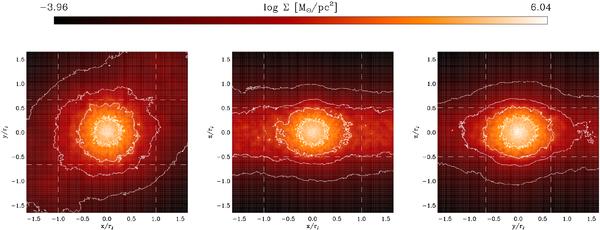
Surface density of projections onto the principal axis planes of the cluster at T4 = 1.31 Gyr. The dashed lines show the theoretical values of xmax/rJ, ymax/rJ, and zmax/rJ. The contours correspond to Δlog Σ ≈ 2 dex.
Current usage metrics show cumulative count of Article Views (full-text article views including HTML views, PDF and ePub downloads, according to the available data) and Abstracts Views on Vision4Press platform.
Data correspond to usage on the plateform after 2015. The current usage metrics is available 48-96 hours after online publication and is updated daily on week days.
Initial download of the metrics may take a while.