Fig. 10
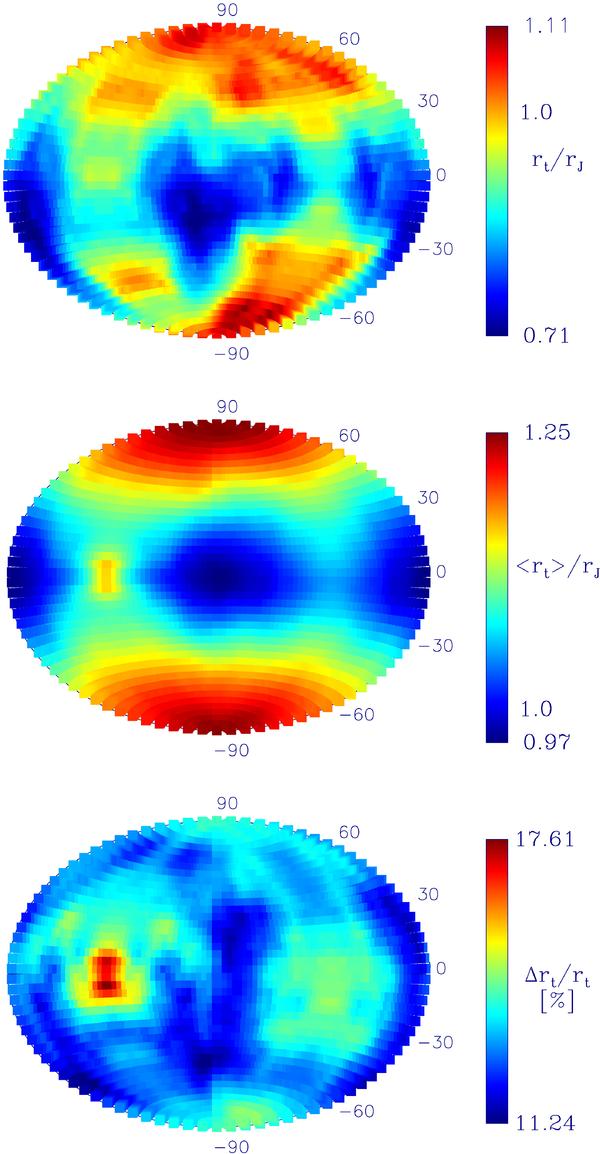
Parameter surfaces of rt/rJ and Δrt/rt as a function of Galactic coordinates for a fit of King (1962) models to to projections on the sky of a simulated model at different positions on its theoretical orbit. We used a squeezed Hammer-Aitoff projection. The time is T4 = 1.31 Gyr. The color denotes the value of rt/rJ (and Δrt/rt, bottom plot) on a linear scale. The upper plots shows the parameter surface for the 400 brightest stars in the simulated cluster (data courtesy of Beuria). The middle and bottom plots show the result of the bootstrap analysis (for explanations see the text). The middle plot shows the mean value of rt/rJ averaged over 100 small-number samples. The bottom plot shows the corresponding relative standard deviation Δrt/rt.
Current usage metrics show cumulative count of Article Views (full-text article views including HTML views, PDF and ePub downloads, according to the available data) and Abstracts Views on Vision4Press platform.
Data correspond to usage on the plateform after 2015. The current usage metrics is available 48-96 hours after online publication and is updated daily on week days.
Initial download of the metrics may take a while.