Fig. 4
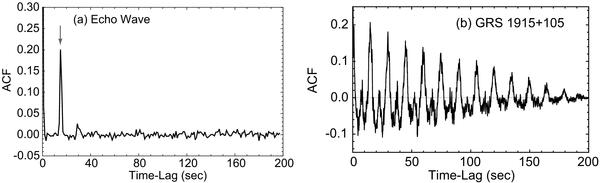
a) The ACF corresponding to the model LC of Fig. 3a showing three characteristic peaks at τ = 0 (self-correlation), ⋍ 14 (shown with arrow) and ⋍28 s. b) The ACF corresponding to the light curve of Fig. 3b for GRS 1915+105 (similar to Fig. 2c except for only T = 200 s here). While the addition of noise can make both LCs look random, their ACFs are fundamentally different.
Current usage metrics show cumulative count of Article Views (full-text article views including HTML views, PDF and ePub downloads, according to the available data) and Abstracts Views on Vision4Press platform.
Data correspond to usage on the plateform after 2015. The current usage metrics is available 48-96 hours after online publication and is updated daily on week days.
Initial download of the metrics may take a while.