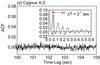
Fig. 2
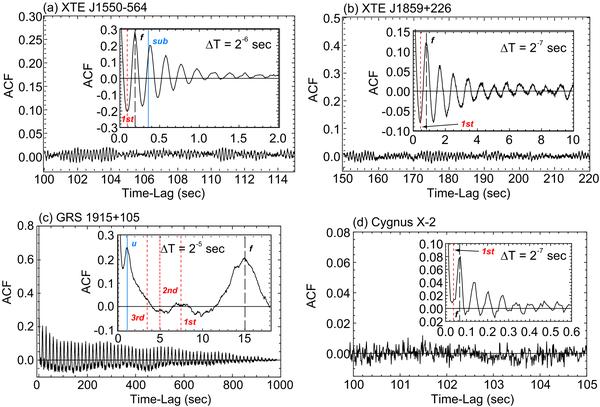
ACFs corresponding to Fig. 1 for both long time-lags (extended to hundreds of seconds) and shorter time-lags (insets) with the temporal resolution ΔT indicated (T ⋍ 1 ks). Vertical lines correspond to the QPO peaks in the PDS from Fig. 1. The error bars in each of the above ACF has been estimated to be on the order of ≃ 0.001−0.01.
Current usage metrics show cumulative count of Article Views (full-text article views including HTML views, PDF and ePub downloads, according to the available data) and Abstracts Views on Vision4Press platform.
Data correspond to usage on the plateform after 2015. The current usage metrics is available 48-96 hours after online publication and is updated daily on week days.
Initial download of the metrics may take a while.