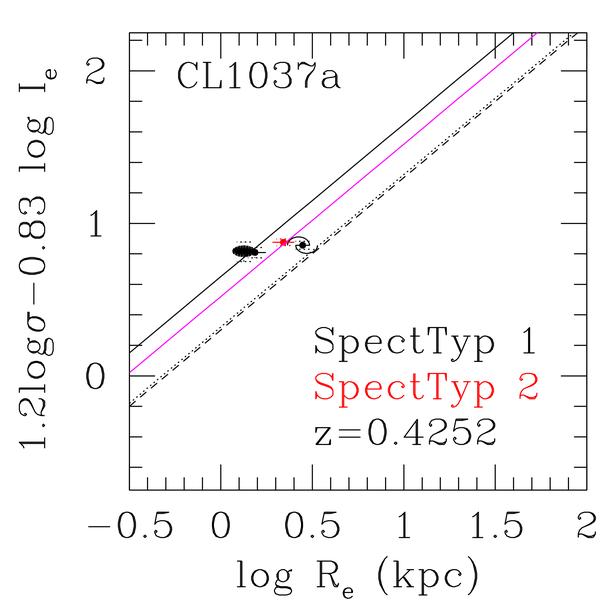
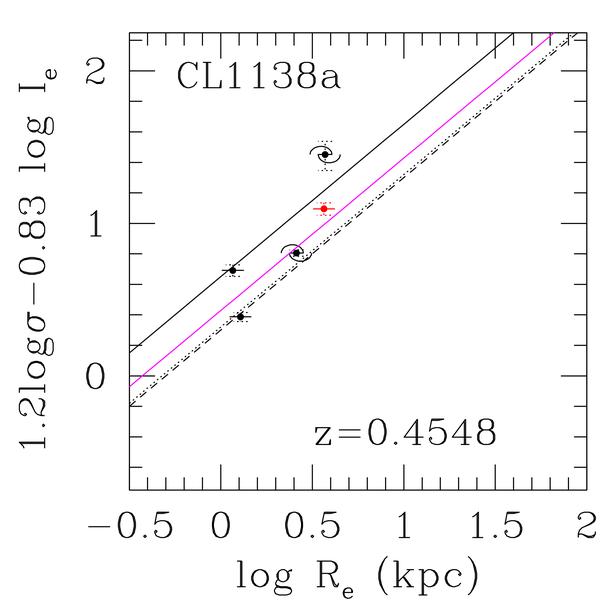
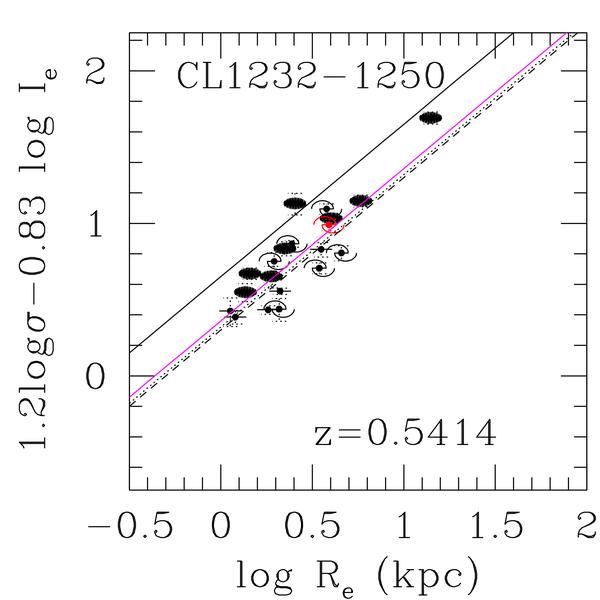
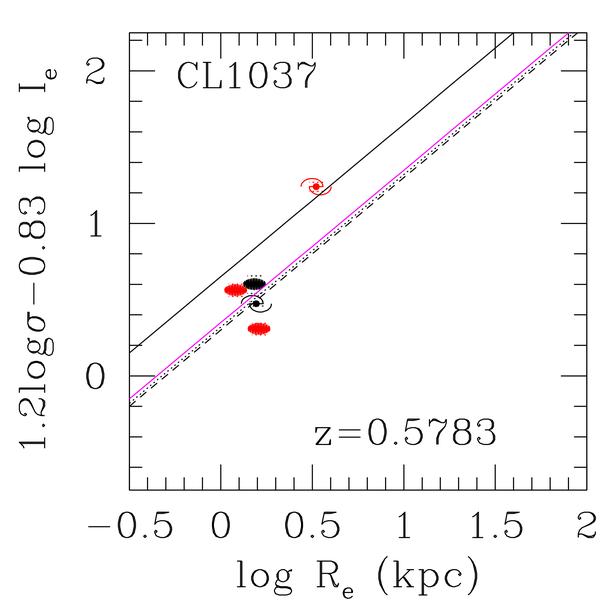
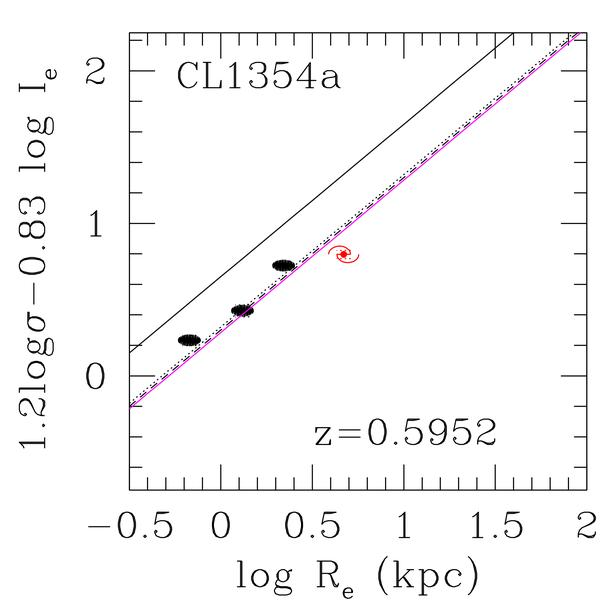
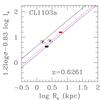
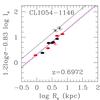
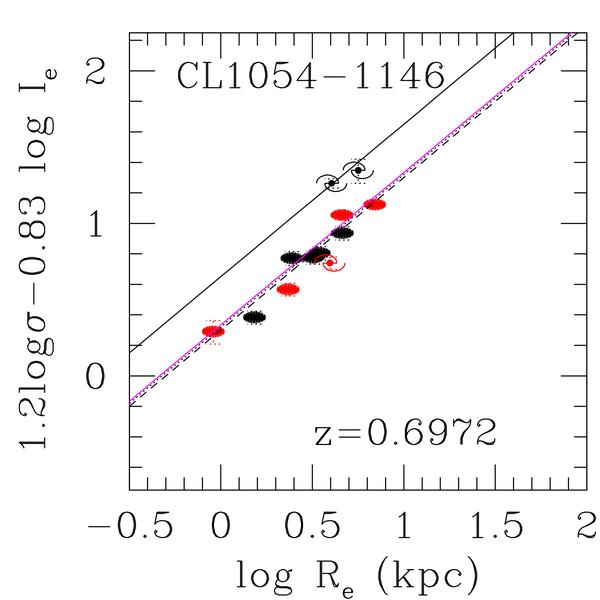
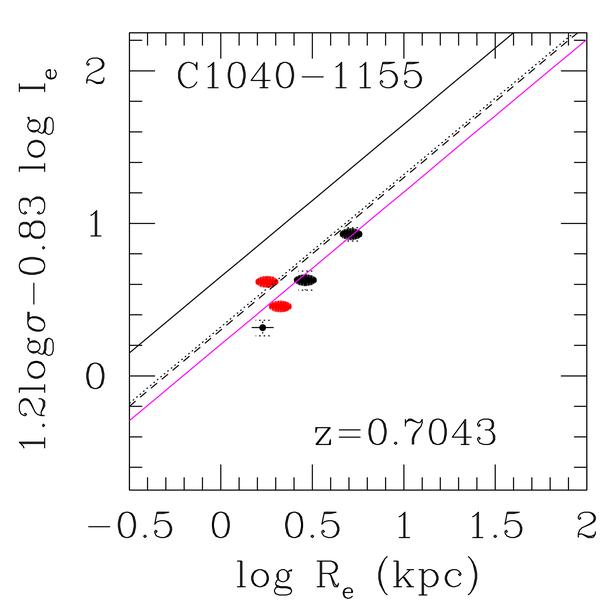
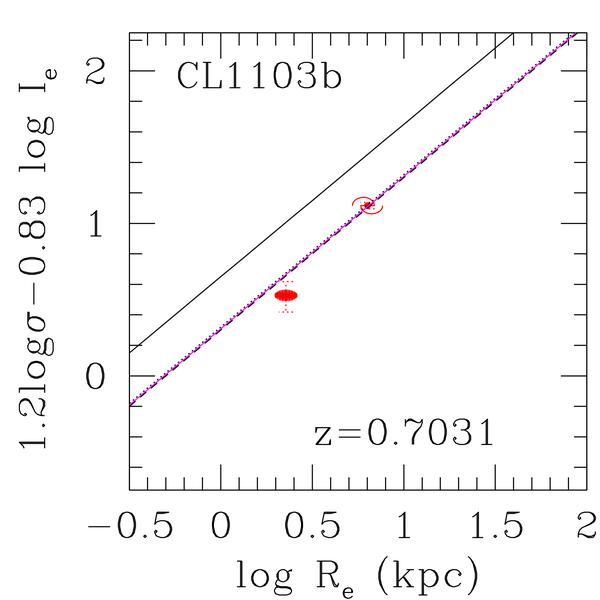
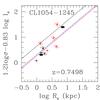
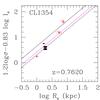
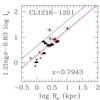
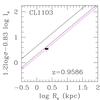
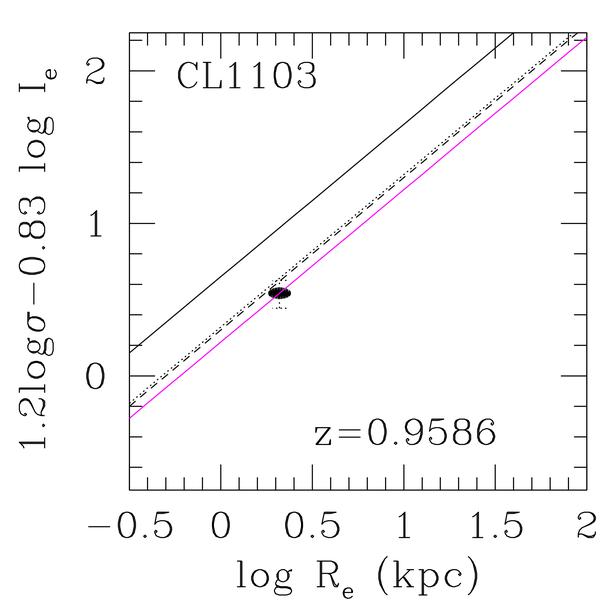
Fig. 14
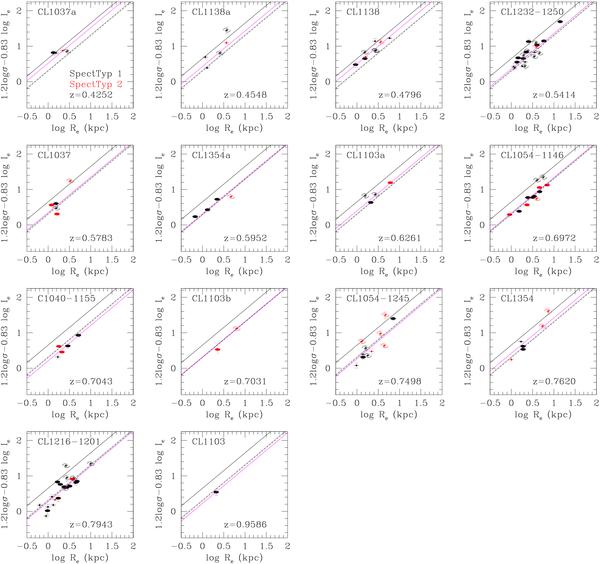
The FP of the EDisCS clusters with HST photometry. Each cluster is identified by its short name for clarity, see Table 4 for the full name. Colors code the spectroscopic type (black = 1, red = 2). Symbols code the morphology: filled ellipses show T ≤ − 4, filled circles crossed by a line − 3 ≤ T ≤ 0, spirals T > 0. The magenta line shows the best-fit FP relation with no selection weighting. The full line shows the Coma cluster at zero redshift. The black dotted and dashed lines show data for the clusters MS2053-04 at z = 0.58 and MS1054-03 at z = 0.83, respectively, from Wuyts et al. (2004).


Current usage metrics show cumulative count of Article Views (full-text article views including HTML views, PDF and ePub downloads, according to the available data) and Abstracts Views on Vision4Press platform.
Data correspond to usage on the plateform after 2015. The current usage metrics is available 48-96 hours after online publication and is updated daily on week days.
Initial download of the metrics may take a while.