| Issue |
A&A
Volume 524, December 2010
|
|
|---|---|---|
| Article Number | A40 | |
| Number of page(s) | 12 | |
| Section | Stellar structure and evolution | |
| DOI | https://doi.org/10.1051/0004-6361/201014494 | |
| Published online | 22 November 2010 | |
Non-linear modelling of beat Cepheids: resonant and non-resonant models
1
Institute for Astronomy (IfA), University of Vienna,
Türkenschanzstrasse 17,
1180
Vienna,
Austria
e-mail: This email address is being protected from spambots. You need JavaScript enabled to view it.
2
Copernicus Astronomical Centre,
Bartycka 18,
00-716
Warszawa,
Poland
e-mail: This email address is being protected from spambots. You need JavaScript enabled to view it.
Received: 24 March 2010
Accepted: 9 August 2010
Abstract
Context. Double-periodic (beat) Cepheids are important astrophysical objects which allow testing both the stellar evolution and stellar pulsation theories, as well as the physical properties of matter in stellar conditions. However, the phenomenon of double-periodic pulsation is still poorly understood. Recently we rediscussed the problem of modelling the double-periodic pulsation with non-linear hydrocodes. We showed that the published non-resonant double-mode models are incorrect, because they exclude the negative buoyancy effects.
Aims. We continue our efforts to verify whether the Kuhfuß one-equation convection model with negative buoyancy included can reproduce the double-periodic Cepheid pulsation.
Methods. Using the direct time integration hydrocode, which implements the Kuhfuß convection model, we search for stable double-periodic Cepheid models. We search for models pulsating in both fundamental and first overtone modes (F+1O), as well as in the two lowest order overtones (1O+2O). In the latter case, we focus on reproducing double-overtone Cepheids of the Large Magellanic Cloud (LMC).
Results. We have found full amplitude non-linear beat Cepheid models of both types, F+1O and 1O+2O. In the case of F+1O models, the beat pulsation is most likely caused by the three-mode resonance, 2ω1 = ω0 + ω2, while in the double-overtone models the underlying mechanism (resonant or non-resonant) cannot be identified beyond doubt. Double-periodic models found in our survey exist, however, only in narrow period ranges and cannot explain the majority of the observed double-periodic objects.
Conclusions. With only little doubt left, we conclude that current one dimensional one-equation convection models are incapable of reproducing the majority of the observed beat Cepheids. Among the shortcomings of current pulsation hydrocodes, the simple treatment of convection seems to be the most severe one. Growing evidence for the presence of non-radial modes in Cepheids suggests that the interaction between radial and non-radial modes should also be investigated.
Key words: hydrodynamics / convection / methods: numerical / stars: oscillations / stars: variables: Cepheids
© ESO, 2010
1. Introduction
Cepheids are periodic variable stars, pulsating radially with periods ranging from a single day to over one hundred days for the most luminous variables. They obey an empirical period-luminosity relation, which ranks them among the most important distance indicators in astrophysics. They populate a rather narrow strip in the HR diagram, called the classical instability strip, in which pulsation is driven by the opacity mechanism acting in hydrogen-helium partial ionisation region. They are giant, relatively cool stars with typical effective temperatures ranging from log Teff = 3.7 to log Teff = 3.8 (see e.g. Sandage et al. 2004). Estimated values of the width of the instability strip do not exceed 1000 Kelvins1. Depending on the mass, the star can cross the instability region up to three times. The first crossing occurs in the post-main sequence evolution, before helium ignites, while the star evolves very quickly towards the red giant branch. After the helium ignition, more massive stars enter the horizontal blue loop, crossing the instability strip twice, first during the blue-ward and then the red-ward evolution. The corresponding second and third crossings last roughly two orders of magnitude longer than the first crossing. Hence, most of the observed Cepheids are expected to be helium-burning objects.
Most of the Cepheids are single-periodic variables pulsating either in the fundamental mode or in the first overtone mode. Only a few examples of second overtone Cepheids are known. In many Cepheids simultaneous pulsations in two modes are observed. Double-periodic Cepheids (or beat Cepheids) are very interesting and important astrophysical objects. Most of these variables pulsate simultaneously in two consecutive radial pulsation modes, either in the fundamental and in the first overtone (F+1O) or in the two lowest order overtone modes (1O+2O, double-overtone Cepheids in the following). The two pulsation periods can be used to constrain the stellar parameters; in particular, the mass can be derived using the Petersen diagram (Petersen 1973). The disagreement between these pulsation masses of F+1O beat Cepheids and the masses derived from evolutionary computations was one of the factors that motivated the revision of opacity tables (Simon 1982). Multi-mode Cepheids still provide useful and stringent tests for stellar evolution and pulsation theories (see e.g. Moskalik & Dziembowski 2005; Dziembowski & Smolec 2009).
Despite the great importance of the beat Cepheids and the apparent simplicity of their oscillation, the phenomenon of double-periodic pulsation is not well understood. Many efforts were made over the past forty years to study the interaction of pulsation modes and the origin of the double-periodic pulsation. These include theoretical studies as well as numerical modelling.
The necessary condition for the double-periodic pulsation to occur is simultaneous linear instability of the respective two modes. This condition is not sufficient because mode selection is a non-linear phenomenon. The interaction between pulsation modes may be either of a non-resonant or of a resonant character. In most of the observed Cepheids both mechanisms lead to stable single-periodic pulsation. In the non-resonant case, it is also a single-mode pulsation. The distinction between multi-periodic and multi-mode pulsation is important. In the resonant case the single-periodic pulsation is actually multi-mode, because the resonantly coupled mode is also excited to high amplitude. Owing to the non-linear frequency synchronisation, it does not appear with a separate frequency, but its presence is manifested in the distortion of light and radial velocity curves. Bump Cepheids, which are single-periodic, double-mode pulsators, provide an excellent example. In this paper we deal with double-periodic pulsators and will use the term double-mode below only for stars and models for which the resonant mechanism is excluded.
Double-periodic Cepheids are rare compared to single-periodic Cepheids, and the identification of the conditions that lead to stable double-periodic pulsation was and still is of key importance. Simon (1979) suggested that the double-periodic pulsation may be a resonant phenomenon, connected with the three-mode resonance, ω1 + ω0 = ω3. Using the amplitude equation formalism Dziembowski & Kovács (1984) showed that the resonance proposed by Simon actually stabilizes the single-periodic pulsation. They also pointed out that the 2:1 resonance between the linearly excited mode and the linearly damped, parasite mode can lead to double-periodic pulsation. This was later confirmed with radiative RR Lyrae and Cepheid models (Kovács & Buchler 1988; Buchler et al. 1990; Smolec 2009a). The models agreed not once with the observations, though. Indeed, a comparison of the observed periods and the period ratios of beat Cepheids with the results of linear modelling indicate that in most of the double-periodic Cepheids resonances of a low order are excluded, and therefore the non-resonant mechanism should be operational. For many years radiative models failed to reproduce the non-resonant double-mode pulsation in both RR Lyrae stars and in Cepheids. It was the inclusion of turbulent convection into the hydrocodes that led to success. Kolláth et al. (1998) published the double-mode Cepheid models and Feuchtinger (1998) published a double-mode RR Lyrae model. Later, only the Florida-Budapest group computed the surveys of double-mode pulsation (Kolláth et al. 2002; Szabó et al. 2004; Buchler 2009). The reliability of these models was recently questioned however by the analysis of Smolec & Moskalik (2008a; 2008b) (see also Sect. 2.2). We have shown that the computed double-mode pulsation arises from the neglect of negative buoyancy in the Florida-Budapest hydrocode, which is physically not justified. Yet we could not find any non-resonant F+10 Cepheid models even with our pulsation hydrocode (Smolec & Moskalik 2008a, Sect. 2.1), which properly included the negative buoyancy (Smolec & Moskalik 2008b).
In the present paper we discuss some resonant F+1O Cepheid models that we computed (Sect. 3). Although these models are restricted to a very narrow parameter range, they agree sufficiently well with the observations. Finally we present a survey of models which we conducted in search for stable double-overtone (1O+2O) Cepheid pulsation (Sect. 4). This survey is complementary to our earlier work, in which we searched for non-resonant F+1O Cepheid models (Smolec & Moskalik 2008b), and allows us to draw more definite conclusions about the ability of current convection models to reproduce the beat Cepheid pulsation (Sect. 5). Preliminary results of this work were presented in Smolec & Moskalik (2009).
2. Turbulent convection model and numerical methods
2.1. Turbulent convection model and pulsation hydrocodes
In all our computations we use the pulsation codes described by Smolec & Moskalik (2008a). These are a static model builder, linear non-adiabatic code and a direct time-integration non-linear hydrocode. The codes use a simple Lagrangian mesh. For the convective energy transfer we use the time-dependent Kuhfuß (1986) convection model reformulated for the use in stellar pulsation codes (see also Wuchterl & Feuchtinger 1998). Radiation is described in the diffusion approximation. Below we provide a short summary of the model. For extensive description and details of numerical implementation we refer the reader to Smolec & Moskalik (2008a).
The momentum, internal energy, and turbulent energy equations are 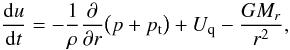 (1)
(1)![Mathematical equation: \begin{equation} \frac{{\rm d}E}{{\rm d}t}+p\frac{{\rm d}V}{{\rm d}t}=-\frac{1}{\rho}\frac{\partial\big[r^2\big(F_{\rm r}+F_{\rm c}\big)\big]}{r^2\partial r}-C,\label{energy} \end{equation}](/articles/aa/full_html/2010/16/aa14494-10/aa14494-10-eq7.png) (2)
(2)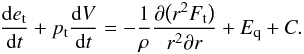 (3)Above, u is the fluid velocity, which is a time derivative of the radius u = dr/dt. Mr is the mass enclosed in the radius r, V is the specific volume which is the inverse of the specific density, V = 1/ρ. p and E are the pressure and energy of the gas. Fr, Fc and Ft are the radiative, convective, and turbulent fluxes, respectively. The radiative flux is computed assuming diffusion approximation. Radiation pressure and radiation energy are included in p and E. The turbulent energy, et, is computed according to the one-equation model of Kuhfuß (Eq. (3)). Turbulent energy equation and internal energy equation are coupled through the term C of the form
 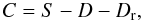 (4)where,
 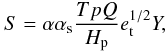 (5)
(5) (6)
(6) (7)Above, T is the temperature, σ is the Stefan-Boltzmann constant, Q = (∂V/∂T)p, Hp is the pressure scale height, cp is the specific heat at a constant pressure and κ is the opacity. The source (or driving) function, S, describes the rate of turbulent energy generation/damping through the buoyant forces. The source function is proportional to the superadiabatic gradient (dimensionless entropy gradient), Y,
  (8)and therefore drives the turbulent energies in convectively unstable regions (S > 0), and brakes the turbulent motions in convectively stable regions (S < 0). Term D models the decay of turbulent energy through the turbulent cascade. Dr describes the rate at which the turbulent energy is transformed into the internal energy through the radiative cooling of the eddies (see Wuchterl & Feuchtinger 1998). For the turbulent fluxes we have
  (9)
(9) (10)
(10) (11)
(11)![Mathematical equation: \begin{equation} U_{\rm q}=\frac{1}{\rho r^3}\frac{\partial}{\partial r}\bigg[\frac{4}{3}\alpha\alpha_{\rm m}\rho H_{\rm p} e_{\rm t}^{1/2}r^3\bigg(\frac{\partial u}{\partial r}-\frac{u}{r}\bigg)\bigg], \end{equation}](/articles/aa/full_html/2010/16/aa14494-10/aa14494-10-eq42.png) (12)
(12) (13)Above, pt is the turbulent pressure and Uq and Eq are the viscous momentum and energy transfer rates. We note that the turbulent viscosity always contributes to the driving of the turbulent energy, at the cost of pulsation.
The model equations contain 8 orders of unity scaling parameters, mixing-length, α and parameters multiplying the turbulent fluxes and driving/damping terms, αp, αm, αc, αt, αs, αd and γr. The theory provides no guidance for their values, but some standard values are in use. These values result from a comparison of the static, time-independent version of the model with the standard mixing-length theory (see Wuchterl & Feuchtinger 1998; Smolec & Moskalik 2008a). In practice, the values of the parameters should be determined in a way that the models satisfy as many observational constraints as possible. In principle, direct numerical simulations of convective zones can be used to calibrate the convective parameters, but currently no such simulations are available for large amplitude giant pulsators. The values of the parameters used in the present paper are given in Table 1. We note that set R3 is equivalent to set B of Baranowski et al. (2009) and was adopted by these authors in successful modelling of the overall properties of the radial velocity curves of first overtone Galactic Cepheids.
2.2. Importance of negative buoyancy
In this section we look in detail at the important difference between the convection model adopted in our code and the convection model adopted in the Florida-Budapest hydrocode (e.g. Kolláth et al. 2002). The latter code was used to compute all the convective double-mode Cepheid models published so far. As analysed by Smolec & Moskalik (2008b), these double-mode models are physically incorrect, because they result from the exclusion of the buoyant forces in convectively stable regions. In the Florida-Budapest hydrocode it is set  (14)for the turbulent source function, and
  (15)for the convective heat flux, to be compared with S ∝ Y and Fc ∝ Y in our code (Eqs. (5) and (9)). To exclude the buoyant forces in convectively stable regions, a consequence of Eq. (14) in the Florida-Budapest model, is incorrect and cannot be justified. In convectively unstable layers (Y > 0) the buoyant force is responsible for the acceleration of turbulent eddies. In convectively stable regions (Y < 0), the buoyant force does not disappear. It decelerates the turbulent eddies, restoring the convective stability. Thus, we stress that the treatment of the source function in the convectively stable regions, S ∝ Y in our code and S ∝ Y + in the Florida-Budapest code, is not arbitrary. Even more importantly, the use of two different equations for the source function (Eq. (5) or (14)) leads to significant differences in the computed models. Particularly, the modal selection is very different. As Smolec & Moskalik (2008b) showed, when negative buoyancy is neglected (Eq. (14)) the non-resonant F+1O double-mode models can be easily computed. But the mechanism responsible for the double-mode pulsation is artificial. Because the negative buoyancy is excluded, the turbulent eddies cannot be braked effectively below the envelope convection zone. Consequently, a large region extending over several pressure scale heights below the convection zone with relatively high turbulent energies is present in these models. In this region eddy-viscous damping strongly limits the amplitude of the fundamental mode; much stronger than it limits the amplitude of the first overtone. With its reduced amplitude, the fundamental mode is no longer able to saturate the pulsation instability alone, which allows the growth of the first overtone and leads to stable double-mode pulsation. For more details the reader is referred to Smolec & Moskalik (2008b) and Smolec (2009b).
Our extensive survey (Smolec & Moskalik 2008b) in search for stable F+1O double-mode pulsation in the physically correct models, i.e. with negative buoyancy included, yielded no result. We could not find a non-resonant double-mode model. However, we have found some interesting F+1O resonant double-periodic models, which we describe in Sect. 3. We also performed the model survey intended to reproduce the observed double-overtone Cepheids in the LMC. Our results, also including double-overtone models, are described in Sect. 4.
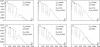 |
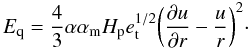
Fig. 1 Fractional radius amplitude for the first overtone (A1) and for the fundamental mode (A0) for six consecutive Cepheid models of set R2. The models were initialized with a range of amplitude ratios (bottom left parts of the diagrams) and for each initialization the time evolution (marked with arrow) was followed. The model properties are given in each panel. The proximity to the resonance centre is characterised by Δ = 2ω1/(ω0 + ω2). Solid and open squares mark the location of stable and unstable fixed points computed through fitting the hydrodynamical trajectories with non-resonant amplitude equations. In panels three to five some trajectories evolve to a double-periodic attractor with finite amplitude in both the fundamental and first overtone modes. The remaining (rightmost) trajectories calculated for these three models evolve towards a single-periodic finite amplitude fundamental mode pulsation. |
2.3. Mode selection analysis
To search for stable double-periodic pulsation we adopt the methods developed by the Florida-Budapest group (e.g. Kolláth et al. 2002). They are based on the analysis of results of direct hydrodynamical model integration with an amplitude equation formalism (e.g. Buchler & Goupil 1984). Here we provide a brief summary of the method. For details of our implementation the reader is referred to Smolec & Moskalik (2008b).
Three sets of convective parameters considered in this paper.
The static model is initialized (or “kicked”) with a scaled mixture of linear velocity eigenvectors of the studied modes. Then, a time-evolution of mode amplitudes follows using the analytical signal method (see e.g. Kolláth et al. 2002). The model integration is stopped when full amplitude single-periodic pulsation (limit cycle) is reached, or when the time evolution becomes prohibitively slow, which may indicate the approach to the attractor. The resulting trajectory is plotted in the amplitude-amplitude diagram, similar to those shown in Fig. 1. In this figure we plot on the vertical axis the fractional radius amplitude, δR/R, of the first overtone, and on the horizontal axis we plot the fractional radius amplitude of the fundamental mode. Each trajectory is represented by a single, continuous line starting in the bottom left part of the diagram, with the direction of the evolution marked by an arrow. For each model the non-linear integration is repeated with several different initial conditions (range of amplitude ratios), chosen to adequately explore the whole amplitude-amplitude phase-space. The dimension of the phase-space can be large, depending on the number of linearly excited modes and possible resonances. Linearly damped modes that can be present in the initial phases of the model integration (due to imperfect initialization) decay exponentially and are of no interest, unless they are in resonance with other linearly excited modes. In the latter case, their amplitude can grow significantly.
Provided that the amplitude-amplitude phase-space is sufficiently covered (several trajectories, sufficiently long integrations), the mode selection can be deduced beyond doubt from the analysis of the appropriate 2D amplitude-amplitude diagrams similar to those shown in Figs. 1 and 6 (which are the sections through the whole phase-space). For example, the trajectories presented in first panel of Fig. 1 (Teff = 5850K) evolve either towards fundamental mode single-periodic pulsation (a fundamental mode limit cycle; two rightmost trajectories) or towards first overtone single-periodic pulsation (six leftmost trajectories, one of them overlaps with the vertical axis). In four consecutive panels of Fig. 1, the double-periodic attractor is clearly visible. It is also evident that for these models the fundamental mode limit cycle is stable, while the first overtone pulsation is unstable. For the last model presented in Fig. 1 (Teff = 5800K), all trajectories evolve towards fundamental mode, which is the only stable pulsation state. More robust conclusions can be drawn however if the hydrodynamic trajectories are analysed with appropriate amplitude equations.
Amplitude equations can be used to compute the time-evolution of the mode amplitudes and phases. In particular, the mode selection for a given model can be established through computing the time-independent solutions of the amplitude equations (fixed points) and their stability. Stable fixed points are the attractors of the system and the trajectories evolve toward them. Unstable fixed points repel the trajectories. Fixed points correspond to steady non-linear pulsations. Stable, single-mode fixed points correspond to stable limit cycle pulsations.
In order to compute the fixed points and their stability, the linear growth rates as well as non-linear self- and cross-saturation coefficients of the modes have to be known. In a resonant case it is also necessary to know the coupling coefficients of the interacting modes. These coefficients can be computed from the linear eigenvectors and model structure, but this is too difficult, unless strongly simplifying assumptions are made. In practice, saturation and coupling coefficients can be derived through fitting the appropriate amplitude equations to non-linear trajectories computed with the hydrocode. The numerical procedure is straightforward in a non-resonant case. The amplitude equations, which are complex in general, decouple into a real part that yields the equations for the amplitudes of the modes, and an imaginary part that yields the equations for their phases. The equations for the amplitudes are used to derive the saturation coefficients through a simple linear fit, while the equations for the phases are not relevant in the non-resonant case.
In a resonant case, the situation is much more complicated. Full complex amplitude equations have to be considered. The number of unknown coefficients grows significantly, and a simple linear fit is no longer possible. Therefore, the mode selection analysis, as described above, is hard to conduct (see Smolec 2009b). Below the modal selection for models in proximity of the resonances is derived based on the analysis of hydrodynamic trajectories only. As mentioned above and presented in the forthcoming sections, the computation of several trajectories and sufficiently long integrations allows us to deduct the modal selection beyond doubt also in the resonant case.
3. Resonant beat F+1O Galactic Cepheid models
There are only a few double-periodic Cepheids known in our Galaxy. The high extinction in the direction of the Galactic disc, where we expect to find these young objects, significantly limits our detection ability. Including very recent discoveries in all-sky surveys data, such as ASAS (Pojmanski 2002), there are 23 known F+1O double-periodic Cepheids (Antipin 1997; 1998; 2006; Berdnikov & Turner 1998; Khruslov 2009a; Pardo & Poretti 1997; Wils et al. 2010; Wils & Otero 2004). Only 15 1O+2O Cepheids were detected so far (Beltrame & Poretti 2002; Hajdu et al. 2009; Khruslov 2009b; 2009c; 2010; Pardo & Poretti 1997; Szczygiel 2009), of which only two objects were known before 2009. In many cases the reddenings are unknown, making the derivation of physical parameters of these objects very uncertain. Here we focus on F+1O Cepheids. Observed period ratios, P1/P0, are confined between 0.697 and 0.713 for most of the objects. The typical periods of the fundamental mode are between two and six days (see Moskalik & Kołaczkowski 2009). The period ratio decreases with increasing period of the fundamental mode.
The double-periodic F+1O models presented in this section were found accidentally during the model survey intended to reproduce the Hertzsprung bump progression (Smolec 2009b). A detailed linear analysis revealed that the computed double-periodic behaviour can be connected to the high-order parametric resonance, 2ω1 = ω0 + ω2. The same resonance was found to be responsible for the double-periodic behaviour computed in radiative β Cephei models by Smolec & Moskalik (2007). β Cephei stars are multi-periodic, mostly non-radial pulsators, and two radial modes excited alone were so far not observed in any star of this class. Consequently, the double-periodic β Cephei models of Smolec & Moskalik (2007) are of theoretical interest only. Yet they demonstrate that the three-mode, high-order resonance can be conducive to producing stable multi-mode pulsation. The convective δ Cephei models described below confirm this finding and agree moreover fairly well with the observations.
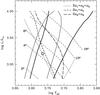 |
Fig. 2 Location of the 2ω1 = ω0 + ω2 resonance centre (dotted line) and the computed resonant multi-mode F+1O Cepheid models (within the circle) in the HR diagram. The loci of other resonance centres are also shown. The thick and thin solid lines enclose the fundamental and first overtone instability strips. The dashed lines are the lines of the constant period (F-mode) indicated in the figure. Computations were done for set R2 of Table 1. |
Static models were constructed using 150 mass zones, extending down to 2.5 × 10⁶K, with a fixed temperature (Ta = 11000K) in the anchor zone located 50 zones below the surface. As discussed in Smolec & Moskalik (2008a), Ta = 15000K was used for model sequences in which effects of turbulent pressure were turned on (αp ≠ 0). The convective parameters of the model sequences that are discussed in this section, R1, R2 and R3, are collected in Table 1.
The computed models are characterised by Galactic chemical composition, X = 0.7, Z = 0.02. OPAL opacities were used (Iglesias & Rogers 1996) and were supplemented at the low temperatures with the Alexander & Ferguson (1994) opacity data. Opacities were generated for the solar mixture of Grevesse & Noels (1993). Models were computed along a sequence of constant mass and constant luminosity, and varying effective temperature. Masses of the models are 4.5M⊙ for models adopting convective parameters of set R1, 4.75M⊙ for models adopting convective parameters of set R2, and 5.0M⊙ for models adopting convective parameters of set R3. Luminosities of the models were derived using the mass-luminosity relation resulting from the Schaller et al. (1992) evolutionary computations, log (L/L⊙) = 3.56log (M/M⊙) + 0.79.
The multi-mode solution was first found for one model of set R1. Detailed linear analysis revealed that the 2ω1 = ω0 + ω2 resonance can be involved in the pulsations, because the model was located very close to the resonance centre. The proximity parameter, which we define for the resonance under discussion as  (16)was equal to Δ = 1.0006. This finding motivated the search for double-periodic F+1O Cepheid pulsation connected with the discussed three-mode resonance. Multi-mode models were found also for sets R2 and R3 of Table 1. The widest domain of double-periodic solutions exists for parameter set R2. In Fig. 1 we present the results of hydrodynamical model integrations for six consecutive models of this set. In Fig. 2, the loci of the 2ω1 = ω0 + ω2 resonance in the HR diagram are plotted. Double-periodic models are located within the circle, at log (L/L⊙) ≈ 3.2. In Fig. 2 we also plot the lines representing the loci of other resonances, which are important for Cepheid pulsation, 2ω0 = ω2 and 2ω1 = ω4.
Properties of the computed double-periodic F+1O convective Cepheid models (mass, effective temperature, proximity parameter, fundamental mode period and P1/P0 period ratio).
The mode selection scenario is evident from the hydrodynamical trajectories alone and is the same for all three parameter sets under discussion (see Fig. 1). The double-periodic attractor always coexists with the stable fundamental mode attractor. The hysteresis domain (in which the mode selection depends on initial conditions) is always very narrow. Close to the resonance centre the consecutive models were computed in 5K steps in the effective temperature. For sets R1 and R3 the double-periodic solution was found in only one model (see Table 2 for its properties), indicating that the interesting domain is narrower than 10K. Only for models adopting convective parameters of set R2 the double-periodic domain is wider, and extends for more than 40K. For all three model sequences, this domain is located between the F/1O either-or domain (hotter models) and a fundamental-mode-only pulsation domain (cooler models). Therefore, from an astrophysical point of view, a double-periodic solution can be reached only during red-ward evolution by models previously pulsating in the first overtone. During the blue-ward evolution, models pulsate in the fundamental mode, which remains stable. Double-periodic pulsation is not possible.
The properties of the computed double-periodic models, their periods and period ratios are collected in Table 2 (sets R1 and R3) and Fig. 1 (set R2). The models occupy a narrow period range. Compared to the observations (see Petersen diagram in e.g. Moskalik & Kołaczkowski 2009), the period ratios are slightly too low. This can be easily compensated by the decrease of model’s metallicity. However, the main drawback of most of the computed models is their excessive amplitude. Only for models of set R3 do the amplitudes of the single-mode pulsation agree with the observations. What is more important, the overall properties of the fundamental mode and first overtone Cepheids are reproduced reasonably well with the convective parameters of set R3 (see Smolec 2009b; Baranowski et al. 2009, respectively). For the models of sets R1 and R2, the amplitudes of the single-mode solutions along the computed model sequences are always higher than observed. Particularly the amplitude of the fundamental mode is too high by up to 30 per cent. We will return to the problem of excessive amplitudes later in this section.
At first glance, the non-resonant mechanism seems to be the most likely cause of the double-periodic pulsation. Double-periodic solutions are always located between the fundamental only and F/1O either-or domains, which is natural for the non-resonant mechanism. For the typical resonant excitation, the double-periodic domain usually emerges in the middle of the single-mode pulsation domain – fundamental mode domain, as for the 2:1 resonance discussed by Smolec (2009a), or first overtone domain, as for the three-mode resonance acting in β Cephei models (Smolec & Moskalik 2007). This is because of the resonant destabilisation of one of the limit cycles. Also, the non-resonant amplitude equations seem to capture our hydrodynamical results very well. The solid and open squares in Fig. 1 correspond to stable and unstable fixed points, computed as described in Sect. 2.3, through fitting the non-resonant amplitude equations to the hydrodynamical trajectories. Except for one model with Teff = 5840K, the location and stability of the fixed points is consistent with the properties of the computed trajectories.
Nevertheless, other arguments point towards a resonant explanation of the computed double-periodic models. First, all the computed double-periodic models are very close to the resonance centre. The proximity parameter, Δ (Eq. (16)), is given in Table 2 for the two relevant models of sets R1 and R3 and in Fig. 1 for the models of set R2. This is not likely to happen by accident, particularly for the three model sequences of the different convective parameters and the masses and luminosities. Second, our extensive model survey (Smolec & Moskalik 2008b) has not revealed any double-periodic solutions; particularly, no such solutions have been found close to the transition line between fundamental mode pulsation domain and the F/1O either-or domain. We verified that in all models the 2ω1 = ω0 + ω2 resonance was far from the transition line. Also, the double-periodic models were not found close to the resonance centre if the transition line was distant from the resonance centre. For example, models adopting the convective parameters of set R3 and slightly lower masses (4.75M⊙ instead of 5.0M⊙) all pulsate in the fundamental mode when they are computed close to the resonance centre. This indicates that a special condition is required to generate the stable double-periodic pulsation – a proximity of the models to the resonance centre and a proximity to the discussed transition line. Consequently, the double-periodic domain is always restricted to a very narrow region in the HR diagram, both in effective temperature and in luminosity. At the moment we cannot provide any explanation why these two conditions have to be satisfied simultaneously.
The existence and properties of the double-periodic pulsation depend on the values of convective parameters that enter the model computations. We computed several sequences of models with other convective parameters than R1–R3. In order to decrease the model amplitudes, which are too high for sets R1 and R2, we computed some models with an increased eddy-viscous dissipation. In particular, we computed a model sequence adopting the convective parameters of set R1, except for the eddy-viscosity parameter, αm, which was set to a slightly higher value (αm = 0.35, instead of αm = 0.30). Unfortunately, the double-periodic solution simply disappeared. However, we note that it is hard to analyse how the existence and properties of possible double-periodic models depend on their convective and physical parameters. As noted above, the double-periodic models are located close to the resonance centre and close to the transition line between the F and F/1O pulsation domains. The change in e.g. convective parameters while keeping the physical parameters of the model fixed changes the relative location of these lines. Consequently, the lack of the double-periodic solutions in models computed close to the resonance centre may be caused not by the “bad” convective parameters, but because we are investigating a wrong part of the HR diagram. To check whether the inclusion of radiative losses is crucial for the existence of double-periodic solutions (we used γr ≠ 0 in all three sets with double-periodic solutions), we computed two additional model sequences, where all parameters were left exactly the same as for sets R1 and R2, except for the radiative losses, which were turned off (γr = 0). No double-periodic models were found close to the resonance centre, but the transition line between the F and F/1O pulsation domains also shifted towards higher temperatures. Therefore, we cannot say whether the inclusion of radiative losses is necessary or not. These definite claims require a much more extensive model survey. Such a survey was not conducted because the double-periodic resonant solutions we found can model only a very small subgroup of the observed double-periodic F+1O Cepheids and offers no general solution to the reopened problem of modelling the beat Cepheid pulsation.
Nevertheless, the presented double-periodic models are promising, because they are computed with a convective hydrocode that includes negative buoyancy effects, and despite the described difficulties, their parameters agree fairly well with the observations.
4. LMC double-overtone Cepheid model survey
In contrast to our Galaxy, many more double-periodic Cepheids are known in the Large Magellanic Cloud. Thanks to observational projects aimed at detecting gravitational lensing events, such as MACHO (e.g. Alcock et al. 1995) or OGLE (e.g. Udalski et al. 2008), a precise and extended photometry of many fields covering significant part of the LMC is available. The detected samples of Cepheids are large and homogeneous. Here we focus on data from the third phase of the OGLE project (Soszyński et al. 2008).
Double-overtone Cepheids are the most frequent class of multi-periodic Cepheids in the LMC. Two hundred and six such variables were found in OGLE-III data (Soszyński et al. 2008) compared with only 61 F+1O double-periodic Cepheids. There are many more single-periodic first overtone Cepheids (1238), but in a period range 0.5d < P1 < 0.9d, double-overtone Cepheids are the most common type of pulsators among the LMC Cepheids. Surprisingly, only 14 variables are confirmed as single-periodic second overtone pulsators. Hence, the second overtone is excited predominantly together with the first overtone.
The Petersen diagram for the LMC double-overtone Cepheids is plotted in Fig. 3. The double-overtone Cepheids seem to fall into two overlapping groups in this diagram. The first, less numerous group extends from the shortest periods up to periods slightly longer than P1 ≈ 0.6 days (log P1 ≈ −0.2). Within this group, one can observe a weak increasing trend in the P2/P1 period ratio. Members of the second, more numerous group that extends for longer periods (P1 > 0.6days) form a well defined sequence with a decreasing period ratio.
The evolutionary state of these objects is a matter of controversy. An analysis of the Petersen and period-luminosity diagrams (Dziembowski & Smolec 2009) shows that short period objects are in the post-main sequence evolutionary phase, crossing the instability strip for the first time. However, objects with a longer period represent a challenge for the stellar evolution theory, because the inferred masses are too small for entering the instability strip during the core-helium burning, and the luminosities are much higher than in the post-main sequence phase (see Dziembowski & Smolec 2009, and discussion in Sect. 4.2).
A systematic survey in search for stable double-overtone Cepheid pulsation was not published up to date. Some 1O+2O models were computed with the Florida-Budapest hydrocode (see Buchler 2009), but details of these models were not published. Also, the exclusion of the negative buoyancy in the Florida-Budapest code (Sect. 2.2) may influence the computed double-overtone behaviour, just as for the F+1O double-mode Cepheid models (Smolec & Moskalik 2008b). Therefore, it is very important to check whether the double-overtone models can be computed with the hydrocode, which includes negative buoyancy effects. This survey is complementary to our (unsuccessful) search for F+1O double-periodic Cepheids (Smolec & Moskalik 2008b), and allows for more definite statements about the ability to model the beat Cepheid pulsation with current convection models. The release of OGLE-III data, which contain a significant number of double-overtone Cepheids (Soszyński et al. 2008) provided additional motivation, and focused our attention on modelling the LMC pulsators.
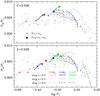 |
Fig. 3 Domains of simultaneous linear instability of first and second overtones in the Petersen diagram. Black dots represent the observed LMC double-overtone Cepheids. Line segments are models with normal and artificially increased luminosity, as described in the bottom panel. Asterisks and pentagons mark resonances between low order modes. Resonances might be helping to produce double-overtone behaviour only for the shorter-period Cepheids, but not for the more numerous longer-period ones. |
4.1. Construction of models
The modelling of double-overtone pulsation and, more generally, pulsation involving higher order overtones, is not an easy task. The higher the order of the pulsation mode, the deeper into the envelope it penetrates. Hence, to obtain reliable periods and period ratios, model envelopes should be deep and computed with higher resolution in the internal layers compared to fundamental mode Cepheid models. On the other hand, double-overtone Cepheids are low mass objects, characterised by small growth rates. This makes non-linear computations extremely time-consuming and therefore a relatively coarse mesh is necessary to conduct an extended non-linear model survey. In order to get reliable periods and period ratios with a relatively coarse mesh, the model structure, zoning, and depth of the envelope in our code were chosen to reproduce the results obtained with the LNA code of Dziembowski (1977) as closely as possible. Dziembowski’s code, which is coupled with the Warsaw-New Jersey stellar evolution code (see e.g. Pamyatnykh 1999), allows the computation of deep, evolutionary models with high spatial resolution, providing accurate periods and period ratios that can be used in asteroseismic modelling (e.g. Moskalik & Dziembowski 2005). However, the code adopts frozen-in MLT convection, which is much simpler than the time-dependent treatment used in our code. Therefore, a comparison of the model periods and period ratios computed with both codes was conducted either for purely radiative models, or with convection in the frozen-in approximation in both of the codes. We note that with appropriate convective parameters, the Kuhfuß model used in our envelope code can be reduced to a standard MLT (Wuchterl & Feuchtinger 1998). The resulting mesh structure for our envelope models is the following: the models consist of 200 mass zones, of which 50 outer zones have an equal mass down to the anchor zone, in which the temperature is set to Ta = 11000K. The envelope extends down to temperatures of 8 × 10⁶K.
In the final linear and non-linear model computations only one set of convective parameters was used namely set R3 of Table 1. The non-linear computation of double-overtone pulsation is extremely time-consuming and prohibits a more detailed parameter study. Therefore, the convective parameters should be carefully chosen, and we believe that set R3 represents a good choice. We note that with the convective parameters of set R3, we were able to successfully model the overall properties of the radial velocity curves of the first overtone Cepheids (Baranowski et al. 2009). With these convective parameters, the models of the radial velocity curves of the fundamental mode Cepheids also agree with the observations (Smolec 2009b). It is also important that set R3 includes the effects of radiative cooling of the convective elements (γr ≠ 0). The inclusion of this effect was necessary to reproduce the long periods of some of the first overtone pulsators (Baranowski et al. 2009). It was also claimed that the inclusion of radiative cooling was necessary to obtain the 1O+2O non-linear double-mode models with the Florida-Budapest code (Buchler & Kolláth 2000). Finally, we would like to point out that the models to be discussed are hot and convection is not expected to be very strong. Therefore, the results should not be very sensitive to the exact values of the convective parameters.
4.2. Linear modelling
The results of the linear model survey presented in this section, particularly the implications for stellar evolution theory, were published by Dziembowski & Smolec (2009, DS09 in the following). In the present paper, the linear models provide a background for non-linear pulsation modelling, and are briefly summarised below.
The pulsation models were constructed along evolutionary tracks computed with the Warsaw-New Jersey stellar evolutionary code, which allows us to compute evolutionary phases before core helium ignition. The computations were conducted for two values of metallicity that are appropriate for the LMC, namely Z = 0.006 and Z = 0.008. For the hydrogen abundance, X = 0.72 was adopted. The OP opacities (Seaton 2005) and Asplund et al. (2004) solar mixture were used in the opacity computations. Rotation and overshooting from the convective core were neglected. The mixing length parameter in the evolutionary code was set to αMLT = 1.5.
In addition to pulsation models computed along evolutionary track (Δlog L = 0.0 in the following), we have computed the models with artificially increased luminosity. We imposed higher L values (Δlog L = 0.2 or Δlog L = 0.4) at the bottom boundary of our models, keeping their mass fixed. The computed models cover the whole instability strip. This luminosity increase was intended to model either (overlarge) overshooting during the main sequence evolution or the core helium burning phase (second and third crossings of the instability strip).
The domains of the simultaneous linear instability of the first and second overtone modes are plotted in the Petersen diagrams presented in Fig. 3 (upper panel for Z = 0.006 and lower panel for Z = 0.008). The corresponding period-luminosity (PL) diagrams were published in DS09. The linear models well reproduce the observed Petersen and PL diagrams. The inferred masses of the double-overtone Cepheids are 3.0 ± 0.5M⊙. However, in order to reproduce the objects of longer periods (P1 > 0.6days), which represent the majority of the sample, a significant luminosity increase compared to the post-main sequence evolutionary phase is required, indicating that these objects are in the core helium burning phase. As noted by DS09, this represents a challenge for the stellar evolution theory. According to current evolutionary calculations, the minimum mass of the star to enter the instability strip in its core helium burning phase is higher than 4.0M⊙ (see references in DS09). For a discussion of this point we refer the reader to DS09.
Our detailed linear analysis revealed that two types of resonances can be conducive to producing stable double-overtone pulsation. These are 2:1 resonance between the first overtone and linearly damped fifth overtone, 2ω1 = ω5, and high-order resonance, involving the three lowest order overtones, 2ω2 = ω1 + ω3. The loci of resonance centres within the 1O+2O instability domains (and slightly beyond) are shown with asterisks (2ω1 = ω5) and pentagons (2ω2 = ω1 + ω3) in Fig. 3. The first resonance, 2ω1 = ω5, was suggested by Dziembowski (see Soszyński et al. 2008, DS09) as a possible factor shaping the structures visible in Fourier decomposition parameters of the shortest period first overtone Cepheids. It is also well known that 2:1 resonances can be conducive to producing stable multi-mode pulsation, as shown theoretically by e.g. Dziembowski & Kovács (1984). Examples of double-periodic hydrodynamical radiative models of both RR Lyrae and Cepheids in the proximity of a 2:1 resonance are also known (Kovács & Buchler 1988, Buchler et al. 1990; Smolec 2009a). The latter resonance, 2ω2 = ω1 + ω3, is of the same type as the resonance operating in the F+1O double-periodic Cepheid models described in Sect. 3. We note that these resonances can be operational only in objects of periods shorter than P1 < 0.7days. At longer periods, the non-resonant mechanism should be responsible for the observed double-overtone pulsation.
4.3. Non-linear modelling
An extensive non-linear model survey was conducted for models with metallicities Z = 0.006 and Z = 0.008. Model sequences were computed along selected sequences described in the previous section chosen to cover the significant part of the Petersen diagram.
For metallicity Z = 0.006, six non-linear model sequences were computed. Three sequences are located within the instability domains along evolutionary tracks (Δlog L = 0.0) for stars of masses 2.5M⊙, 3.0M⊙ and 3.5M⊙ (solid lines in Fig. 3). The other three are located along horizontal paths with artificially increased luminosity (2.5M⊙, Δlog L = 0.4; 3.0M⊙, Δlog L = 0.4; 3.5M⊙, Δlog L = 0.2). The location of all the computed models is shown in Fig. 4.
Five non-linear model sequences were computed for a higher metallicity, Z = 0.008. Three sequences correspond to first crossing evolutionary models of masses, 2.5M⊙, 3.0M⊙ and 3.5M⊙. The remaining two sequences correspond to horizontal paths with an artificially increased luminosity (3.0M⊙, Δlog L = 0.4 and 3.5M⊙, Δlog L = 0.4). The location of the computed models is shown in Fig. 5.
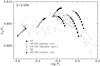 |
Fig. 4 Petersen diagram showing the location and stability information for the computed non-linear convective models. The models were chosen to cover the significant part of the Petersen diagram. These are models of 2.5M⊙, 3.0M⊙ and 3.5M⊙ located along evolutionary tracks (Δlog L = 0.0) and models with artificially increased luminosity of masses 3.5M⊙ (Δlog L = 0.2), and 2.5M⊙ and 3.0M⊙ (Δlog L = 0.4). All computations are for the metallicity parameter Z = 0.006. Black dots represent the observed LMC double-overtone Cepheids. The only double-periodic models are found near the 2ω1 = ω5 resonance centre, which is marked with an arrow. |
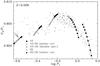 |
Fig. 5 Same as Fig. 4, but for metallicity parameter Z = 0.008. The chosen models cover the significant part of the instability strip. These are models of 2.5M⊙, 3.0M⊙ and 3.5M⊙ located along evolutionary tracks (Δlog L = 0.0) and models with an artificially increased luminosity of masses 2.5M⊙ and 3.0M⊙ (Δlog L = 0.4). The only double-periodic models are found near the 2ω1 = ω5 resonance centre, which is marked with an arrow. |
For each model in a sequence five hydrodynamical integrations were conducted, each initialized with a different mixture of the first and second overtone’s velocity eigenvectors. For most of the models the integrations were carried over 8000 pulsation cycles. For the least massive models located along the evolutionary track (2.5M⊙, Δlog L = 0.0), integrations were twice as long, because the growth rates are very low for these models. Some individual trajectories for models located along the evolutionary track with 2.5M⊙ (Z = 0.006) are presented in Fig. 6.
The modal selection information for the computed models is presented with different symbols in Figs. 4 and 5. It was derived through the analysis of the computed trajectories (presented e.g. in Fig. 6). As described in Sect. 2.3, hydrodynamical computations were not analysed with amplitude equations because of the resonances. We also note that for the discussed models the fundamental and third overtone modes can be linearly unstable as well. We checked with the analytical signal method that these two modes are present during the transient evolution, but they decay, and except for one model (see next paragraph) are not present in full amplitude pulsation.
The results are qualitatively the same for both metallicities, and below we focus our discussion on the lower metallicity models (Figs. 4 and 6). The most interesting modal selection scenario is visible along the 2.5M⊙ evolutionary track. The individual trajectories of some models in this sequence are displayed in Fig. 6. For the hottest model in this sequence (not shown in Fig. 6), 2O/3O hysteresis is possible. Depending on the initial conditions, the trajectories evolve either towards the second overtone attractor or towards the third overtone attractor. In six consecutive cooler models, only single-periodic pulsation in the second overtone is possible. Then, a double-overtone domain emerges. A multi-mode attractor is clearly visible for models with log Teff = 3.8349, 3.8316, and 3.8284. Periods and period ratios for these models are given in Fig. 6. The only model redward of this domain pulsates in the first overtone. Thus, the double-overtone domain appears in between the first overtone and the second overtone pulsation domains. Although this is a typical scenario for a non-resonant mechanism, a resonant mechanism cannot be excluded a priori. The arrow in Fig. 4 shows the location of the 2ω1 = ω5 resonance centre. It is located quite close to the double-overtone domain. The resonant destabilisation of the first overtone limit cycle, if it occurs at a proper position along the model sequence, can in principle lead to the emergence of the double-overtone domain instead of the either-or 1O/2O domain. Note that the 2:1 resonance can affect the pulsations in a very wide range of period ratios, as is observed for bump Cepheids, and that destabilisation may not necessarily occur exactly at the resonance centre (see Smolec 2009a). We postpone the discussion of the nature of the computed double-periodic models to the next paragraphs in this section.
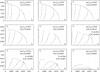 |
Fig. 6 Fractional radius amplitude for the second overtone (A2) and for the first overtone mode (A1), for nine consecutive models located along evolutionary track of 2.5M⊙ (Z = 0.006). The models were initialized with a range of amplitude ratios. The effective temperatures of the models and linear P5/P1 period ratios are given in each panel. The approximate location of the attractors is marked with filled circles. For the models with a double-periodic attractor the periods P1 and period ratios, P2/P1, are also given. All trajectories in the first five panels evolve towards a single-periodic second overtone attractor. In the next three panels (panels 6–8) a double-periodic attractor is clearly visible. In the last panel, all trajectories evolve towards a single-periodic first overtone attractor. |
The remaining five non-linear model sequences of Z = 0.006 all display qualitatively the same mode selection scenario, which is different however from scenario described for the 2.5M⊙ sequence. A double-periodic domain is not present. Instead, the either-or 1O/2O domain is located in between the single-periodic first overtone and second overtone pulsation domains. The discussed resonances seem to have no visible effect on the modal selection along these sequences.
For higher metallicity models, the overall modal selection is very similar to the lower metallicity models (compare Figs. 4 and 5). Again, the most interesting results are obtained for models of the shortest periods with masses of 2.5M⊙. Here, a multi-mode domain emerges. Simultaneous pulsation in the first and second overtones is possible for three models along the sequence. The centre of the 2:1 resonance between first and fifth overtones, marked with arrow in Fig. 5, falls exactly in the middle of the double-periodic domain. This supports the hypothesis that the resonance is crucial in establishing the stable double-periodic behaviour that we found for both metallicities. For the remaining four model sequences with metallicity Z = 0.008, no traces of multi-mode behaviour are found. Again, as for the Z = 0.006 models, it seems that resonances do not affect the modal selection along model sequences of higher masses (longer periods).
Considering the double-overtone models we found it is hard to judge which mechanism, resonant or non-resonant, is responsible for the computed beat pulsation. Both double-periodic domains (for Z = 0.006 and Z = 0.008) are located very close to the 2ω1 = ω5 resonance centre. For the Z = 0.008 models the resonance centre falls exactly in the middle of the double-periodic domain. This suggests the resonant origin of the computed beat pulsation. On the other hand, these double-periodic domains are located in between two single-periodic pulsation domains, first overtone pulsation domain (to the red) and second overtone pulsation domain (to the blue). This is typical for the non-resonant scenario. Also, for all studied sequences of masses M > 2.5M⊙, which cross the 2ω1 = ω5 resonance centre (see Fig. 3), no traces of beat pulsation were found. Instead, an 1O/2O either-or domain is present. Although the presence of the resonance may be not sufficient to excite the beat pulsation and other factors may be necessary (like for the F+1O models discussed in the previous section), it is hard to identify these factors and prove their necessity. Therefore, we do not presume to know which mechanism, resonant or non-resonant, underlies the double-overtone behaviour we found.
Although some double-overtone models were found, the overall results are not satisfactory. The computed double-overtone domains are narrow and are located at P1 ≈ 0.3d, i.e. at the short-period end of the observed domain of the double-overtone pulsation in the LMC. No double-overtone models were found at longer periods, particularly in a period range, 0.5d < P1 < 0.9d, where the double-overtone pulsation is the most common form of pulsation in the LMC. Surprisingly, in many models only pulsation in the second overtone is possible. Observationally, this form of pulsation is very rare, as only 14 such objects are identified in the LMC (Soszyński et al. 2008, still, observational selection can be a factor here). Therefore, also for the 1O+2O double-overtone Cepheids the convective hydrocode fails to reproduce the observed modal selection. This conclusion is not as strict as for the F+1O Cepheids, because only one set of convective parameters was explored. On the other hand, for hot overtone models, convection is not expected to play a crucial role, and results should not depend strongly on the values of convective parameters and/or effects included in the convective model.
5. Conclusions
The longstanding problem of non-linear modelling of beat Cepheid pulsation remains open. Our search for stable double-periodic Cepheid pulsation with convective hydrocode, which correctly includes negative buoyancy effects, yielded unsatisfactory results. This search is a difficult and time-consuming task. The turbulent convection model we use contains several free parameters. Also, the Cepheid domain extends over a wide range of luminosities in the HR diagram, covering different masses and evolutionary stages. Consequently, extensive model computations are needed. Our recent model surveys (Smolec & Moskalik 2008b; Smolec 2009b; this paper) cover different stellar systems (Galaxy, LMC) and different evolutionary stages (post-main sequence and helium burning objects). Different sets of convective parameters were investigated. An extensive parameter study was done for F+1O Cepheid models (Smolec & Moskalik 2008b). For the 1O+2O models presented here, only a limited study with carefully chosen parameters was possible, owing to the longer computation time needed for these models (see Sect. 4.1). Only a few double-periodic models, limited to a narrow period ranges, were found. In particular, we have not found any large domain in which the non-resonant mechanism is the sole cause of the double-mode pulsation.
In most of the observed Cepheids a non-resonant mechanism should be responsible for the simultaneous pulsation in two modes. With purely radiative hydrocodes, non-resonant double-mode models are found only for RR Lyrae stars, and only if the artificial viscosity is significantly reduced (Kovács & Buchler 1993). These models are however sensitive to numerical details and their pulsation amplitudes are too high. On the other hand, several computed resonant radiative beat Cepheid and RR Lyrae models (Kovács & Buchler 1988; Buchler et al 1990; Smolec 2009a) disagree with the observations. The inclusion of turbulent convection into pulsation hydrocodes seemed to offer the solution. Using modified Kuhfuß convection model where negative buoyancy effects were excluded (e.g. Kolláth et al. 1998), the Florida-Budapest group published many non-resonant beat Cepheid models (e.g. Kolláth et al. 2002; Buchler 2009). However, the exclusion of the negative buoyancy is physically not justified and, as shown by Smolec & Moskalik (2008b), it is the main cause of the computed double-mode pulsation. Using the original Kuhfuß prescription including the negative buoyancy, we were unable to find any non-resonant F+1O double-mode Cepheid models (Smolec & Moskalik 2008b). In this paper we conducted an additional search for double-periodic Cepheids, including double-overtone (1O+2O) pulsators. With our hydrocode, which includes negative buoyancy effects, we found several double-periodic models of both F+1O and 1O+2O type. In the first case, the double-periodic pulsation is most likely caused by the 2ω1 = ω0 + ω2 resonance. In the latter case, the exact mechanism cannot be identified beyond doubt. We only note that the 2:1 resonance, 2ω1 = ω5 may be operational in these models. The computed models are very interesting. Their periods and period ratios agree well with the observations. Nevertheless, they are restricted to very narrow domains in the HR diagram and offer no general solution to the problem of modelling the beat Cepheid pulsation.
Turbulent convection is an important phenomenon determining the properties of Cepheid envelopes and cannot be neglected in pulsation models. However, the numerical expense of non-linear computations requires relatively simple convective recipes. So far, only one-equation models for the generation of turbulent convection were implemented in pulsation hydrocodes. Two such models were used in the computation of Cepheid models, the Kuhfuß (1986) model and the Stellingwerf model (Stellingwerf 1982; Bono & Stellingwerf 1992). Our extensive computations (Smolec & Moskalik 2008b; Smolec 2009b; this paper) indicate that the original Kuhfuß model (i.e. including negative buoyancy) is incapable of reproducing the majority of the observed beat Cepheids. In the original Stellingwerf (1982) model, the negative buoyancy effects were neglected, because in that model the turbulent source function is proportional to square-root of the superadiabatic gradient,  . This makes the original Stellingwerf model very similar to the modified Kuhfuß model used in the Florida-Budapest hydrocode, and indeed, as investigated by Buchler & Kolláth (2000) both convection recipes lead to qualitatively the same results. Stellingwerf’s (1982) functional form of the source function was criticised by Gehmeyr & Winkler (1992) who pointed out the arising problems associated with the long time-scale of decay of the turbulent eddies in regions that became convectively stable during pulsation. Bono & Stellingwerf (1992) modified the original Stellingwerf recipe through setting
  . With this model for negative buoyancy, plenty of Cepheid models were computed with the Italian code (e.g. Bono et al. 2000). However, no double-periodic classical Cepheid models were ever found (Bono, private communication). This supports our results. Including the negative buoyancy in the convective models (both in Kuhfuß and in Stellingwerf models), wide domains of double-periodic pulsation cannot be found. We conclude that with the one-equation models used in non-linear Cepheid modelling, double-periodic Cepheid pulsation cannot be modelled satisfactorily.
The question of how the hydrocodes should be modified to solve the puzzle of beat Cepheid pulsation is difficult to answer. A simple convection model seems the most severe shortcoming of the present hydrocodes. More sophisticated convective recipes are being developed (Stökl 2008; Buchler 2009), however, many problems have to be solved before they can be applied in non-linear modelling. Another shortcoming of the present models is the simple structure of the constructed Cepheid envelopes – they are chemically homogeneous and non-rotating. Without detailed model computations however, it is hard to judge whether e.g. possible differential rotation could have an effect on modal selection. The treatment of radiation is also very simple in most of the hydrocodes, i.e. diffusion approximation is used (our code, the Florida-Budapest code and Italian code). However, a more detailed time-dependent treatment did not lead to substantial changes in the computed models (Feuchtinger et al. 2000). Finally, in the present models only radial pulsation is considered. Non-radial modes are neglected. There is a growing evidence that non-radial modes are excited in classical Cepheids, including the beat Cepheids (see e.g. Moskalik & Kołaczkowski 2009). The coupling between non-radial and radial modes can affect the modal selection, and in our opinion, this is one of the ideas that should be investigated first. For this purpose, an analytical approach based on the amplitude equation formalism may be used, without the necessity of developing a non-linear non-radial hydrocode.
The transformation from the observed colours to effective temperatures is particularly difficult for pulsating stars. In addition, inaccurate or unknown reddenings for individual objects significantly add to the uncertainty of the log Teff calibration.
Acknowledgments
We are grateful to Giuseppe Bono for his comments concerning the computation of double-mode classical pulsator models with Italian code. Model computations presented in this paper were completed while R.S. was PhD student in the Copernicus Centre, Warsaw, Poland. R.S. is supported by the Austrian Science Fund (FWF project AP 2120521). Part of this work was supported by the Polish MNiSW Grant No. 1 P03D 011 30. The grant N N203 379636 to Alosha Pamyatnykh is acknowledged for supporting the accommodation costs during RS’s stay in Warsaw.
References
- Alcock, C., Allsman, R. A., Axelrod, T. S., et al. 1995, AJ, 109, 1653 [NASA ADS] [CrossRef] [Google Scholar]
- Alexander, D. R., & Ferguson, J. W. 1994, ApJ, 437, 879 [NASA ADS] [CrossRef] [Google Scholar]
- Antipin, S. V. 1997, IBVS, 4485, 1 [NASA ADS] [Google Scholar]
- Antipin, S. V. 1998, IBVS, 4556, 1 [NASA ADS] [Google Scholar]
- Antipin, S. V. 2006, Perem. Zvezdy Prilozh., 6, 9 [NASA ADS] [Google Scholar]
- Asplund, M., Grevesse, N., Sauval, A. J., Allen de Prieto, C., & Kiselman, D. 2004, A&A, 417, 751 [NASA ADS] [CrossRef] [EDP Sciences] [Google Scholar]
- Baranowski, R., Smolec, R., Dimitrov, W., et al. 2009, MNRAS, 396, 2194 [NASA ADS] [CrossRef] [Google Scholar]
- Beltrame, M., & Poretti, E. 2002, A&A, 386, L9 [NASA ADS] [CrossRef] [EDP Sciences] [Google Scholar]
- Berdnikov, L. N., & Turner, D. G. 1998, IBVS, 4567, 1 [NASA ADS] [Google Scholar]
- Bono, G., & Stellingwerf, R. F. 1992, Mem. Soc. Astron. Ital., 63, 357 [NASA ADS] [Google Scholar]
- Bono, G., Marconi, M., & Stellingwerf, R. F. 2000, A&A, 360, 245 [NASA ADS] [Google Scholar]
- Buchler, J. R. 2009, in Stellar Pulsation: Challenges for Theory and Observation, ed. J. Guzik, & P. Bradley, AIP Conf. Proc., 1170, 51 [Google Scholar]
- Buchler, J. R., & Goupil, M.-J. 1984, ApJ, 279, 394 [NASA ADS] [CrossRef] [MathSciNet] [Google Scholar]
- Buchler, J. R., & Kolláth, Z. 2000, Annals of the New York Academy of Sciences, 898, 39 [NASA ADS] [CrossRef] [Google Scholar]
- Buchler, J. R., Moskalik, P., & Kovács, G. 1990, ApJ, 351, 617 [NASA ADS] [CrossRef] [Google Scholar]
- Dziembowski, W. A. 1977, Acta Astron., 27, 95 [NASA ADS] [Google Scholar]
- Dziembowski, W. A., & Kovács, G. 1984, MNRAS, 206, 497 [NASA ADS] [Google Scholar]
- Dziembowski, W. A., & Smolec, R. 2009, Acta Astron., 59, 19 [NASA ADS] [Google Scholar]
- Feuchtinger, M. U. 1998, A&A, 337, 29 [Google Scholar]
- Feuchtinger, M. U., Buchler, J. R., & Kolláth Z. 2000, ApJ, 544, 1056 [NASA ADS] [CrossRef] [Google Scholar]
- Gehmeyr, M., & Winkler, K.-H. A. 1992, A&A, 253, 101 [NASA ADS] [Google Scholar]
- Grevesse, N., & Noels, A. 1993, in Origin and Evolution of the Elements, ed. N. Pratzo, E. Vangioni-Flam, & M. Casse (Cambridge Univ. Press.), 15 [Google Scholar]
- Hajdu, G., Jurcsik, J., & Sodor, A. 2009, IBVS, 5882, 1 [Google Scholar]
- Iglesias, C. A., & Rogers, F. J. 1996, ApJ, 464, 943 [NASA ADS] [CrossRef] [Google Scholar]
- Khruslov, A. V. 2009a, Perem. Zvezdy Prilozh., 9, 14 [NASA ADS] [Google Scholar]
- Khruslov, A. V. 2009b, Perem. Zvezdy Prilozh., 9, 17 [NASA ADS] [Google Scholar]
- Khruslov, A. V. 2009c, Perem. Zvezdy Prilozh., 9, 31 [NASA ADS] [Google Scholar]
- Khruslov, A. V. 2010, Perem. Zvezdy Prilozh., 10, 16 [NASA ADS] [Google Scholar]
- Kolláth, Z., Beaulieu, J. P., Buchler, J. R., & Yecko, P. 1998, ApJ, 502, L55 [NASA ADS] [CrossRef] [Google Scholar]
- Kolláth, Z., Buchler, J. R., Szabó, R., & Csubry, Z. 2002, A&A, 385, 932 [NASA ADS] [CrossRef] [EDP Sciences] [Google Scholar]
- Kovács, G., & Buchler, J. R. 1988, ApJ, 324, 1026 [NASA ADS] [CrossRef] [Google Scholar]
- Kovács, G., & Buchler, J. R. 1993, ApJ, 404, 765 [NASA ADS] [CrossRef] [Google Scholar]
- Kuhfuß, R. 1986, A&A, 160, 116 [NASA ADS] [Google Scholar]
- Moskalik, P., & Dziembowski, W. A. 2005, A&A, 434, 1077 [NASA ADS] [CrossRef] [EDP Sciences] [Google Scholar]
- Moskalik, P., & Kołaczkowski, Z. 2009, MNRAS, 394, 1649 [NASA ADS] [CrossRef] [Google Scholar]
- Pamyatnykh, A. A. 1999, Acta Astron., 49 ,119 [Google Scholar]
- Pardo, I., & Poretti, E. 1997, A&A, 324, 121 [NASA ADS] [Google Scholar]
- Petersen, J. O. 1973, A&A, 27, 89 [NASA ADS] [Google Scholar]
- Pojmanski, G. 2002, Acta Astron., 52, 397 [NASA ADS] [Google Scholar]
- Sandage, A., Tammann, G. A., & Reindl, B. 2004. A&A, 424, 43 [Google Scholar]
- Schaller, G., Schaerer, D., Meynet, G., & Maeder, A. 1992, A&AS, 96, 269 [Google Scholar]
- Seaton, M. 2005, MNRAS, 362, L1 [NASA ADS] [CrossRef] [Google Scholar]
- Simon, N. R. 1979, A&A, 75, 140 [NASA ADS] [Google Scholar]
- Simon, N. R. 1982, ApJ, 260, L87 [NASA ADS] [CrossRef] [Google Scholar]
- Smolec, R. 2009a, in, Non-linear Pulsations and Hydrodynamics of Cepheids, ed. M. Goupil, Z. Kolláth, N. Nardetto, & P. Kervella, EAS Publications Series, 38, 175 [Google Scholar]
- Smolec, R. 2009b, PhD Thesis, N. Copernicus Astronomical Centre, Warsaw [Google Scholar]
- Smolec, R., & Moskalik, P. 2007, MNRAS, 377, 645 [NASA ADS] [CrossRef] [Google Scholar]
- Smolec, R., & Moskalik, P. 2008a, Acta Astron., 58, 193 [NASA ADS] [Google Scholar]
- Smolec, R., & Moskalik, P. 2008b, Acta Astron., 58, 233 [NASA ADS] [Google Scholar]
- Smolec, R., & Moskalik, P. 2009, in Stellar Pulsation: Challenges for Theory and Observation, ed. J. Guzik & P. Bradley, AIP Conf. Proc., 1170, 73 [Google Scholar]
- Soszyński, I., Poleski, R., Udalski, A., et al. 2008, Acta Astron., 58, 163 [NASA ADS] [Google Scholar]
- Stellingwerf, R. F. 1982, ApJ, 262, 330 [NASA ADS] [CrossRef] [Google Scholar]
- Stökl, A. 2008, A&A, 490, 1181 [NASA ADS] [CrossRef] [EDP Sciences] [Google Scholar]
- Szabó, R., Kolláth, Z., & Buchler, J. R. 2004, A&A, 425, 627 [NASA ADS] [CrossRef] [EDP Sciences] [Google Scholar]
- Szczygiel, D. 2009, PhD Thesis, Warsaw University, Warsaw [Google Scholar]
- Udalski, A., Szymanski, M., Soszynski, I., & Poleski, R. 2008, Acta Astron., 58, 69 [NASA ADS] [Google Scholar]
- Wils, P., & Otero, S. A. 2004, IBVS, 5501, 1 [NASA ADS] [Google Scholar]
- Wils, P., Henden, A. A., Kleidis, S., Schmidt, E. G., & Welch, D. L. 2010, MNRAS, 402, 1156 [NASA ADS] [CrossRef] [Google Scholar]
- Wuchterl, G., & Feuchtinger, M. U. 1998, A&A, 340, 419 [NASA ADS] [Google Scholar]
All Tables
Properties of the computed double-periodic F+1O convective Cepheid models (mass, effective temperature, proximity parameter, fundamental mode period and P1/P0 period ratio).
All Figures
|
Fig. 1 Fractional radius amplitude for the first overtone (A1) and for the fundamental mode (A0) for six consecutive Cepheid models of set R2. The models were initialized with a range of amplitude ratios (bottom left parts of the diagrams) and for each initialization the time evolution (marked with arrow) was followed. The model properties are given in each panel. The proximity to the resonance centre is characterised by Δ = 2ω1/(ω0 + ω2). Solid and open squares mark the location of stable and unstable fixed points computed through fitting the hydrodynamical trajectories with non-resonant amplitude equations. In panels three to five some trajectories evolve to a double-periodic attractor with finite amplitude in both the fundamental and first overtone modes. The remaining (rightmost) trajectories calculated for these three models evolve towards a single-periodic finite amplitude fundamental mode pulsation. |
| In the text | |
|
Fig. 2 Location of the 2ω1 = ω0 + ω2 resonance centre (dotted line) and the computed resonant multi-mode F+1O Cepheid models (within the circle) in the HR diagram. The loci of other resonance centres are also shown. The thick and thin solid lines enclose the fundamental and first overtone instability strips. The dashed lines are the lines of the constant period (F-mode) indicated in the figure. Computations were done for set R2 of Table 1. |
| In the text | |
|
Fig. 3 Domains of simultaneous linear instability of first and second overtones in the Petersen diagram. Black dots represent the observed LMC double-overtone Cepheids. Line segments are models with normal and artificially increased luminosity, as described in the bottom panel. Asterisks and pentagons mark resonances between low order modes. Resonances might be helping to produce double-overtone behaviour only for the shorter-period Cepheids, but not for the more numerous longer-period ones. |
| In the text | |
|
Fig. 4 Petersen diagram showing the location and stability information for the computed non-linear convective models. The models were chosen to cover the significant part of the Petersen diagram. These are models of 2.5M⊙, 3.0M⊙ and 3.5M⊙ located along evolutionary tracks (Δlog L = 0.0) and models with artificially increased luminosity of masses 3.5M⊙ (Δlog L = 0.2), and 2.5M⊙ and 3.0M⊙ (Δlog L = 0.4). All computations are for the metallicity parameter Z = 0.006. Black dots represent the observed LMC double-overtone Cepheids. The only double-periodic models are found near the 2ω1 = ω5 resonance centre, which is marked with an arrow. |
| In the text | |
|
Fig. 5 Same as Fig. 4, but for metallicity parameter Z = 0.008. The chosen models cover the significant part of the instability strip. These are models of 2.5M⊙, 3.0M⊙ and 3.5M⊙ located along evolutionary tracks (Δlog L = 0.0) and models with an artificially increased luminosity of masses 2.5M⊙ and 3.0M⊙ (Δlog L = 0.4). The only double-periodic models are found near the 2ω1 = ω5 resonance centre, which is marked with an arrow. |
| In the text | |
|
Fig. 6 Fractional radius amplitude for the second overtone (A2) and for the first overtone mode (A1), for nine consecutive models located along evolutionary track of 2.5M⊙ (Z = 0.006). The models were initialized with a range of amplitude ratios. The effective temperatures of the models and linear P5/P1 period ratios are given in each panel. The approximate location of the attractors is marked with filled circles. For the models with a double-periodic attractor the periods P1 and period ratios, P2/P1, are also given. All trajectories in the first five panels evolve towards a single-periodic second overtone attractor. In the next three panels (panels 6–8) a double-periodic attractor is clearly visible. In the last panel, all trajectories evolve towards a single-periodic first overtone attractor. |
| In the text | |
Current usage metrics show cumulative count of Article Views (full-text article views including HTML views, PDF and ePub downloads, according to the available data) and Abstracts Views on Vision4Press platform.
Data correspond to usage on the plateform after 2015. The current usage metrics is available 48-96 hours after online publication and is updated daily on week days.
Initial download of the metrics may take a while.