Fig. 4
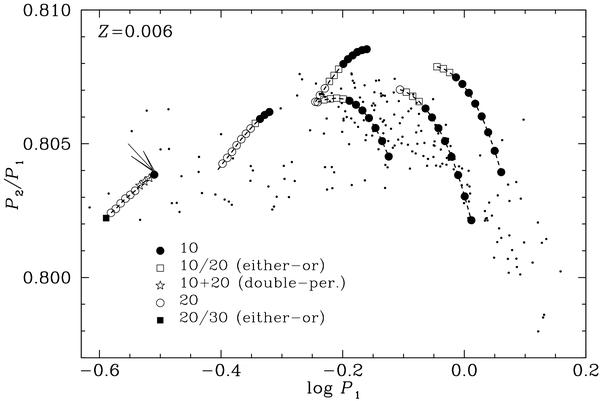
Petersen diagram showing the location and stability information for the computed non-linear convective models. The models were chosen to cover the significant part of the Petersen diagram. These are models of 2.5M⊙, 3.0M⊙ and 3.5M⊙ located along evolutionary tracks (Δlog L = 0.0) and models with artificially increased luminosity of masses 3.5M⊙ (Δlog L = 0.2), and 2.5M⊙ and 3.0M⊙ (Δlog L = 0.4). All computations are for the metallicity parameter Z = 0.006. Black dots represent the observed LMC double-overtone Cepheids. The only double-periodic models are found near the 2ω1 = ω5 resonance centre, which is marked with an arrow.
Current usage metrics show cumulative count of Article Views (full-text article views including HTML views, PDF and ePub downloads, according to the available data) and Abstracts Views on Vision4Press platform.
Data correspond to usage on the plateform after 2015. The current usage metrics is available 48-96 hours after online publication and is updated daily on week days.
Initial download of the metrics may take a while.