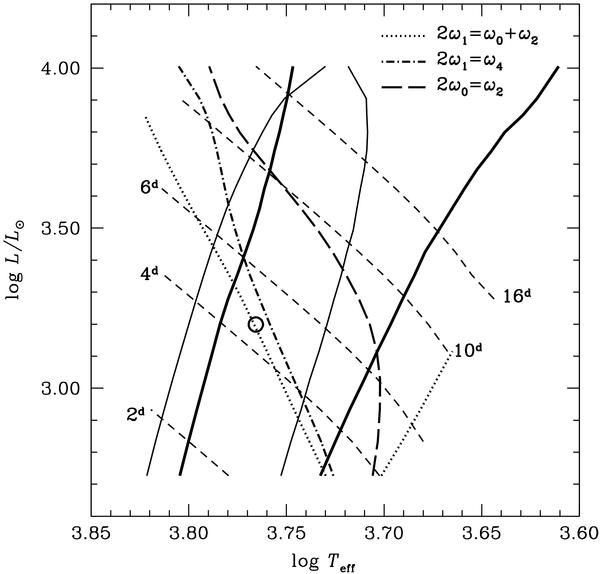
Fig. 2

Location of the 2ω1 = ω0 + ω2 resonance centre (dotted line) and the computed resonant multi-mode F+1O Cepheid models (within the circle) in the HR diagram. The loci of other resonance centres are also shown. The thick and thin solid lines enclose the fundamental and first overtone instability strips. The dashed lines are the lines of the constant period (F-mode) indicated in the figure. Computations were done for set R2 of Table 1.
Current usage metrics show cumulative count of Article Views (full-text article views including HTML views, PDF and ePub downloads, according to the available data) and Abstracts Views on Vision4Press platform.
Data correspond to usage on the plateform after 2015. The current usage metrics is available 48-96 hours after online publication and is updated daily on week days.
Initial download of the metrics may take a while.


