Fig. 3
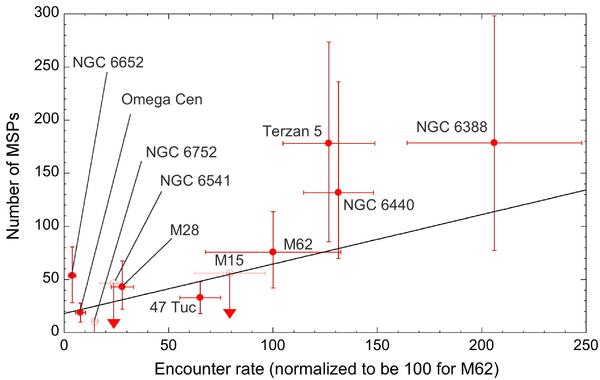
Predicted number of MSPs versus stellar encounter rate Γe. Horizontal error bars indicate the uncertainties in Γe due to the distance uncertainties given in Table 4 and due to uncertainties in θc that we estimated from the spread of values quoted in the recent literature. The data have been fitted by a linear relation NMSP = 0.5 × Γe + 18.
Current usage metrics show cumulative count of Article Views (full-text article views including HTML views, PDF and ePub downloads, according to the available data) and Abstracts Views on Vision4Press platform.
Data correspond to usage on the plateform after 2015. The current usage metrics is available 48-96 hours after online publication and is updated daily on week days.
Initial download of the metrics may take a while.