Fig. 9
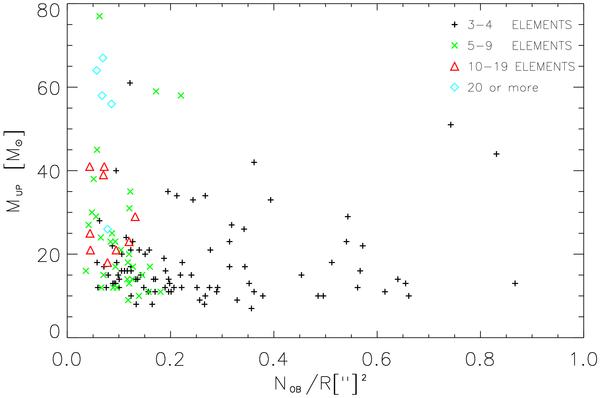
The mass of the most massive star of each association is plotted as a function of stellar density, estimated as the number of bona fide OB members divided by the squared radius of the association. Different symbols represent NOB, as indicated in the legend. Associations #94 and #184 with density 1.2 and 1.9 are left out of the plot for clarity.
Current usage metrics show cumulative count of Article Views (full-text article views including HTML views, PDF and ePub downloads, according to the available data) and Abstracts Views on Vision4Press platform.
Data correspond to usage on the plateform after 2015. The current usage metrics is available 48-96 hours after online publication and is updated daily on week days.
Initial download of the metrics may take a while.