Fig. 2
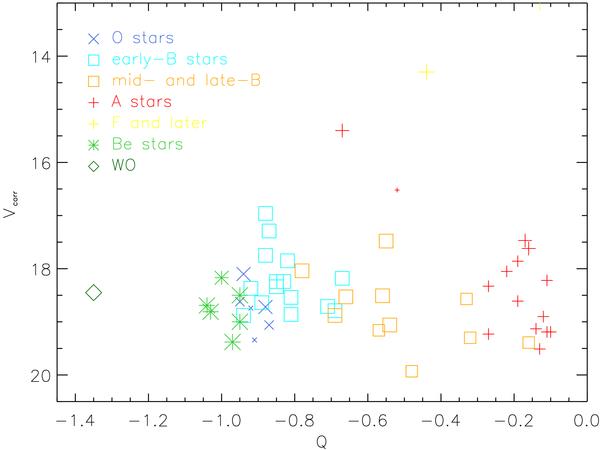
Location in the Q vs. Vcorr diagram of the sample stars classified by Bresolin et al. (2007). Color and symbols have the same meaning as in Fig. 1. The different groups of stars (O types, B types, Be stars, and the WO) are located in separated loci of the diagram, with a small degree of mixing.
Current usage metrics show cumulative count of Article Views (full-text article views including HTML views, PDF and ePub downloads, according to the available data) and Abstracts Views on Vision4Press platform.
Data correspond to usage on the plateform after 2015. The current usage metrics is available 48-96 hours after online publication and is updated daily on week days.
Initial download of the metrics may take a while.