Fig. 11
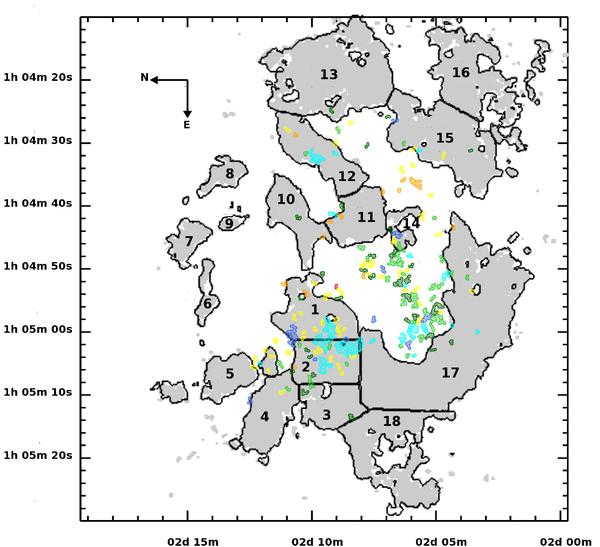
Relative distribution of neutral hydrogen and OB associations. The grey shadow outlines the distribution of HI in IC 1613 (adapted from Fig. 1 of Silich et al. 2006). Colored contours indicate the position of the associations of Garcia et al. (2009). Color indicates the age of the youngest members, with the same color code as in Fig. 10. Numbers follow the HI fragment numbering of Silich et al. (2006). The HI cavity is surrounded by fragments 1, 10, 11, 14, and 17.
Current usage metrics show cumulative count of Article Views (full-text article views including HTML views, PDF and ePub downloads, according to the available data) and Abstracts Views on Vision4Press platform.
Data correspond to usage on the plateform after 2015. The current usage metrics is available 48-96 hours after online publication and is updated daily on week days.
Initial download of the metrics may take a while.