Fig. 10
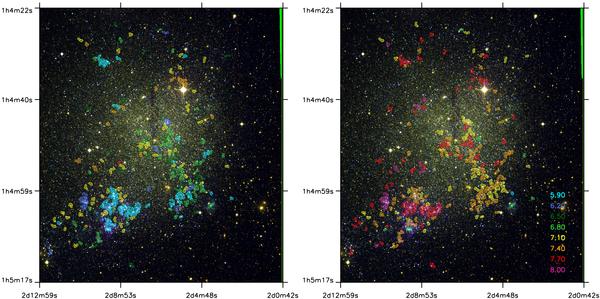
Ages of OB associations in IC 1613. North is left and east is down. The association perimeters are plotted over the INT-WFC RGB image of IC 1613 (same field shown as in Fig. 9 of Paper I), with the age indicated by the contour colors. Since most associations exhibit age dispersion, the left panel shows the age of the youngest association members, and the right panel the age of the older members. Color–code is: cyan log age = 5.9, blue log age = 6.2, dark green log age = 6.5, light green log age = 6.8, yellow log age = 7.1, orange log age = 7.4, red log age = 7.7, violet log age = 8.0. The largest concentration of young associations is found in the bubble region of the galaxy in the NE lobe.
Current usage metrics show cumulative count of Article Views (full-text article views including HTML views, PDF and ePub downloads, according to the available data) and Abstracts Views on Vision4Press platform.
Data correspond to usage on the plateform after 2015. The current usage metrics is available 48-96 hours after online publication and is updated daily on week days.
Initial download of the metrics may take a while.