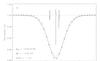
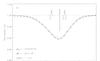
Fig. 8
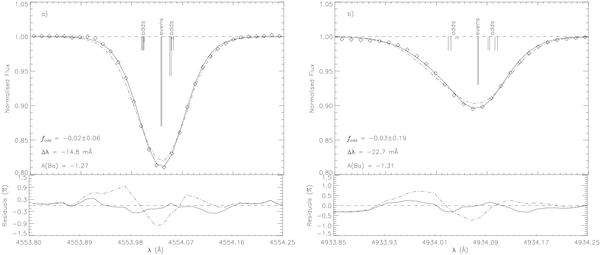
Panel a): the best statistical fit for the 4554 Å line (diamonds) using a radial-tangential velocity profile (solid line). We have included a pure r-process, fodd = 0.46, synthetic profile for comparison (dash-dot line). Also plotted are the splitting patterns for barium relative to barium-138 (see Table 2). Panel b): same as panel a) but for the 4934 Å line.
Current usage metrics show cumulative count of Article Views (full-text article views including HTML views, PDF and ePub downloads, according to the available data) and Abstracts Views on Vision4Press platform.
Data correspond to usage on the plateform after 2015. The current usage metrics is available 48-96 hours after online publication and is updated daily on week days.
Initial download of the metrics may take a while.