Fig. 7
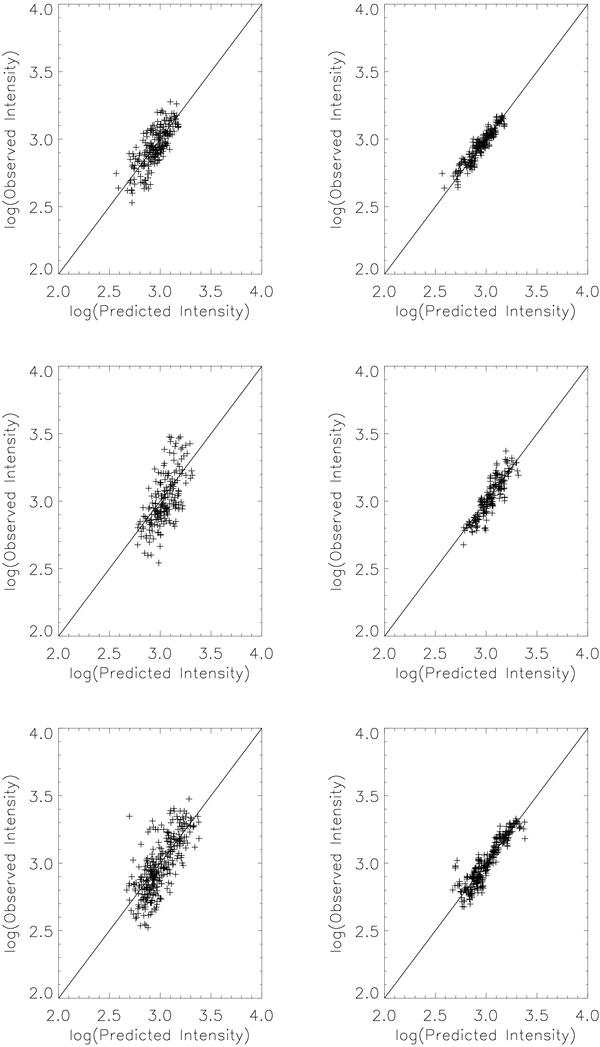
Comparison of observed and simulated O V intensities (I ∝ |φ| δLλ) for the optimum values of δ and λ, for active regions 1 (top), 2 (middle) and 3 (bottom) – see Table 1 for region details. Intensities are in units of erg cm-2 s-1 sr-1. Panels in the left column show the original data, where crosses denote pixels with absolute magnetic flux density φ > 90 Mx cm-2, used to calculate χ2. Pixel size is 4′′ × 4′′. Panels in the right column show the observed O V intensities smoothed with a 5-point running average. The continuous line is an y = x relationship.
Current usage metrics show cumulative count of Article Views (full-text article views including HTML views, PDF and ePub downloads, according to the available data) and Abstracts Views on Vision4Press platform.
Data correspond to usage on the plateform after 2015. The current usage metrics is available 48-96 hours after online publication and is updated daily on week days.
Initial download of the metrics may take a while.