Fig. 6
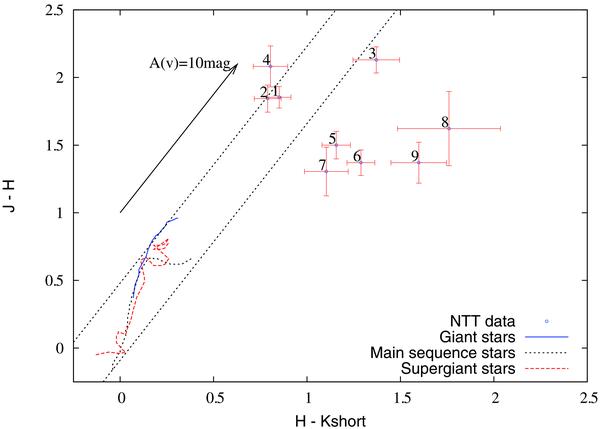
Near-infrared color − color plot (J−H) vs. (H−Ks) derived using the magnitudes measured by us with the NTT, listed in Table 3. The dotted curves show the loci of dwarf, giant and supergiant stars, based on the intrinsic colors by Tokunaga (2000). The straight dotted lines represent the reddening vectors for these stars (see text).
Current usage metrics show cumulative count of Article Views (full-text article views including HTML views, PDF and ePub downloads, according to the available data) and Abstracts Views on Vision4Press platform.
Data correspond to usage on the plateform after 2015. The current usage metrics is available 48-96 hours after online publication and is updated daily on week days.
Initial download of the metrics may take a while.