Fig. 1
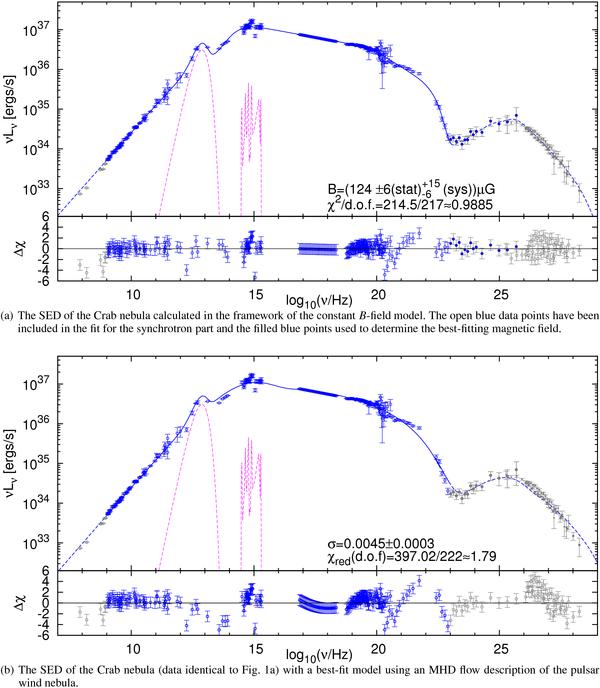
The SEDs for the constant B-field and MHD flow model. The data compilation is based upon Aharonian et al. (2004) with updates listed in Table 1 and modifications (e.g. scaling of the SPI flux) described in the text. See Sect. 2 for further details. The synchrotron emission fitted to the data is shown by the blue solid line while the remaining components (low energy part and inverse Compton emission) naturally result from the model. Therefore, blue data points have been included in the fit whereas the gray points have been excluded. In addition to the nonthermal continuum emission, the contribution of dust and line emission from the filaments is indicated with a magenta dashed line. The lower panels show the residuals of the fit.
Current usage metrics show cumulative count of Article Views (full-text article views including HTML views, PDF and ePub downloads, according to the available data) and Abstracts Views on Vision4Press platform.
Data correspond to usage on the plateform after 2015. The current usage metrics is available 48-96 hours after online publication and is updated daily on week days.
Initial download of the metrics may take a while.