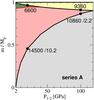
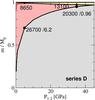
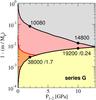
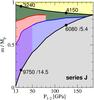
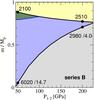
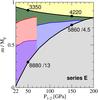
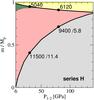
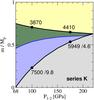
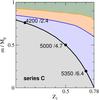
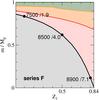
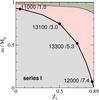
Fig. 1
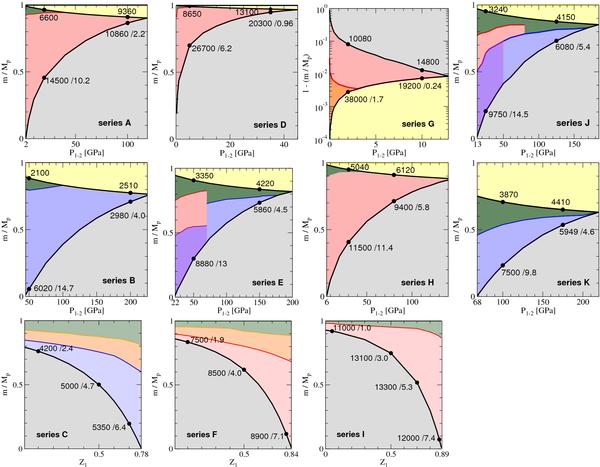
Mass distribution of the three components H/He (yellow), water, and rocks (gray) for the 11 series A − K described in Table 1. Each panel shows various models running vertically, which differ in transition pressure P1 − 2 in the case of 3L models, and in envelope water mass fraction Z1 for 2L models (series C, F, and I). Thick black lines show layer boundaries, and numbers close to filled black circles denote temperature in K and pressure in Mbar. Water is subdivided into five colors coding fluid molecular and fluid dissociated water (green), plasma (red), superionic water (blue), an undissolved region in the water phase diagram close to the superionic phase (violet), and fluid dissociated water (orange) in series C, F, and G. In series C, F and I, the H/He mass fraction can be obtained via (1 − Z1) × (1 − Mcore/Mp). In series G, the center of the planet is at the top of the figure while for all other series, the center is at the bottom.
Current usage metrics show cumulative count of Article Views (full-text article views including HTML views, PDF and ePub downloads, according to the available data) and Abstracts Views on Vision4Press platform.
Data correspond to usage on the plateform after 2015. The current usage metrics is available 48-96 hours after online publication and is updated daily on week days.
Initial download of the metrics may take a while.