| Issue |
A&A
Volume 522, November 2010
|
|
|---|---|---|
| Article Number | L3 | |
| Number of page(s) | 4 | |
| Section | Letters | |
| DOI | https://doi.org/10.1051/0004-6361/201015696 | |
| Published online | 27 October 2010 | |
Letter to the Editor
The MBH − Mstar relation of obscured AGNs at high redshift⋆
1
Dipartimento di FisicaUniversità Roma Tre, via della Vasca Navale 84, 00146
Roma, Italy
2
INAF - Osservatorio Astronomico di Roma,
via di Frascati 33,
00040
Monte Porzio Catone,
Italy
e-mail: roberto.maiolino@oa-roma.inaf.it
3
Dipartimento di Astronomia, Università degli Studi di
Bologna, via
Ranzani1, 40127
Bologna,
Italy
4
INAF - Osservatorio Astronomico di Bologna,
via Ranzani 1, 40127
Bologna,
Italy
5
Dipartimento Fisica e Astronomia, Università degli Studi di
Firenze, Largo E. Fermi
2, 50125
Firenze,
Italy
Received:
6
September
2010
Accepted:
4
October
2010
We report the detection of broad Hα emission in three X-ray selected obscured AGNs at z ~ 1–2. By exploiting the Hα width and the intrinsic X-ray luminosity, we estimate their black hole masses, which are in the range 0.1–3 × 10⁹ M⊙. By means of multi-band photometric data, we measure the stellar mass of their host galaxy and, therefore, infer their MBH/Mstar ratio. These are the first obscured AGNs at high-z, selected based on their black hole accretion (i.e. on the basis of their X-ray luminosity), that can be located on the MBH − Mstar relation at high-z. All of these obscured high-z AGNs are fully consistent with the local MBH − Mstar relation. This result conflicts with those for other samples of AGNs in the same redshift range, whose MBH/Mstar ratio departs significantly from the value observed in local galaxies. We suggest that the obscured AGNs in our sample are in an advanced evolutionary stage, have already settled onto the local MBH-Mstar relation, and whose nuclear activity has been temporarily revived by recent galaxy interactions.
Key words: quasars: emission lines / galaxies: active / infrared: galaxies / X-rays: galaxies / Black hole physics
© ESO, 2010
1. Introduction
A major breakthrough in our understanding of galaxy evolution has been the discovery of a tight correlation, in the local universe, between the mass of supermassive black holes (MBH) and the mass of their host spheroids (e.g. Magorrian et al. 1998; Ferrarese & Merritt 2000) The existence of this relation implies a strong physical connection between galaxy formation and growth of black holes at their centers. Various models and simulations have been proposed to explain this correlation (e.g. Menci et al. 2006; Marulli et al. 2008; Hopkins et al. 2006; Volonteri & Natarajan 2009). These models predict different evolutionary patterns on the MBH − Mstar diagram through the cosmic epochs. Therefore, determining the location of high-z galaxies on the MBH − Mstar diagram provides a crucial test for galaxy-black hole coevolutionary scenarios.
Various observational studies have attempted to measure the evolution of the MBH − Mstar relation at high redshift. Most of these studies infer the MBH in high-z AGNs by using “virial estimators”, involving the AGN luminosity and width of the “broad emission lines” (e.g. Vestergaard & Osmer 2009; Shen et al. 2010). Broad lines, especially in the UV (observed in the optical at high-z), are generally detected only in unobscured, type 1 AGNs (AGN1s), whose broad line region can be observed directly. Thus the investigation of the MBH − Mstar relation has focused mostly on AGN1s, especially at high-z. Jahnke et al. (2009) use the virial relations to measure the BH masses of ten type 1 AGN at z ~ 1.4 and derive the stellar masses of their host galaxy by means of multi band fitting. They find that the BH-to-total stellar mass ratio does not evolve relative to the local relation; however, since several hosts show evidence of a substantial disk component they suggest that the ratio of BH mass to bulge mass (given by the difference between total and disk stellar mass) probably evolves with redshift. Merloni et al. (2010) expand the Jahnke et al. (2009) sample to 89 X-ray selected type 1 AGN at 1 < z < 2.4 in COSMOS (adopting a different method to measure the stellar masses). They infer that the MBH/Mstar ratio increases significantly, by a factor of about two, relative to the local relation. A similar result was obtained by Peng et al. (2006) by using a sample of lensed quasars in a similar redshift range. At higher redshifts (z ~ 4–6), dynamical mass measurements, obtained by exploiting CO maps, suggest that the MBH/Mstar ratio in type 1 AGNs increases even further, up to an order of magnitude relative to the local relation (Walter et al. 2004; Maiolino et al. 2007a; Lamastra et al. 2010; Wang et al. 2010).
Properties of the X-ray selected obscured AGN with broad Hα.
A possible caveat of these observational studies is that the targets are extracted from AGN-selected samples, i.e. on the basis of the black-hole accretion rate. This is expected to introduce a bias in favor of massive black holes (which can reach higher absolute accretion rates within their Eddington limit)1. More specifically, even if the MBH − Mstar relation does not evolve with redshift, it does have a scatter and the AGN-selection bias favors the selection of objects with MBH/Mstar higher than the true distribution, hence mimicking an evolution. Lauer et al. (2007) estimate that this bias may increase the inferred MBH − Mstar even by a factor of a few, depending on the AGN luminosity and the intrinsic scatter of the MBH − Mstar relation at high redshift. However, Merloni et al. (2010) demonstrate that, at least for their X-ray selected, unobscured AGN 1 sample, this bias should not significantly affect their own results.
The only work investigating the evolution of the MBH − Mstar relation through a sample of objects not pre-selected among AGNs is that of Alexander et al. (2008). Their parent sample is composed of sub-millimeter galaxies (SMGs), which are strongly starbursting systems at z ~ 2. Their sample consists mainly of obscured AGNs hosted such systems. For a subsample of these obscured AGNs, which show some broad Hα or Hβ, they are able infer the BH mass. In contrast to the type 1 AGN studies mentioned above, the inferred MBH/Mstar ratio of SMGs at z ~ 2 is lower than observed locally. However, this sample may be subject to an opposite bias than AGN-selected samples. Given the extraordinarily high star-formation rate of SMGs and the correlation between SFR and stellar mass, the sample used by Alexander et al. (2008) may be biased toward objects of high stellar mass (although SMGs are outliers on the SFR-mass relation, toward higher SFRs). The sub-mm selection may also favor dust-rich systems (Santini et al. 2010), hence more-evolved host galaxies and more massive galactic hosts. Altogether, these effects may favor of objects with MBH/Mstar ratios lower than the real distribution.
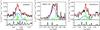 |
Fig. 1 Near-IR spectra (zoomed around Hα) of the three X-ray selected obscured AGNs with evidence for a broad component of Hα. The red line shows the fit resulting from a combination of a broad Hα Gaussian component (blue line), narrow Gaussian components of Hα, [NII] and, in the case of Abell2690#29, [SII] (green lines) and a linear continuum. The bottom panels show the sky spectrum in arbitrary units. |
Here we present near-IR spectra of three obscured quasars at z ~ 1–2, extracted from a sample of hard X-ray selected AGNs, that display a broad component of Hα, allowing us to infer the BH mass and MBH/Mstar ratio. These are the first obscured AGNs at high-z selected on the basis of their black hole accretion (i.e. because X-ray selected) that can be located on the MBH − Mstar diagram at high-z. We illustrate that the trend of these obscured AGNs differs significantly from that of the other samples of AGNs investigated in the same redshift range.
2. Sample selection, observations, and data analysis
These near-IR spectroscopic observations are part of a program designed to determine the redshift of and characterize obscured AGNs at high redshift selected from wide-area hard X-ray surveys. These AGNs are too faint at optical wavelengths to be observed spectroscopically. The parent samples consist of XMM hard X-ray sources from the HELLAS2XMM extended survey (Cocchia et al. 2007) and the XMM survey of the ELAIS-S1 field (Feruglio et al. 2008). From these samples, we selected 14 sources characterized by a X-ray to optical flux ratio X/O > 10, which is typical of most obscured (Compton-thin) AGNs at high redshift and, in particular, obscured QSOs (Fiore et al. 2003). Most of these optically faint AGNs have also very red optical-to-near-IR colors and, more specifically, R − K > 5 (Mignoli et al. 2004), i.e. are extremely red objects (EROs). This class of objects is generally found to consist mostly of either quiescent, evolved galaxies or dust-reddened star-forming galaxies at z ~ 1–2, with a fraction of obscured AGNs (e.g. Campisi et al. 2009). In the specific case of X-ray selected EROs, Mignoli et al. (2004) find that most of them are resolved in the K-band with typical sizes of 0″̣5 and elliptical-like profiles, implying that the K-band light is generally dominated by an early type host. The latter result is also confirmed in most objects by a SED analysis (Pozzi et al. 2007, 2010).
Our observations were performed in three observing runs. In the first run, we used ISAAC at the VLT to observe three HELLAS2XMM sources. We used ISAAC in its low spectral resolution mode (R ~ 500), covering the bands J, H, and K bands. These observations were presented in Maiolino et al. (2006) and we refer to that paper for further details. In the second run, we used SINFONI, the near-IR integral field spectrometer at the VLT, to observe three HELLAS2XMM sources. We used both the H + KR ~ 1500 grating and the J-band R ~ 2000 grating. The on-source integration times ranged from 40 min to 4 h per target in each band. In the third run, we observed nine sources from the ELIAS-S1 sample with SINFONI, with the same instrumental setting as for the previous SINFONI run and similar integration times. The seeing during the observations ranged from 0″̣7 to 1″̣5. Data reduction was performed using the ESO pipeline.
All targets were detected in the continuum. However, only for seven of them could we identify emission lines that allow us to unambiguously determine their redshift. At the inferred redshift (1 < z < 2.1) the inferred X-ray luminosity and X-ray spectral shape imply that these are all type 2, obscured QSOs (L2 − 10 keV > 1044 erg s-1, NH > 1022 cm-2). Here we focus on three sources for which we detect a broad component of Hα that allowed us to infer their BH masses. Their main observational and physical properties are reported in Table 1.
3. The MBH − Mstar relation
In Fig. 1, we show the near-IR spectra of the three obscured quasars at z ~ 1–2 with broad Hα (zoomed around the Hα line). No Hβ broad line is detected for any of these sources, which is indicative of a type 1.9 optical classification and consistent with the absorption inferred from both their X-ray spectrum and their optical faintness. We fitted the line profile with a broad Gaussian and three narrow Gaussians (FWHM < 800 km s-1) accounting for the contribution of the narrow components of both Hα and [NII]6548,6584. In the case of Abell2690#29, we also included the [SII]6720 doublet because the Hα is so broad that it extends to this rest-frame wavelength. We assumed that the narrow components have the same width and velocity shift. We also assumed that F([NII]6584)/F([NII]6548) = 3, as given by the relative transition probabilities of the corresponding levels. The continuum in this narrow redshift range is fitted simply with a linear component. Regions affected by very low S/N or bad residuals due to strong sky lines or bad atmospheric transmission were excluded from the fit. The resulting spectral fits are shown in Fig. 1 and the width of the broad components are listed in Table 1. The uncertainty in the width of the broad line is also estimated by accounting for the correlation with the other components.
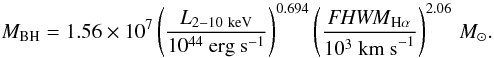
We cannot use the virial formula for the BH mass based on the HαFWHM and luminosity proposed by Greene & Ho (2005) since the Hα is likely absorbed, hence its intrinsic luminosity is difficult to measure. However, we can use both the virial formula for the BH mass involving the optical continuum luminosity λLλ(5100 Å) and FWHMHβ (Marconi et al., in prep.)
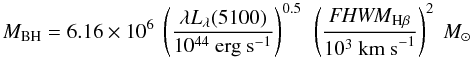
and the relation between L2 − 10 keV and λLλ(5100) (Eq. (5) in Maiolino et al. 2007b) to estimate the optical continuum, and replace FWHMHβ with FWHMHα by using the relation given in Greene & Ho (2005) (Eq. (3) therein). By replacing these relations in Eq. (1), we obtain
Since we know the absorption-corrected 2–10 keV luminosity of our three sources (Table 1), the width of the broad Hα inferred from our near-IR spectra allows us to infer the BH by exploiting Eq. (2). The inferred BH masses are reported in Table 1, and range between 1.3 × 10⁸ M⊙ and 2.8 × 10⁹ M⊙. The uncertainty in MBH is dominated by the dispersion in the MBH − σ,Lbul local relation (0.3 dex), which is used to calibrate the virial relations. The uncertainty in the L2 − 10 keV − L5100 relation coefficients also contributes with 0.07 dex (in quadrature), while the uncertainty in the width of the broad lines contributes significantly only in BPM1627#181 with 0.19 dex (in quadrature).
For consistency, we checked that the masses inferred by using the Hα luminosity and the relation proposed by Greene & Ho (2005) imply lower BH masses, confirming that Hα is absorbed. Similarly, the direct use of the relation in Eq. (1) involving Lλ(5100), by taking the observed optical (B rest-frame) continuum of our sources, deduces BH masses lower than those presented in Table 1, confirming that the AGN optical light is absorbed and that the observed rest-frame blue continuum is dominated by the host galaxy (as inferred from the SED fitting).
The BH masses measured by ourselves imply that these three obscured AGNs are accreting at a rate that is about 0.1 − 0.6 of their Eddington limit (Table 1).
The stellar masses were inferred by exploiting the multiwavelength photometric points available for these sources and the SED fitting code (Fritz et al. 2006) used in Pozzi et al. (2010) and Vignali et al. (2009) for a subsample of obscured AGN in the HELLAS2XMM sample. This code combines synthetic stellar libraries, AGN dusty torii models (Fritz et al. 2006) including the intrinsic AGN component (if visible), and starburst IR templates to reproduce the observed SED. We refer to Pozzi et al. (2010) for a detailed description of the method. Here we only emphasize that in the case of obscured AGNs, the rest-frame optical to near-IR radiation is generally dominated by the stellar light from the host galaxy and therefore constraining the stellar mass is easier than for the host galaxies of type 1 AGNs. The stellar masses inferred for the host galaxies of the three obscured quasars presented here are reported in Table 1. We note that to compare with the local relation, which is between the BH mass and the stellar mass of the spheroid, we would need to extract the spheroidal component of the stellar mass in our high-z targets. However, Mignoli et al. (2004) demonstrate that the class of targets in our sample is generally characterized by elliptical-like profiles, hence the bulk of the stellar light is associated with a massive spheroid.
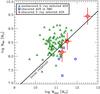 |
Fig. 2 MBH − Mstar relation for AGNs at z ~ 1–2. The red diamonds with errorbars show the location of the three X-ray selected obscured AGNs presented in this paper. Green triangles are type 1, X-ray selected unobscured AGNs in COSMOS from Merloni et al. (2010). Blue squares are obscured AGNs in SMGs from Alexander et al. (2008) with broad Hα and stellar masses from Hainline et al. (2010). The black line is the local relation obtained by Sani et al. (2010). |
The resulting location of the three X-ray selected, obscured AGNs at z ~ 1–2 is shown in Fig. 2 (red diamonds) along with the location of type 1, unobscured AGNs in the same redshift range from Merloni et al. (2010) (green triangles) and the obscured AGNs in SMGs at z ~ 2 (blue squares). For the SMG sample we plot only those AGNs with broad Balmer line detections (Alexander et al. 2008) and stellar masses available from Hainline et al. (2010). The solid line shows the local relation deduced by Sani et al. (2010). All of the X-ray selected obscured AGNs are fully consistent with the local MBH − Mstar relation and do not show any evidence of evolution, in contrast to both type 1, unobscured X-ray selected sample and the obscured AGNs selected among SMGs. For our obscured AGNs we find that ⟨ log (MBH/Mstar) ⟩ = − 3.06 ± 19, which is fully consistent with the local ratio log (MBH/Mstar)local = − 3.01 obtained by Sani et al. (2010) in a similar mass range.
4. Discussion
Our sample is small and does not allow us to draw firm conclusions from a statistical point of view. However, it is very intriguing that, in contrast to other high-z AGN samples, the three X-ray selected obscured AGNs do not show any systemic deviation from the local MBH − Mstar relation. If this trend were confirmed for a larger sample of X-ray selected obscured AGNs, it would have important implications for understand either biases affecting current studies or the evolution of the MBH/Mstar ratio during different evolutionary stages of galaxies.
The SMGs (both the subsample shown in Fig. 2 and the original sample in Alexander et al. (2008)) have a large scatter but tend, on average, to be below the local MBH − Mstar relation. The difference from our results might be caused by the bias discussed in the introduction, i.e. SMG AGN hosts are biased toward higher stellar masses because of the mass-SFR relationship and/or because of their higher dust content (hence more evolved hosts). Alternatively, the two samples may trace different evolutionary stages. According to many theoretical models, black hole accretion occurs predominantly in the phases of galaxy merging and interactions (which destabilize the gas, allowing it to flow towards the nucleus). Lamastra et al. (2010) suggest that SMGs may be objects where previous secular star formation has increased the stellar mass, while the lack of previous mergers and interactions has prevented the BH mass from growing significantly. This may explain their lower BH-to-stellar mass ratio. According to this scenario, SMGs are being observed during their first major-merging event. In contrast, X-ray selected, obscured AGNs (at least in our ERO subsample) may be the descendants of SMGs, observed at a later stage when, at the end of the whole interaction/merging phase, galaxies have already settled onto the local MBH/Mstar relation. Our targets have in general elliptical-like profiles (Mignoli et al. 2004) and an SED typical of quiescent galaxies (Pozzi et al. 2010), therefore supporting the latter scenario. However, we that a few objects in the parent sample have strong far-IR and submm emission indicative of vigorous star-forming activity (Vignali et al. 2009; Pozzi et al. 2010). In the specific case of our three targets, the optical to near-IR photometric points do not allow us to provide tight constraints on the SFR.
The differences between the location on the MBH − Mstar diagram of high-z X-ray selected obscured AGNs and X-ray selected unobscured AGNs is more puzzling. Except for our sample being obscured, our selection criteria do not differ significantly from the Merloni et al. (2010) sample (e.g. similar X-ray luminosity range), hence should not produce differential selection effects (in particular, our sample should also be unaffected by the Lauer et al. bias). However, we note that the distribution of unobscured AGNs has a large scatter. The two high-z obscured AGNs with low stellar masses (i.e. overlapping with the Merloni et al. sample in terms of stellar mass) may at least still be consistent with the tail of the distribution of unobscured AGNs in the same redshift range. Larger number statistics are required for the high-z obscured sample to clarify whether they are, on average, offset or consistent with the unobscured samples in terms of black hole-to-galaxy mass ratio. Were future observations to confirm the difference between unobscured and obscured (X-ray selected) AGNs, this may suggest that the two classes are associated with different evolutionary stages. The general expectation of models is that unobscured, type 1 AGNs represent a later evolutionary stage than to the obscured growth phase. However, the finding that unobscured AGN are offset from the local MBH − Mstar relation and are moving towards it (Merloni et al. 2010), while obscured AGN have already settled onto the local relation, suggests that the latter are in a later evolutionary stage. A possibility is that the obscured AGNs in our parent sample of EROs are in a late phase where the BH and their host galaxy have already reached the local MBH − Mstar relation, but are temporarily rejuvenated by a late accretion episode, making them detectable as quasars. In support of this scenario, we mention that our data reveal that more than 25% of the targets in our parent sample (and all of the sources presented here) are in close interaction with one or more galaxies located within a radius of ~15 kpc, which may be responsible for triggering BH accretion.
A larger sample of high-z obscured, X-ray selected AGNs with broad Hα (to infer the BH mass) is certainly required to confirm with higher statistical significance that this class of targets follow the local MBH − Mstar relation and that they differ from other high-z AGN samples, as well as to test the various possible scenarios discussed above.
Acknowledgments
We thank C. Feruglio for helping with an early analysis of the data. We thank A. Lamastra and D. Alexander for useful comments.
References
- Alexander, D. M., Brandt, W. N., Smail, I., et al. 2008, AJ, 135, 1968 [NASA ADS] [CrossRef] [Google Scholar]
- Campisi, M. A., Vignali, C., Brusa, M., et al. 2009, A&A, 501, 485 [NASA ADS] [CrossRef] [EDP Sciences] [Google Scholar]
- Cocchia, F., Fiore, F., Vignali, C., et al. 2007, A&A, 466, 31 [NASA ADS] [CrossRef] [EDP Sciences] [Google Scholar]
- Feruglio, C., Fiore, F., La Franca, F., et al. 2008, A&A, 488, 417 [NASA ADS] [CrossRef] [EDP Sciences] [Google Scholar]
- Ferrarese, L., & Merritt, D. 2000, ApJ, 539, L9 [NASA ADS] [CrossRef] [Google Scholar]
- Fiore, F., Brusa, M., Cocchia, F., et al. 2003, A&A, 409, 79 [NASA ADS] [CrossRef] [EDP Sciences] [Google Scholar]
- Fritz, J., Franceschini, A., & Hatziminaoglou, E. 2006, MNRAS, 366, 767 [Google Scholar]
- Greene, J. E., & Ho, L. C. 2005, ApJ, 630, 122 [NASA ADS] [CrossRef] [Google Scholar]
- Hainline, L. J., Blain, A. W., Smail, I., et al. 2010, MNRAS, submitted [arXiv:1006.0238] [Google Scholar]
- Hopkins, P. F., Hernquist, L., Cox, T. J., et al. 2006, ApJS, 163, 1 [Google Scholar]
- Jahnke, K., Bongiorno, A., Brusa, M., et al. 2009, ApJ, 706, L215 [NASA ADS] [CrossRef] [Google Scholar]
- Lamastra, A., Menci, N., Maiolino, R., Fiore, F., & Merloni, A. 2010, MNRAS, 405, 29 [NASA ADS] [Google Scholar]
- Lauer, T. R., Tremaine, S., Richstone, D., & Faber, S. M. 2007, ApJ, 670, 249 [NASA ADS] [CrossRef] [Google Scholar]
- Magorrian, J., Tremaine, S., Richstone, D., et al. 1998, AJ, 115, 2285 [NASA ADS] [CrossRef] [Google Scholar]
- Marconi, A., Risaliti, G., Gilli, R., Hunt, L. K., Maiolino, R., & Salvati, M. 2004, MNRAS, 351, 169 [NASA ADS] [CrossRef] [Google Scholar]
- Marulli, F., Bonoli, S., Branchini, E., Moscardini, L., Springel, V., et al. 2008, MNRAS, 385, 1846 [NASA ADS] [CrossRef] [Google Scholar]
- Maiolino, R., Mignoli, M., Pozzetti, L., et al. 2006, A&A, 445, 457 [NASA ADS] [CrossRef] [EDP Sciences] [Google Scholar]
- Maiolino, R., Neri, R., Beelen, A., et al. 2007a, A&A, 472, L33 [NASA ADS] [CrossRef] [EDP Sciences] [Google Scholar]
- Maiolino, R., Shemmer, O., Imanishi, M., et al. 2007b, A&A, 468, 979 [NASA ADS] [CrossRef] [EDP Sciences] [Google Scholar]
- Menci, N., Fontana, A., Giallongo, E., Grazian, A., Salimbeni, S., et al. 2006, ApJ, 647, 753 [NASA ADS] [CrossRef] [Google Scholar]
- Merloni, A., Bongiorno, A., Bolzonella, M., et al. 2010, ApJ, 708, 137 [NASA ADS] [CrossRef] [Google Scholar]
- Mignoli, M., Pozzetti, L., Comastri, A., et al. 2004, A&A, 418, 827 [NASA ADS] [CrossRef] [EDP Sciences] [Google Scholar]
- Peng, C. Y., Impey, C. D., Rix, H.-W., et al. 2006, ApJ, 649, 616 [Google Scholar]
- Pozzi, F., Vignali, C., Comastri, A., et al. 2007, A&A, 468, 603 [NASA ADS] [CrossRef] [EDP Sciences] [Google Scholar]
- Pozzi, F., Vignali, C., Comastri, A., et al. 2010, A&A, 517, A11 [NASA ADS] [CrossRef] [EDP Sciences] [Google Scholar]
- Sani, E., et al. 2010, MNRAS, submitted [Google Scholar]
- Santini, P., Maiolino, R., Magnelli, B., et al. 2010, A&A, 518, L154 [NASA ADS] [CrossRef] [EDP Sciences] [Google Scholar]
- Shen, Y., Hall, P. B., Richards, G. T., et al. 2010, A Catalogue of Quasars Properties from SDSS DR7 [arXiv:1006.5178] [Google Scholar]
- Vestergaard, M., & Osmer, P. S. 2009, ApJ, 699, 800 [Google Scholar]
- Vignali, C., Pozzi, F., Fritz, J., et al. 2009, MNRAS, 395, 2189 [NASA ADS] [CrossRef] [Google Scholar]
- Volonteri, M., & Natarajan, P. 2009, MNRAS, 400, 1911 [NASA ADS] [CrossRef] [Google Scholar]
- Walter, F., Carilli, C., Bertoldi, F., et al. 2004, ApJ, 615, L17 [CrossRef] [Google Scholar]
- Wang, R., Carilli, C. L., Neri, R., et al. 2010, ApJ, 714, 699 [NASA ADS] [CrossRef] [Google Scholar]
All Tables
All Figures
|
Fig. 1 Near-IR spectra (zoomed around Hα) of the three X-ray selected obscured AGNs with evidence for a broad component of Hα. The red line shows the fit resulting from a combination of a broad Hα Gaussian component (blue line), narrow Gaussian components of Hα, [NII] and, in the case of Abell2690#29, [SII] (green lines) and a linear continuum. The bottom panels show the sky spectrum in arbitrary units. |
| In the text | |
|
Fig. 2 MBH − Mstar relation for AGNs at z ~ 1–2. The red diamonds with errorbars show the location of the three X-ray selected obscured AGNs presented in this paper. Green triangles are type 1, X-ray selected unobscured AGNs in COSMOS from Merloni et al. (2010). Blue squares are obscured AGNs in SMGs from Alexander et al. (2008) with broad Hα and stellar masses from Hainline et al. (2010). The black line is the local relation obtained by Sani et al. (2010). |
| In the text | |
Current usage metrics show cumulative count of Article Views (full-text article views including HTML views, PDF and ePub downloads, according to the available data) and Abstracts Views on Vision4Press platform.
Data correspond to usage on the plateform after 2015. The current usage metrics is available 48-96 hours after online publication and is updated daily on week days.
Initial download of the metrics may take a while.