Fig. 2
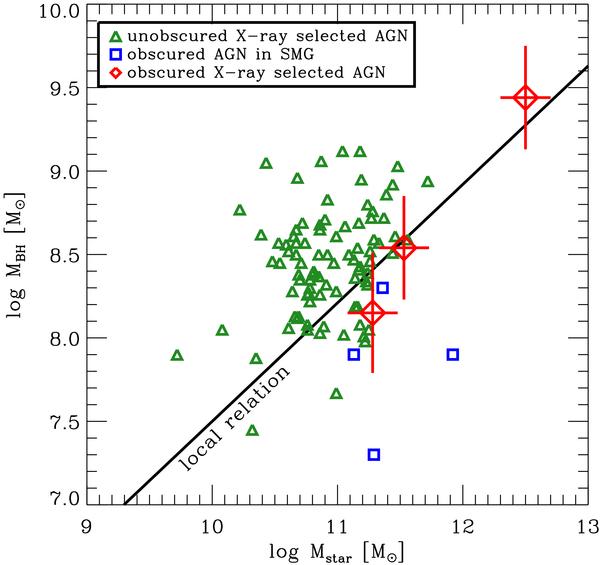
MBH − Mstar relation for AGNs at z ~ 1–2. The red diamonds with errorbars show the location of the three X-ray selected obscured AGNs presented in this paper. Green triangles are type 1, X-ray selected unobscured AGNs in COSMOS from Merloni et al. (2010). Blue squares are obscured AGNs in SMGs from Alexander et al. (2008) with broad Hα and stellar masses from Hainline et al. (2010). The black line is the local relation obtained by Sani et al. (2010).
Current usage metrics show cumulative count of Article Views (full-text article views including HTML views, PDF and ePub downloads, according to the available data) and Abstracts Views on Vision4Press platform.
Data correspond to usage on the plateform after 2015. The current usage metrics is available 48-96 hours after online publication and is updated daily on week days.
Initial download of the metrics may take a while.