Free Access
Fig. 6
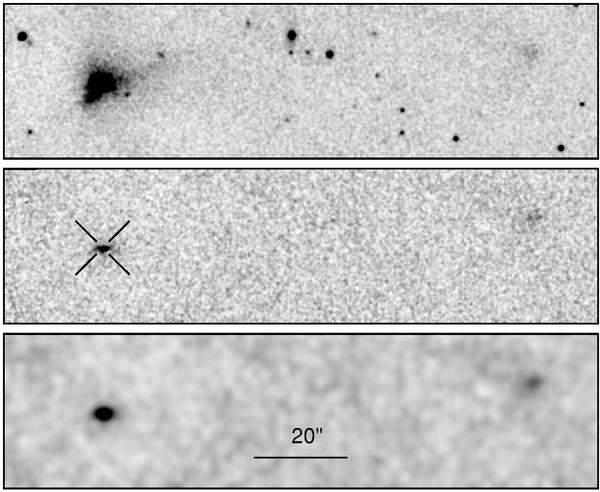
H2 emission in the CG1 head. The upper panel shows an extract of the image obtained with the SOFI NB H2 S1 filter. The centre panel shows the difference NB H2 S1 – NB 2.090. The cross shows the position of the YSO in the Ks image. The lowest panel shows the difference image smoothed with a three-pixel half-width Gaussian.
Current usage metrics show cumulative count of Article Views (full-text article views including HTML views, PDF and ePub downloads, according to the available data) and Abstracts Views on Vision4Press platform.
Data correspond to usage on the plateform after 2015. The current usage metrics is available 48-96 hours after online publication and is updated daily on week days.
Initial download of the metrics may take a while.