Fig. 5
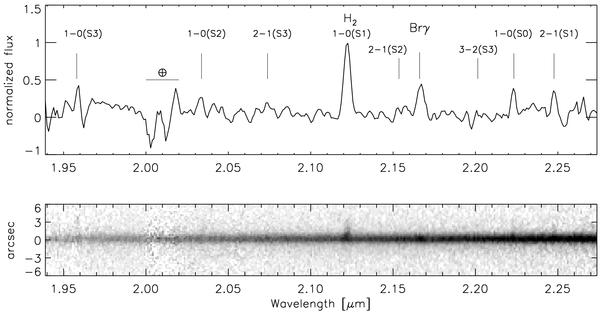
Part of the SOFI spectrum over the YSO and its associated nebulosity in both two dimensional and extracted format. Lower panel: 12″ centre part of the low-resolution long-slit spectrum through the YSO and the YSO SE_filament. Upper panel: extracted continuum-subtracted spectrum convolved with a 3-pixel box-car. The wavelengths of the H2 lines within the displayed spectral region and of the Brγ line are indicated. The spectrum has been normalized for an (1–0) S(1) intensity of unity.The horizontal bar at 2.01 μm indicates the extent of the strong atmospheric absorption between the H and Ks bands.
Current usage metrics show cumulative count of Article Views (full-text article views including HTML views, PDF and ePub downloads, according to the available data) and Abstracts Views on Vision4Press platform.
Data correspond to usage on the plateform after 2015. The current usage metrics is available 48-96 hours after online publication and is updated daily on week days.
Initial download of the metrics may take a while.