Fig. B.2
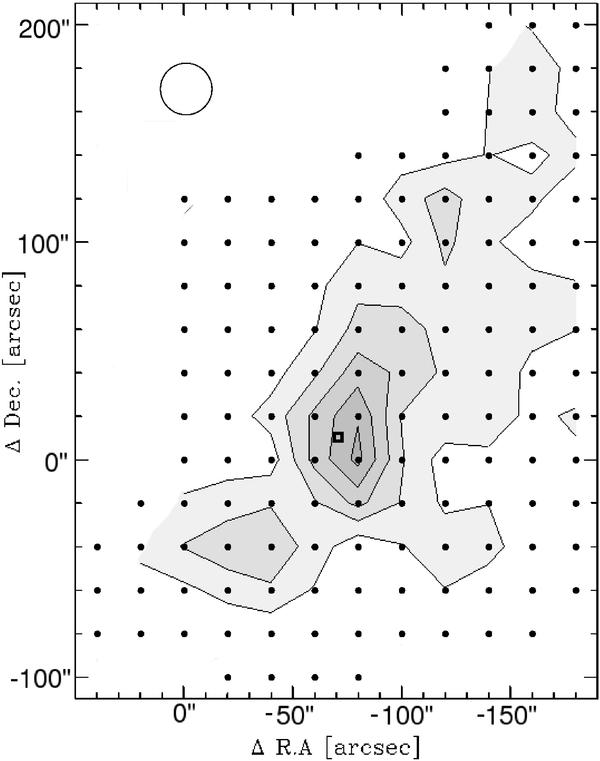
Contour map of the integrated C18O(2–1) emission in CG 1 head in TMB scale. The contour levels are from 0.4 K km s-1 to 2.0 K km s-1 in steps of 0.4 K km s-1. The points indicate the measured points and the square the location of the YSO in the figure. The SEST HPBW at the C18O(2–1) frequency is shown in the upper left corner.
Current usage metrics show cumulative count of Article Views (full-text article views including HTML views, PDF and ePub downloads, according to the available data) and Abstracts Views on Vision4Press platform.
Data correspond to usage on the plateform after 2015. The current usage metrics is available 48-96 hours after online publication and is updated daily on week days.
Initial download of the metrics may take a while.