Fig. 12
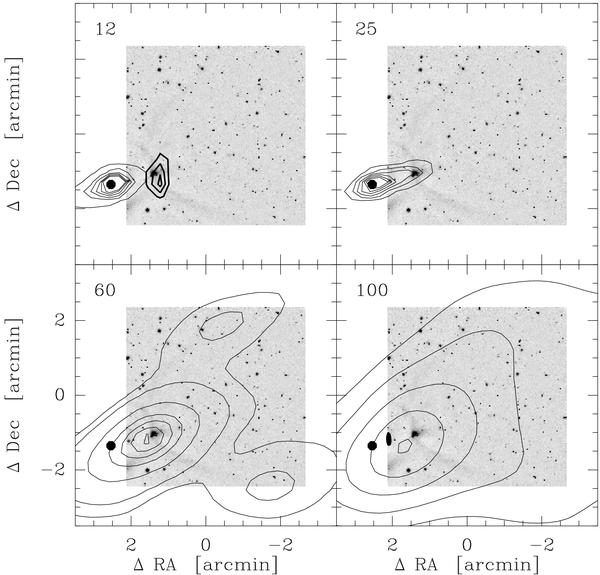
Contour maps of the HIRES processed IRAS maps superimposed on the SOFI Ks band image. The IRAS wavelength is shown in microns in the upper right corner of each panel. The position of the star NX Pup is marked with a filled circle. The IRAS 07178–4429 point source positional uncertainty is shown as an filled ellipse west of NX Pup in the 100 μm panel. The C18O(2–1) integrated emission contours (indicated by thick lines, 1.2 K km s-1 to 2.0 K km s-1 in steps of 0.4 K km s-1) are superimposed on the 12 μm panel. The offset is in arcminutes from the centre of the SOFI image. The contour levels in MJy sr-1 are: 12 μm 5 to 30 by 5; 25 μm 15 to 115 by 20; 60 μm 3, 5, 15 to 91 by 19; and 100 μm 7, 16, 31 to 71 by 20.
Current usage metrics show cumulative count of Article Views (full-text article views including HTML views, PDF and ePub downloads, according to the available data) and Abstracts Views on Vision4Press platform.
Data correspond to usage on the plateform after 2015. The current usage metrics is available 48-96 hours after online publication and is updated daily on week days.
Initial download of the metrics may take a while.