Fig. 11
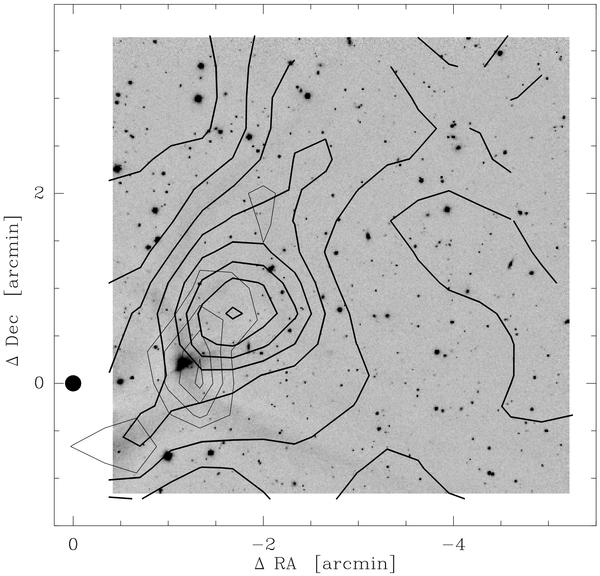
Contour map of the optical extinction (thick lines) obtained with the NICER method overlaid on the Ks SOFI image. Contour levels are from 2 mag to 9 mag in steps of 1 mag.Contours of the C18O(2–1) integrated emission (0.8 K km s-1 to 2.4 K km s-1 in steps of 0.4 K km s-1) are shown with thin lines. The positional offsets are as in Fig. 9.
Current usage metrics show cumulative count of Article Views (full-text article views including HTML views, PDF and ePub downloads, according to the available data) and Abstracts Views on Vision4Press platform.
Data correspond to usage on the plateform after 2015. The current usage metrics is available 48-96 hours after online publication and is updated daily on week days.
Initial download of the metrics may take a while.