Free Access
Fig. 10
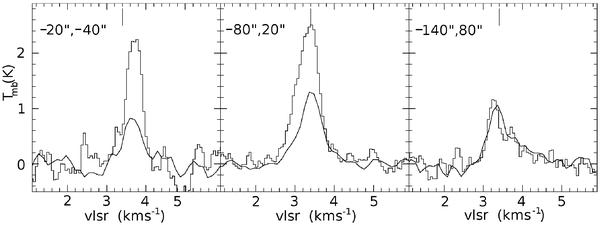
C18O(2–1) (histogram) and (1–0) (line) spectra in three positions. The offset from the map centre is indicated in the upper left corner of each plot. The velocity marker at the top of each panel is at velocity 3.4 km s-1.
Current usage metrics show cumulative count of Article Views (full-text article views including HTML views, PDF and ePub downloads, according to the available data) and Abstracts Views on Vision4Press platform.
Data correspond to usage on the plateform after 2015. The current usage metrics is available 48-96 hours after online publication and is updated daily on week days.
Initial download of the metrics may take a while.