Fig. 2
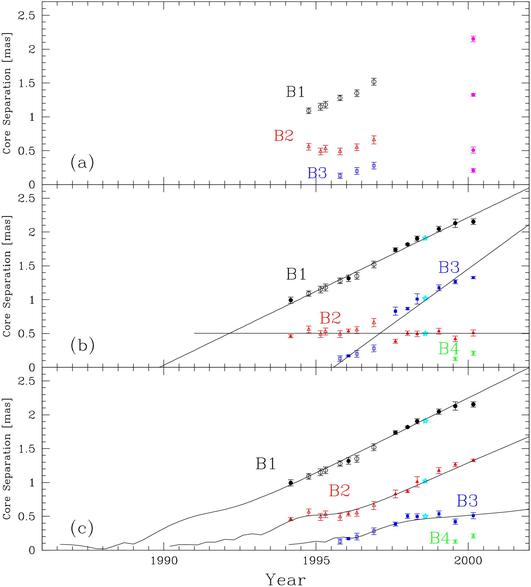
Core separation as a function of time for the individual jet component. The data combined are from the Jorstad et al. (2001) (open symbols), archive data, and our observation (solid symbols). Stars show the components from the VSOP observations by Lister et al. (2001). The first panel plots the proper motion with Jorstad et al. (2001) and our own observation (purple pentagon). The second shows a simple linear proper motion to fit the evolution track of components of 14 epochs. The last one displays a simple helical fit to the evolution track of components depending on a different classification of the components.
Current usage metrics show cumulative count of Article Views (full-text article views including HTML views, PDF and ePub downloads, according to the available data) and Abstracts Views on Vision4Press platform.
Data correspond to usage on the plateform after 2015. The current usage metrics is available 48-96 hours after online publication and is updated daily on week days.
Initial download of the metrics may take a while.