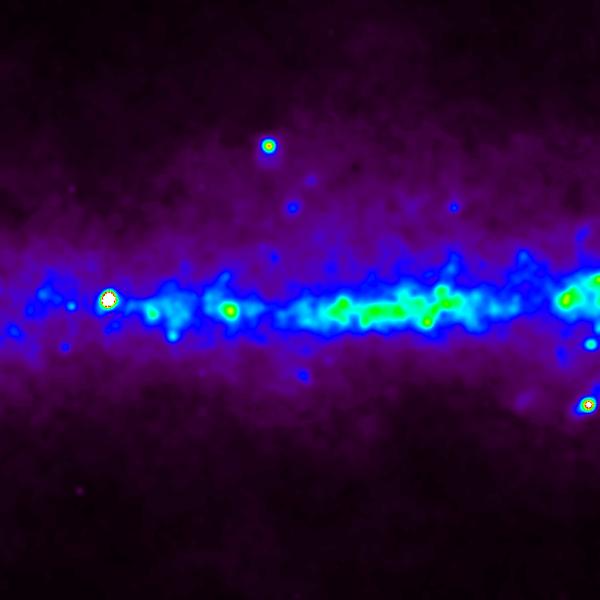
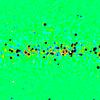
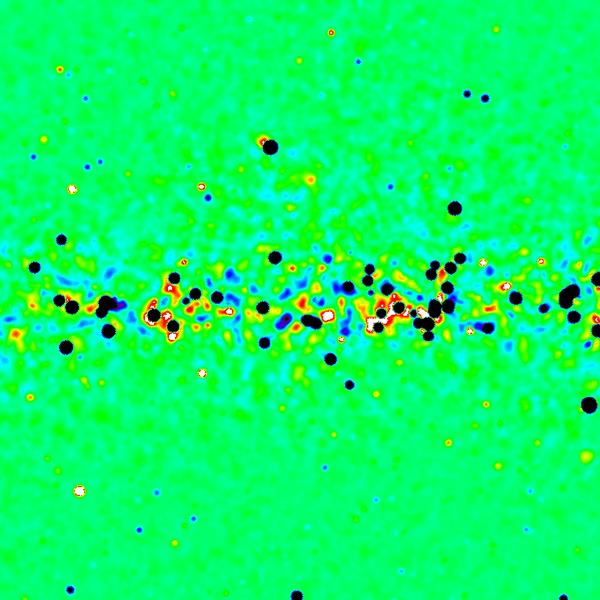
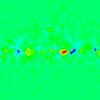
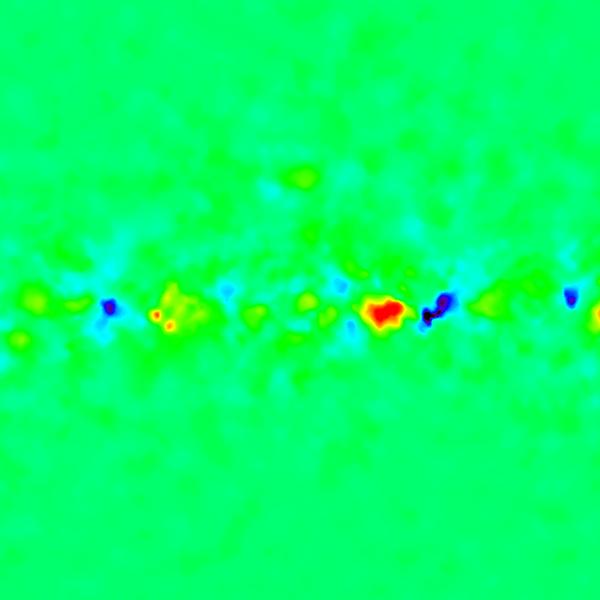
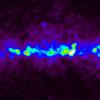
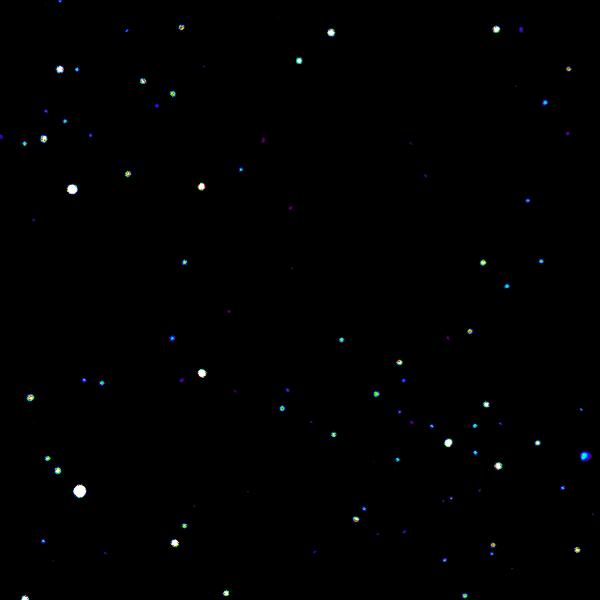
Fig. 8
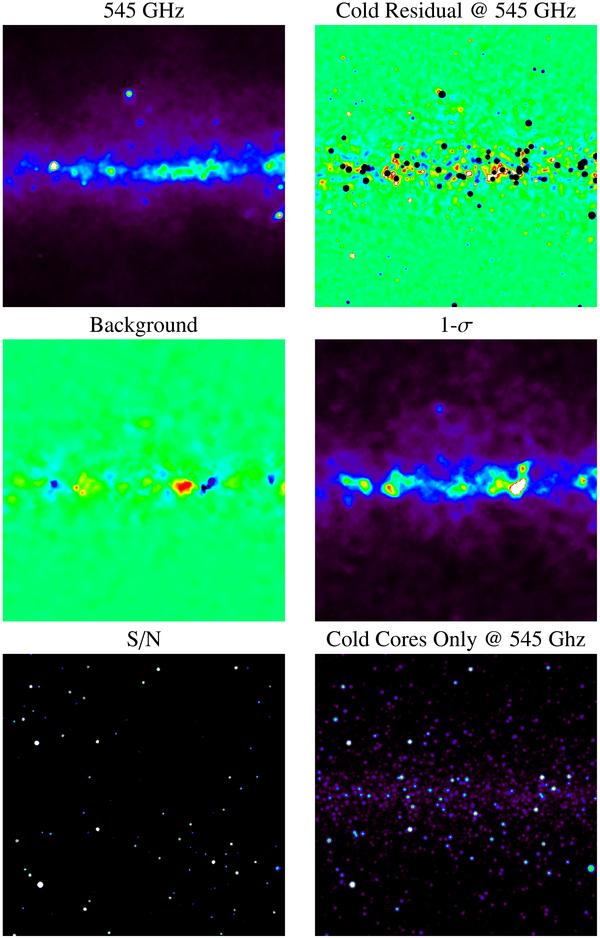
Illustration of the warm background subtraction detection processing on a Galactic patch of 10° × 10° centered on ( − 40°, 0°). The upper left map is the original 545 GHz map, from 0 to 500 MJy/sr. In the right upper panel is the cold residual at 545 GHz after subtraction of the warm component extrapolated from the 2997 GHz. From the cold residual map are then computed the background and 1-σ maps, respectively left and right middle panels, plotted from − 5 MJy/sr to 5 MJy/sr. The signal-to-noise map S/N is given in the lower left panel, plotted in the range 4 to 10. The simulated cold cores only map is shown at 545 GHz in the lower right panel, with a colour scale ranging from 0 to 5 MJy/sr. We observe a good agreement between detections and real positions of cold cores.

 Background
1-σ
Background
1-σ
 S/N
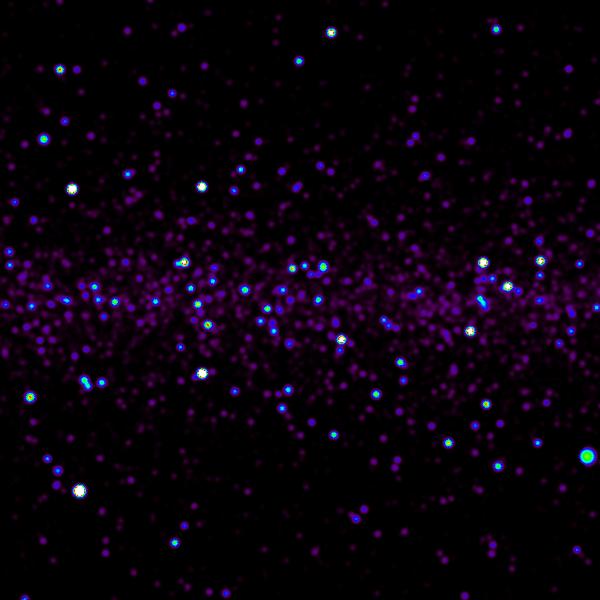
Cold Cores Only @ 545 Ghz
S/N
Cold Cores Only @ 545 Ghz


Current usage metrics show cumulative count of Article Views (full-text article views including HTML views, PDF and ePub downloads, according to the available data) and Abstracts Views on Vision4Press platform.
Data correspond to usage on the plateform after 2015. The current usage metrics is available 48-96 hours after online publication and is updated daily on week days.
Initial download of the metrics may take a while.