Free Access
Fig. 7
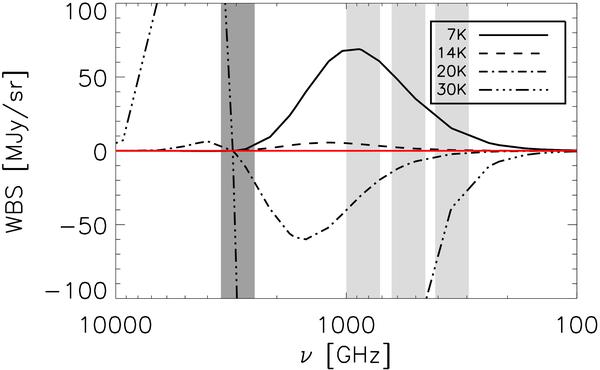
Same as Fig. 5, in the case of the WBS input maps. The warm spectrum extrapolated from the 2997 GHz has been removed, so that cold sources (7K and 14K) appear positive with respect to the background (red line) while the warmer sources are negative.
Current usage metrics show cumulative count of Article Views (full-text article views including HTML views, PDF and ePub downloads, according to the available data) and Abstracts Views on Vision4Press platform.
Data correspond to usage on the plateform after 2015. The current usage metrics is available 48-96 hours after online publication and is updated daily on week days.
Initial download of the metrics may take a while.