Fig. 5
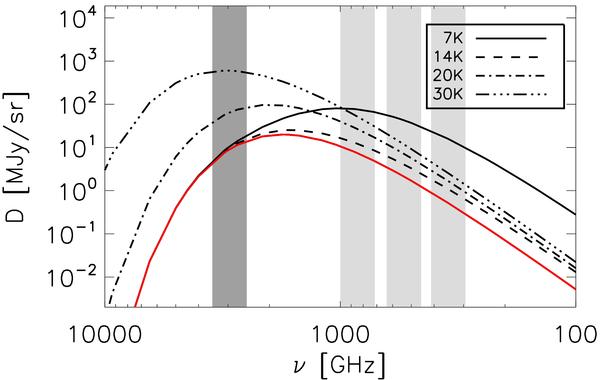
Illustration of the Direct method. The vertical dark grey band is the 2997 GHz IRAS band, and the 3 clear-grey bands are the 3 Planck-HFI bands (857 GHz, 545 GHz and 353 GHz). The red line represents the spectrum of the warm background cirrus, on which is added the spectrum of point sources at various temperatures: 7K, 14K, 20K and 30K. In the Direct method, the detection is performed at each frequency separately, and the method deals with all types of sources above the background level.
Current usage metrics show cumulative count of Article Views (full-text article views including HTML views, PDF and ePub downloads, according to the available data) and Abstracts Views on Vision4Press platform.
Data correspond to usage on the plateform after 2015. The current usage metrics is available 48-96 hours after online publication and is updated daily on week days.
Initial download of the metrics may take a while.