Fig. 3
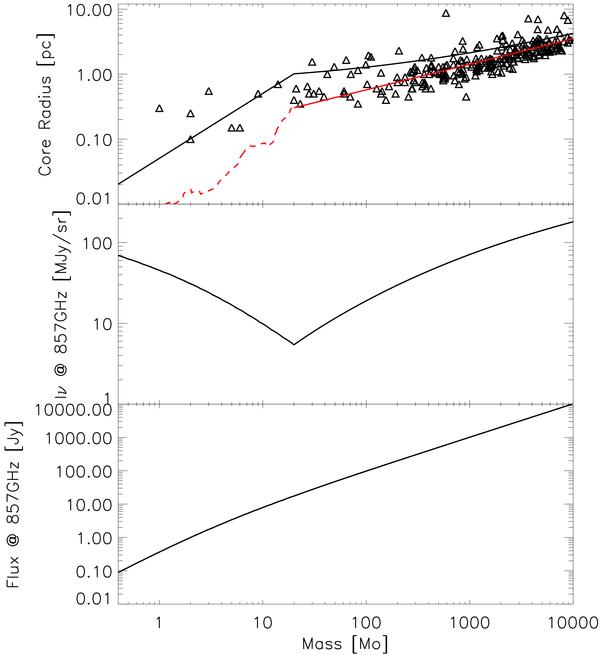
Continuity between medium size and high mass models. Top: core radius as a function of the mass, following the Simon et al. (2006b) catalogue distribution (triangles) for high masses. The red line gives the core size model adopted for high masses, when the dash red line is an estimate of the cold inner core for small masses. The black full line stands for the sum of inner core and envelope radius. Middle: associated surface brightness at 857 GHz averaged over the cold core surface including the envelope. Bottom: flux integrated over the core plus the envelope placed at a typical distance of 1 kpc.
Current usage metrics show cumulative count of Article Views (full-text article views including HTML views, PDF and ePub downloads, according to the available data) and Abstracts Views on Vision4Press platform.
Data correspond to usage on the plateform after 2015. The current usage metrics is available 48-96 hours after online publication and is updated daily on week days.
Initial download of the metrics may take a while.