Fig. 12
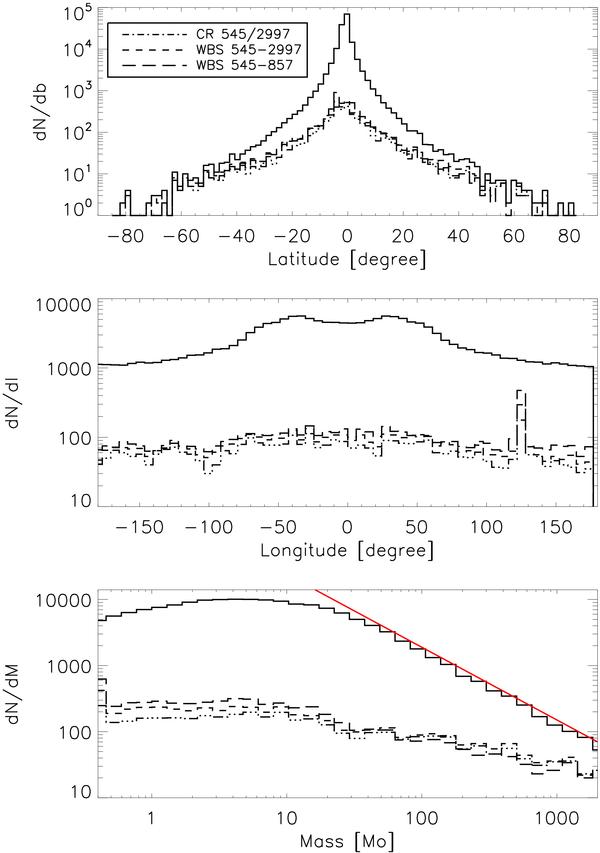
Catalogue distribution in latitude (top), longitude (middle) and mass (bottom). The distribution of the input simulated catalogue is plotted as a solid line. The statistics of the output detection catalogue is given for the 3 best methods: CR 545/2997 (dot dot dot dash), WBS 545-2997 (dash) and WBS 545-857 (long dash). The red line in the bottom panel indicates the input power law of the mass distribution with an index α = 2.1.
Current usage metrics show cumulative count of Article Views (full-text article views including HTML views, PDF and ePub downloads, according to the available data) and Abstracts Views on Vision4Press platform.
Data correspond to usage on the plateform after 2015. The current usage metrics is available 48-96 hours after online publication and is updated daily on week days.
Initial download of the metrics may take a while.