Free Access
Fig. 4
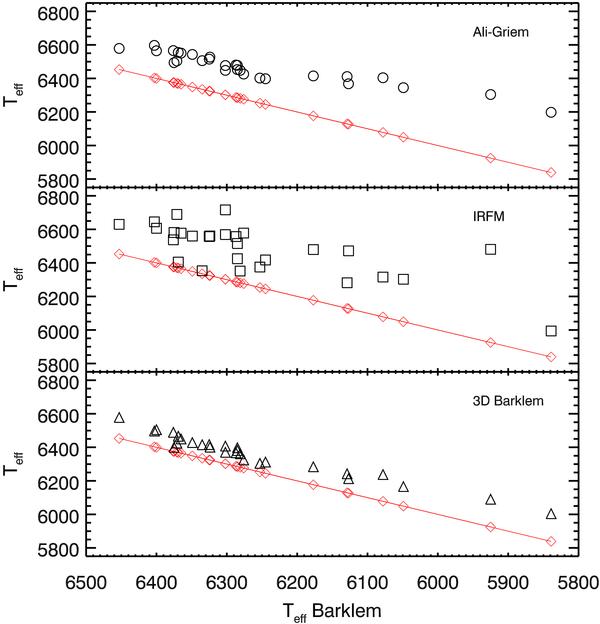
Effective temperatures for different estimators, plotted against BA temperature for the program stars. Top to bottom: ALI, IRFM and 3D temperatures. The red line represents the one-to-one relation (hence the line of BA temperatures).
Current usage metrics show cumulative count of Article Views (full-text article views including HTML views, PDF and ePub downloads, according to the available data) and Abstracts Views on Vision4Press platform.
Data correspond to usage on the plateform after 2015. The current usage metrics is available 48-96 hours after online publication and is updated daily on week days.
Initial download of the metrics may take a while.