Fig. 3
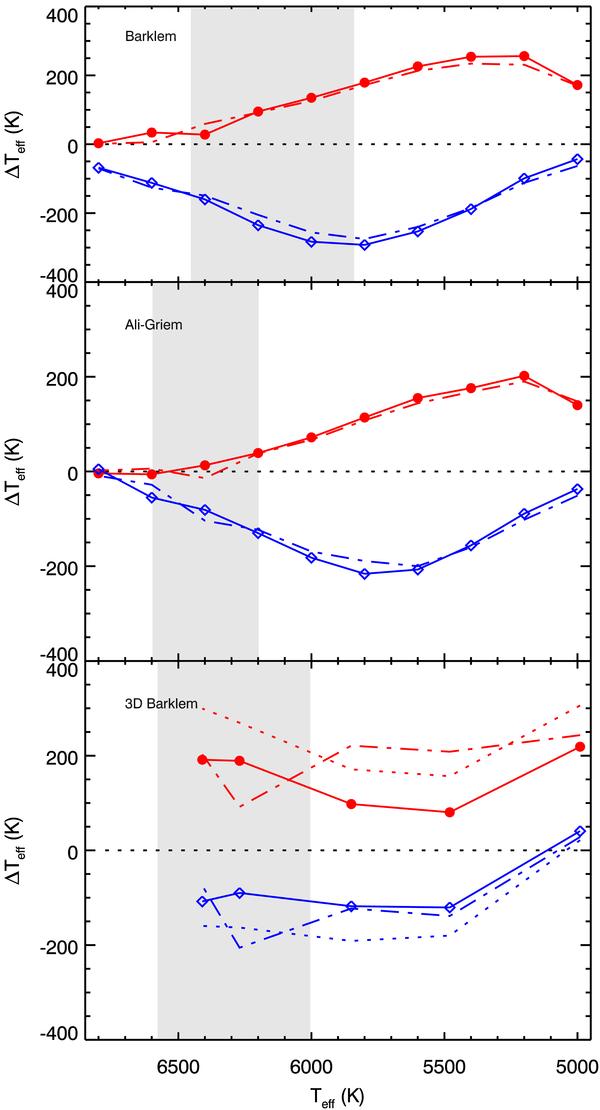
Hα theoretical profiles for models with log g = 4, [Fe/H] = −3 (solid lines) and log g = 4, [Fe/H] = −2.5 (dot-dashed lines) have been fitted with the same procedure used for the program stars, but using a log g = 3.5 grid (red lines with filled circles) and a log g = 4.5 grid (blue lines with open diamonds). Here we plot the temperature difference (Teff(log g = 3.5/4.5) – Teff(log g = 4.0)), against the “real” effective temperature of the profile. The upper panel shows BA profiles, the middle panel ALI profiles, and lower panel 3D profiles. The gray shaded areas indicates the temperature ranges for the program stars in each Teff scale.
Current usage metrics show cumulative count of Article Views (full-text article views including HTML views, PDF and ePub downloads, according to the available data) and Abstracts Views on Vision4Press platform.
Data correspond to usage on the plateform after 2015. The current usage metrics is available 48-96 hours after online publication and is updated daily on week days.
Initial download of the metrics may take a while.