Fig. 7
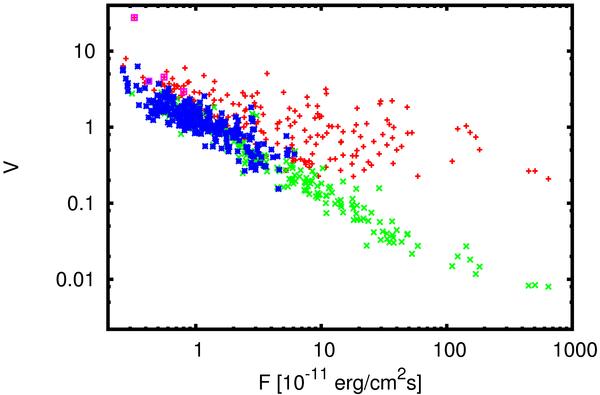
Fractional variability (V) versus flux (F) for all significantly variable sources (red crosses) from Table 3. Energy band is 20–40 keV. For comparison, the green crosses show the fractional variability detection threshold (3-σ) versus flux for all reference catalog sources detected in the significance map. The sources not detected at the variability map are indicated by blue stars and are coincident with their green cross counterparts. Pink squares indicate 3-σ lower limits to the fractional variability of the sources that are not detected in the significance map.
Current usage metrics show cumulative count of Article Views (full-text article views including HTML views, PDF and ePub downloads, according to the available data) and Abstracts Views on Vision4Press platform.
Data correspond to usage on the plateform after 2015. The current usage metrics is available 48-96 hours after online publication and is updated daily on week days.
Initial download of the metrics may take a while.