| Issue |
A&A
Volume 520, September-October 2010
|
|
|---|---|---|
| Article Number | A73 | |
| Number of page(s) | 11 | |
| Section | Stellar structure and evolution | |
| DOI | https://doi.org/10.1051/0004-6361/201014096 | |
| Published online | 05 October 2010 | |
V945 Centauri =
HD 112409: a bright
hot short-period binary in a triple system?![[*]](/icons/foot_motif.png) ,
,
P. Harmanec1
- C. Aerts2,3 - A. Prsa4,5
- T. Verhoelst2,![]() - K. Kolenberg2,6
- K. Kolenberg2,6
1 - Astronomical Institute of the Charles University, Faculty of
Mathematics and Physics, V Holesovickách 2, 180 00 Praha 8,
Czech Republic
2 - Instituut voor Sterrenkunde, Katholieke Universiteit Leuven,
Celestijnenlaan 200 D, 3001 Leuven, Belgium
3 - Department of Astrophysics, IMAPP, Radboud University Nijmegen, PO
Box 9010, 6500 GL Nijmegen, The Netherlands
4 - Villanova University, Dept. of Astronomy &
Astrophysics, 800 Lancaster Ave, Villanova, PA 19085, USA
5 - University of Ljubljana, Dept. of Physics, Jadranska 19,
1000 Ljubljana, Slovenia
6 - Institut für Astronomie, Universität Wien, Türkenschanzstrasse 17,
1180 Wien, Austria
Received 19 January 2010 / Accepted 24 May 2010
Abstract
A detailed analysis of multicolour Geneva photometry and
high-resolution echelle spectroscopy of the B8.5V star V945 Cen
(HD 112409,
![]() )
whose short-term periodic variability was first detected
from the HIPPARCOS data, led to the finding that the object is
an ellipsoidal variable and a close double-lined spectroscopic
binary with a 0
)
whose short-term periodic variability was first detected
from the HIPPARCOS data, led to the finding that the object is
an ellipsoidal variable and a close double-lined spectroscopic
binary with a 0
![]() 6496 orbital period and a
circular orbit.
The components have spectral types B7 and B8.5 and
are both main-sequence objects. The system is detached but close
to a contact configuration and is observed at an inclination of
6496 orbital period and a
circular orbit.
The components have spectral types B7 and B8.5 and
are both main-sequence objects. The system is detached but close
to a contact configuration and is observed at an inclination of
![]() 23-24
23-24![]() .
A notable finding is that the optical spectrum
also contains a third system of spectral lines corresponding to a late
B
spectral type that remained stationary during the 5 days of spectral
observations. From several independent lines of reasoning, we
tentatively
conclude that the third spectrum belongs to a real third body in the
system.
However, the possibility that it instead originates in circumbinary gas
cannot
be excluded completely, and additional spectral and interferometric
observations are required to help us determine its origin conclusively.
.
A notable finding is that the optical spectrum
also contains a third system of spectral lines corresponding to a late
B
spectral type that remained stationary during the 5 days of spectral
observations. From several independent lines of reasoning, we
tentatively
conclude that the third spectrum belongs to a real third body in the
system.
However, the possibility that it instead originates in circumbinary gas
cannot
be excluded completely, and additional spectral and interferometric
observations are required to help us determine its origin conclusively.
Key words: binaries: close - stars: variables: general - stars: individual: V945 Cen = HD 112409
1 Introduction
The success of the ESA HIPPARCOS mission led, among other things, to
discoveries of many new variables (Kazarovets et al. 1999;
Eyer
& Grenon 1997).
Waelkens et al. (1998)
attempted to classify the periodically variable B stars among
them. The star V945 Cen (HD 112409), a bright (
![]() )
B8.5V variable with a
period of some 8 h is on their list. This short-period light
variability
may be caused by several phenomena: (1) by a non-radial gravity mode as
in the slowly pulsating B stars (De
Cat & Aerts 2002); (2) by rotational
modulation in chemically peculiar B stars (Briquet
et al. 2004); (3) by duplicity
of the star in question (De Cat
et al. 2000); or (4) by a combination of
several of the first three possibilities. Waelkens et al.
(1998) tentatively
classified V945 Cen as a slowly pulsating B star.
)
B8.5V variable with a
period of some 8 h is on their list. This short-period light
variability
may be caused by several phenomena: (1) by a non-radial gravity mode as
in the slowly pulsating B stars (De
Cat & Aerts 2002); (2) by rotational
modulation in chemically peculiar B stars (Briquet
et al. 2004); (3) by duplicity
of the star in question (De Cat
et al. 2000); or (4) by a combination of
several of the first three possibilities. Waelkens et al.
(1998) tentatively
classified V945 Cen as a slowly pulsating B star.
|
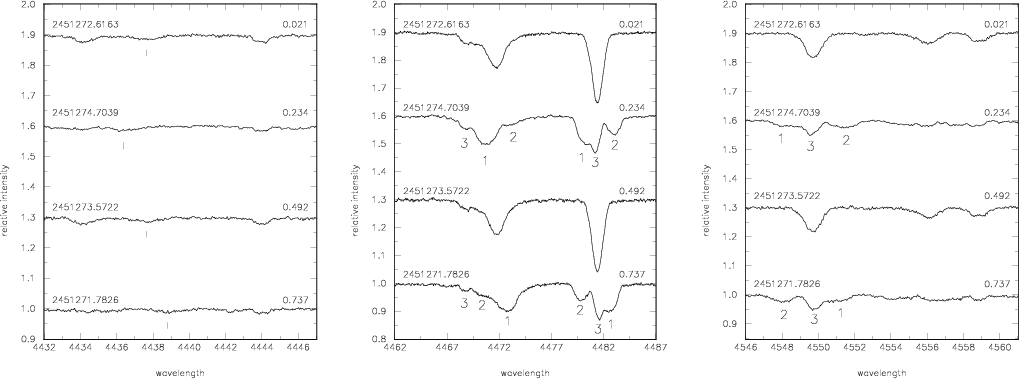
Figure 1: Four segments of the spectra containing some interesting spectral lines. Heliocentric Julian dates and orbital phases of the spectra are given in each panel. For clarity, the continua of subsequent spectra are shifted by 0.3 units in normalized intensity. The left panel shows the region near the He I 4437.551 Å line (the position of which is shown by a bar), the central panel shows the neighbourhood of He I 4471.508 Å and Mg II 4481.228 Å, and the right one shows the Fe II 4549 Å line. It is obvious that the observed spectrum is actually a combination of three different spectra, identified as components 1, 2, and 3 for the spectra taken at both elongations of the 0.65-d binary. Note, however, that the line of component 3 to the left of the He I 4471.508 Å line is Ti II 4468.507 Å. See the text for details. |
| Open with DEXTER | |
Aerts et al. (1999) and Mathias et al. (2001) carried out extended long-term photometric and spectroscopic follow-up studies of the new candidates for slowly pulsating B stars including V945 Cen. Since the spectroscopic monitoring was carried out mainly in a region centered on the Si II 4128 nad 4130 Å doublet, their preference was to study mainly the stars with low v sin i values, for which this doublet is not blended. Therefore, V945 Cen was not initially spectroscopically observed because of its rather large v sin i = 164 km s-1 (Brown & Verschueren 1997). However, since this star was one of very few additional B8-9 IV-V candidates to enlarge the group of slowly pulsating B stars, a separate spectroscopic 5-day campaign was carried out by the Leuven team to search for possible line-profile variations in three of these stars, using échelle spectra which covered a wide range of wavelengths. The results for HD 121190 and HD 106419 have already been published elsewhere (Aerts & Kolenberg 2005) and indeed confirmed the classification of these two objects as pulsating stars. For V945 Cen, however, clear evidence of ellipsoidal variations in a double-lined close binary with an orbital period of some 16 h was found.
We present the results of a detailed study of this newly discovered bright binary. Its B spectral type and short orbital period make V945 Cen an astrophysically very interesting system. The binary has not yet been the topic of a detailed study, its very short orbital period qualifying it as a candidate for a case A mass exchange. However, in contrast to other such systems discussed in the literature, this object is not an eclipsing binary. One therefore has a unique chance to compare the observed properties of the binary seen more pole-on with its counterparts observed roughly equator-on.
2 Observational data
2.1
Multicolour Geneva and Hipparcos H photometry
We refer readers to Aerts & Kolenberg (2005) for a general description of the photometric monitoring programme at Leuven University in which V945 Cen was included.
We obtained Geneva 7-colour high-precision photometry of V945 Cen during one campaign of 3-week duration and one campaign of 9 weeks within one season. The data were obtained with the photometer P 7 attached to the 0.7 m Swiss telescope situated at La Silla Observatory. Each datapoint is the result of averaging three consecutive exposures of 40 s. The corrections for the sky were carried out by observing at least two standard stars per hour at the same airmass as the target. The Geneva database consists of thousands of measurements gathered at La Silla between 1973 and 1997, which underwent a very accurate global calibration by means of all standard star measurements taken over 25 years. The system is so stable that data taken decades apart can easily be combined (see, e.g., De Cat & Aerts 2002; and Aerts et al. 2003a, for examples). These global reductions lead to a precision of about 5 mmag per measurement for V945 Cen. We obtained 160 observations over a time span of 121 days. We also had 5 very old Geneva observations secured some 20 years earlier. These observations are fully compatible with the new ones, therefore we also used them in the analysis. All individual observations with their HJDs are in Table 1, published electronically in CDS.
Additionally, we also used all HIPPARCOS ![]() broad-band photometric
observations with error flags 0 and 1 (Perryman
& ESA 1997).
To the best of our knowledge, there are no other published photometric
observations of this object with known mid-exposure times.
broad-band photometric
observations with error flags 0 and 1 (Perryman
& ESA 1997).
To the best of our knowledge, there are no other published photometric
observations of this object with known mid-exposure times.
2.2 High-resolution spectroscopy
A series of high-S/N spectra was obtained with the FEROS échelle spectrograph attached to the ESO 2.2 m telescope. The data were secured during 5 consecutive nights 2 years after the photometric campaigns. Integration times 8-15 min were used, depending on the atmospheric conditions. This resulted in S/N of 300-600 in the blue region of the spectrum. All spectra were reduced with standard routines available in the ESO software package MIDAS. They included tasks to deal with sky background subtraction, flatfielding, and wavelength calibration using Th-Ar spectra. The final rectification and removal of cosmics and flaws was carried out independently by CA in MIDAS and by PH in SPEFO (Horn et al. 1996; Skoda 1996). The original spectra are now freely available in the FEROS archive maintained by ESO.
We searched for strong enough, isolated lines free of line
blending caused by
rapid rotation. This is the case for the Mg II 4481.129 Å
and the
Si II 6347.109 Å lines.
We also considered the C II doublet at
6578.053 and 6582.882 Å. However, these C II
lines were found to be
unusable for a detailed line-profile analysis because of their very
limited
strength and blending. No emission is seen in the H![]() line, though
faint emission may escape detection because of the complicated
line profile with three overlapping absorption components. Given the
spectral classification, we also searched for the He I
lines. Rather
surprisingly, one observes not only strong lines such as the
He I 4471.473 Å line and
He I 6678.151 Å line,
but also the weak He I 4437.551 Å
line, which is usually only
observed in chemically peculiar He strong stars.
line, though
faint emission may escape detection because of the complicated
line profile with three overlapping absorption components. Given the
spectral classification, we also searched for the He I
lines. Rather
surprisingly, one observes not only strong lines such as the
He I 4471.473 Å line and
He I 6678.151 Å line,
but also the weak He I 4437.551 Å
line, which is usually only
observed in chemically peculiar He strong stars.
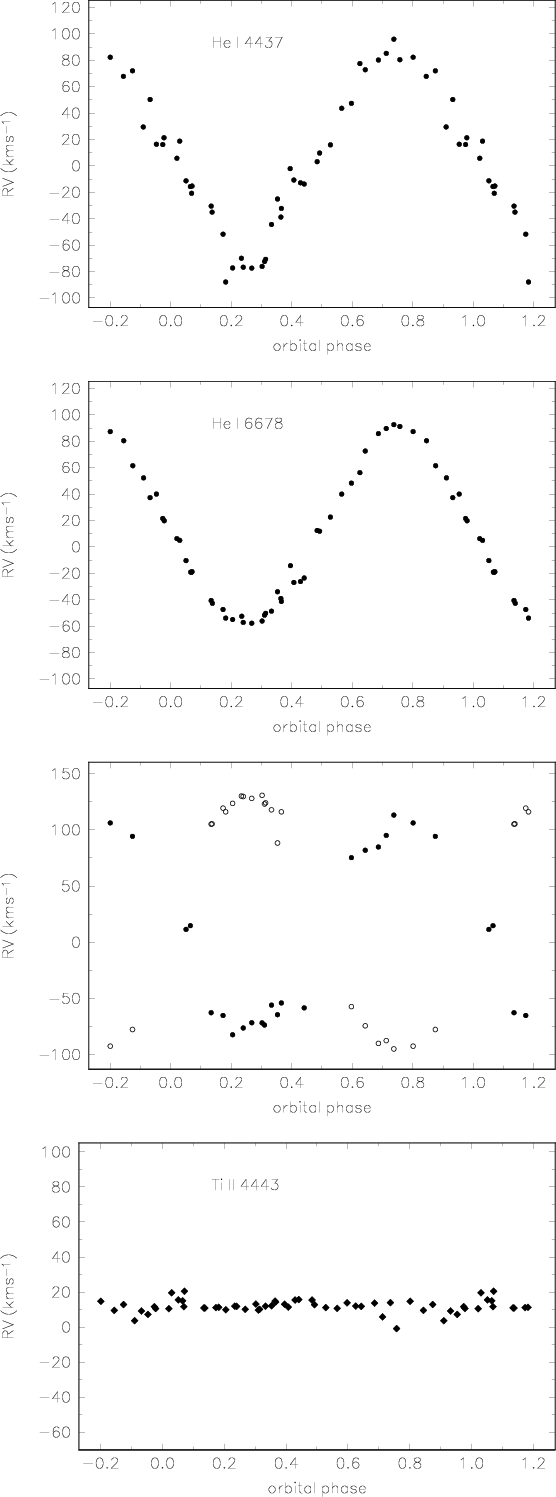
In Fig. 1, interesting segments of four selected blue spectra from both conjunctions and elongations of the binary are shown. One can clearly see three separate line components at certain orbital phases and only one deep line, a blend of all components, at other phases in the Mg II 4481 Å and Fe II 4549 Å lines. It is also seen that components 1 and 2 interchange their position as the stars move in the binary orbit, while component 3 appears stationary over the five days of our observations. The Balmer, Fe II, and Si II lines contain obvious contributions from all three components, while the He I 4437 and 6678 Å seem to be observable only as single lines. We will discuss the radial-velocity (RV hereafter) variations of all three components (which we denote 1, 2, and 3 in some panels of Fig. 1) in the following section.
A journal of all the new photometric and spectroscopic data is provided in Table 2.
Table 1: Journal of photometric and spectroscopic observations.
|
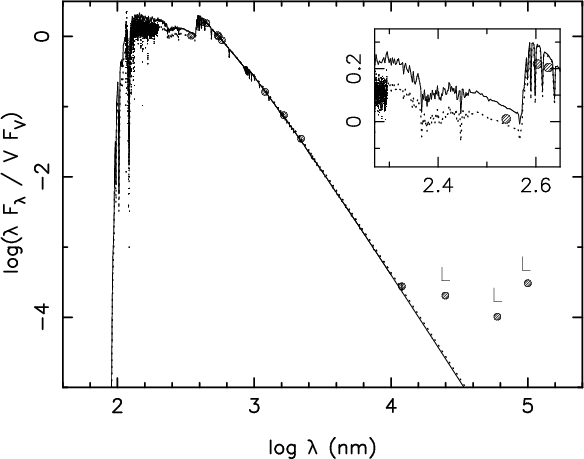
Figure 2:
The observed spectral energy distribution of V945 Cen (circles
denoting
the measurements in various passbands plus a plot of the IUE spectrum)
is
compared to that from a Kurucz model atmosphere for |
| Open with DEXTER | |
2.3 The spectral energy distribution
As in the case of many bright B-type objects (Waters et al.
1987), V945 Cen is
an IRAS source. The IRAS satellite only measured reliable infrared flux
at
12 ![]() m,
while the values detected at 25, 60, and 100
m,
while the values detected at 25, 60, and 100 ![]() m are
only upper limits. The IUE archive contains one
high-dispersion
spectrum of V945 Cen obtained with a large aperture,
SWP 27531 from January 1986.
m are
only upper limits. The IUE archive contains one
high-dispersion
spectrum of V945 Cen obtained with a large aperture,
SWP 27531 from January 1986.
We constructed a spectral energy distribution (SED) from our
Geneva data, the
2MASS catalogue, and the IRAS and IUE fluxes, applying a proper colour
correction. This observed distribution was
subsequently compared with Kurucz
atmosphere models (Kurucz 1979).
At first, we compared the
data with an LTE atmosphere for ![]() K
and
K
and ![]() .
This
model is shown as a full line in Fig. 2.
.
This
model is shown as a full line in Fig. 2.
Since three line components were discovered in the spectrum, we also constructed an SED by combining three atmosphere models and using their relative flux ratios obtained from our final modeling (see Table 6). This combined SED, shown by a dotted line in Fig. 2, is in closer agreement with the observed one.
The absence of any detectable infrared excess at 12 ![]() m means that
we
cannot be dealing with dust formation. The absence of any
detectable Balmer emission in the observed spectra also implies that
a circumbinary envelope is probably not the source of the third
spectrum.
We therefore tentatively conclude that the third line
spectrum originates from a real third body in the system.
m means that
we
cannot be dealing with dust formation. The absence of any
detectable Balmer emission in the observed spectra also implies that
a circumbinary envelope is probably not the source of the third
spectrum.
We therefore tentatively conclude that the third line
spectrum originates from a real third body in the system.
2.4 NAOS-CONICA observations
On 27 January 2005, V945 Cen was observed with the adaptive
optics instrument
NAOS-CONICA on the VLT (Rousset et al. 2003; Lenzen
et al. 2003).
The observations were performed with the ![]() band filter
(
band filter
(
![]() m)
and a 27.053 milli-arcsec (mas) pixel
scale, yielding a total field-of-view of
m)
and a 27.053 milli-arcsec (mas) pixel
scale, yielding a total field-of-view of ![]() arcseconds
(
arcseconds
(
![]() pixels).
pixels).
The images display only a single object, to intensities lower than 0.1% of the peak flux, within a 14 arcsec radius. This object appears unresolved with a FWHM of roughly 95 mas, which is similar to the PSF observations. Regrettably, these observations provided no direct evidence of a third body in the system.
3 The character and period of the variations
3.1 Photometry
The photometric data clearly exhibit a dominant frequency of
3.0796 c d-1 (P=0
![]() 32472),
which is entirely compatible with,
but differs slightly from the result found from the HIPPARCOS
photometry
(3.07882 c d-1; P=0
32472),
which is entirely compatible with,
but differs slightly from the result found from the HIPPARCOS
photometry
(3.07882 c d-1; P=0
![]() 324800).
A very significant peak also occurs
at a half of this frequency, which is the next maximum to be found in
the periodograms after prewhitening in each of the datasets. This
result
is independent of the frequency search algorithm adopted and
is consistent for all the seven Geneva filters and the HIPPARCOS data.
We
therefore interpret the detected dominant frequency as a half of the
physical
frequency controlling the variations. An analysis of RV data (see the
next
section) confirmed this and indicated that the star is indeed an
ellipsoidal
variable and a spectroscopic binary. The deeper and slightly shallower
minima
of all the light curves are separated by exactly one half of the
orbital
period, which is indicative of a circular orbit. This is unsurprising
for such a short period.
324800).
A very significant peak also occurs
at a half of this frequency, which is the next maximum to be found in
the periodograms after prewhitening in each of the datasets. This
result
is independent of the frequency search algorithm adopted and
is consistent for all the seven Geneva filters and the HIPPARCOS data.
We
therefore interpret the detected dominant frequency as a half of the
physical
frequency controlling the variations. An analysis of RV data (see the
next
section) confirmed this and indicated that the star is indeed an
ellipsoidal
variable and a spectroscopic binary. The deeper and slightly shallower
minima
of all the light curves are separated by exactly one half of the
orbital
period, which is indicative of a circular orbit. This is unsurprising
for such a short period.
All additional tests led to the conclusion that all
photometric data can be
reconciled with a single period of about 0
![]() 64960.
Within the limits of accuracy of the available observations, there is
no
evidence of a secular change in the period.
From the final modelling discussed in Sect. 4, we derived
the following binary ephemeris
64960.
Within the limits of accuracy of the available observations, there is
no
evidence of a secular change in the period.
From the final modelling discussed in Sect. 4, we derived
the following binary ephemeris
We show the phase plots for both the Geneva V magnitude and the Hipparcos
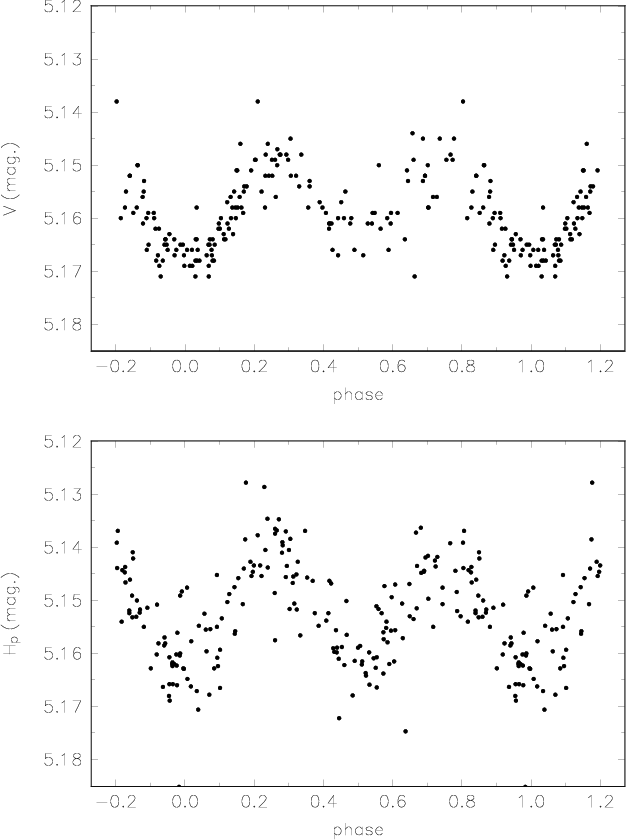
|
Figure 3:
A phase plot for the Geneva V ( upper panel)
and
Hipparcos |
| Open with DEXTER | |
3.2 Spectroscopy
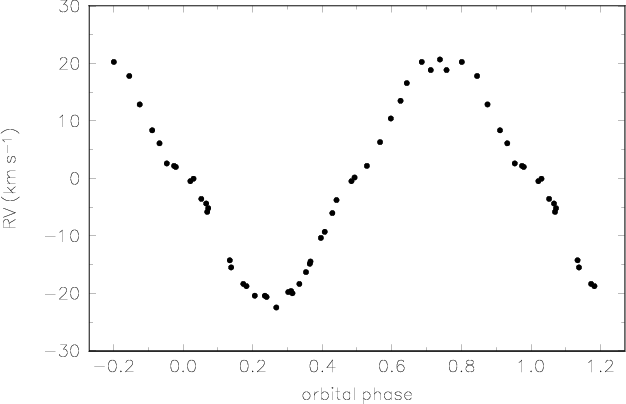
To understand the origin of the three line components 1, 2, and 3 seen in Fig. 1, we first measured their RVs in a classical way using SPEFO. SPEFO displays direct and reverse traces of the line profiles superimposed on the computer screen that the user can slide to achieve a precise overlapping of the chosen parts of the profile. We tried to measure several clean, unblended lines but we had to skip some spectra near the binary conjunctions where the line profiles from the primary and secondary were blended.
From these classical RV measurements (plotted versus orbital phase in Fig. 4), it became obvious that component 1 follows the RV curve of the star, which is in the upper (superior) conjunction at the primary minimum of the light curve, while component 2 moves in orbit with the other star. From now on, we refer to these two stars as the primary and the secondary, respectively.
|
Figure 4: RV curves of all three components identified in the spectra as measured in SPEFO. The two upper panels show the RV curves of the weak He I 4437 Å line and a stronger He I 6678 Å line, which are both only seen for component 1; the third panel from the top shows the RVs derived from the Fe II 4549 Å line for components 1 and 2, and the bottom panel shows the RVs of the Ti II 4443 Å line of component 3. The RVs of components 1, 2, and 3 (see Fig. 1) are denoted by black dots, open circles, and diamonds, respectively. |
| Open with DEXTER | |
|
Figure 5:
An apparent orbital variation in the RV of the H |
| Open with DEXTER | |
The RV of component 3, first measured for a few strong lines,
also seemed to
vary in phase with the primary but with a much lower semi-amplitude of
a few
km s-1 only. However, it was then
unclear whether this was a spurious
effect caused by line blending. This suspicion was increased by our
SPEFO measurement of the RV of the sharp H![]() core (see Fig. 5).
It appears that the RV of the H
core (see Fig. 5).
It appears that the RV of the H![]() core varies in phase with
component 1 but also with a reduced amplitude. Moreover, an
oscillation with
a resonant period of one third of the orbital one is detected.
We demonstrate in the Appendix that this H
core varies in phase with
component 1 but also with a reduced amplitude. Moreover, an
oscillation with
a resonant period of one third of the orbital one is detected.
We demonstrate in the Appendix that this H![]() variation is spurious.
Since both binary components have H
variation is spurious.
Since both binary components have H![]() profiles with sharp cores and
broad wings, they inevitably blend with the stationary
sharp component 3 as they move in orbit around each other.
This, together
with the relative intensity variations explains the artifact.
Indeed, when we measured the RV of the Ti II 4443.794 Å
line,
its RV was found to be constant within the limits
of the accuracy of
its measurement (
profiles with sharp cores and
broad wings, they inevitably blend with the stationary
sharp component 3 as they move in orbit around each other.
This, together
with the relative intensity variations explains the artifact.
Indeed, when we measured the RV of the Ti II 4443.794 Å
line,
its RV was found to be constant within the limits
of the accuracy of
its measurement (
![]() km s-1)
and to show no obvious phase dependence on
the orbital phase (see the bottom panel of Fig. 4).
Since the effect of the line blending in the H
km s-1)
and to show no obvious phase dependence on
the orbital phase (see the bottom panel of Fig. 4).
Since the effect of the line blending in the H![]() line is interesting
and our finding represents a methodological warning, we discuss it in
detail
in the Appendix, using a simulation with synthetic spectra.
line is interesting
and our finding represents a methodological warning, we discuss it in
detail
in the Appendix, using a simulation with synthetic spectra.
Table 2: Exploratory orbital solutions obtained with FOTEL for a circular orbit.
In Table 3, we present a few exploratory orbital solutions based on RVs measured with SPEFO and derived with the program FOTEL (Hadrava 2004a,1990). We note that the epoch of the upper conjunction agrees with that expected from photometry.
We conclude that there are three possible origins of component 3:
- 1.
- circumbinary gas around the close binary;
- 2.
- circumstellar gas expelled by one of the components;
- 3.
- a third component in a triple system.
3.3 Spectra disentangling
It is clear that the complicated shape of the line profiles of the binary makes it difficult to derive accurate RV curves in a classical way. We therefore decided to derive the orbital elements and disentangle individual component spectra using the program KOREL developed by Hadrava (1995,2004b,1997), in particular the latest publicly available version dated December 2, 2004.
The preparation of data for the program KOREL deserves a few
comments.
The electronic spectra at our disposal were recorded with
a pixel-to-pixel separation of some 1.9 km s-1
in the blue, and
about 1.3 km s-1 in the red
parts of the echelle spectra.
Considering this, we therefore rebinned
the spectra into equidistant steps in RV, choosing the RV step of
1 km s-1 for all spectra not
to lose resolution. The rebinning was carried out
with the help of the HEC35D program written by PH![]() .
In comparison to a similar data preparation program PREKOR by Dr. P.
Hadrava,
distributed with KOREL, HEC35D allows the user to choose the initial and
final wavelength and operates on spectra of virtually any length.
Like PREKOR, HEC35D derives consecutive discrete wavelengths given by
.
In comparison to a similar data preparation program PREKOR by Dr. P.
Hadrava,
distributed with KOREL, HEC35D allows the user to choose the initial and
final wavelength and operates on spectra of virtually any length.
Like PREKOR, HEC35D derives consecutive discrete wavelengths given by
where
To take the variable quality of individual spectra into
account, we
measured their S/N in the
line-free regions and
assigned each spectrum a weight given by
where
We briefly recall that KOREL uses the observed spectra and derives both the orbital elements and the mean individual line profiles of up to five stars. These stars may form a hierarchical system of two mutually orbiting binaries and a distant, also gravitationally bounded fifth star. To be able to disentangle also component 3 present in the line profiles of V945 Cen, we run KOREL formally on the assumption that - besides a binary - there is another distant component (No. 5 in Hadrava's hierarchical system), which has the same orbital period as the binary and a negligible semi-amplitude of the orbital motion around the common centre of gravity with the binary. In particular, we set K3 = 0.001 km s-1. This approach is suitable for both the case that the third system of lines belong to a distant third component, and the case that there is a circumstellar envelope around the whole system. We note that our spectra cover an interval of only four days so that the lines of the putative third component would appear stationary over such a short time anyway.
Since V945 Cen is an ellipsoidal variable, we allowed for variable strengths of the spectral lines in individual spectra during the solutions (cf. Hadrava 1997).
Our experience with KOREL is that the result is sensitive to the choice of starting values of the elements and initial values of the simplex steps. This is understandable because the sum of squares of residuals using all data points of individual spectra is very complicated and it is easy to end up in a local minimum. This was clearly illustrated in an excellent study of DW Car by Southworth & Clausen (2007, see their Fig. 3).
To cope with the problem, we first investigated the variation in the sum of squares as a function of the semi-amplitude of the primary only, keeping all other elements fixed at values we derived from the FOTEL solution of the photometry and preliminary analyses of the spectra at both elongations. In all of these trial solutions, all three spectra were disentangled. We first derived a solution for the constant strength of the lines and then, in the same run, we allowed the line strengths to vary.
![\begin{figure}
\par\includegraphics[width=8.8cm,clip]{14096f6a.eps}\vspace*{-1.3...
...}
\includegraphics[width=8.8cm,clip]{14096f6d.eps}\vspace*{-1.3mm}\end{figure}](/articles/aa/full_html/2010/12/aa14096-10/img53.png)
|
Figure 6: The sum of squares of residuals of exploratory KOREL solutions as a function of the semi-amplitude of the primary, K1, derived separately for the four indicated spectral lines. See the text for details. |
| Open with DEXTER | |

|
Figure 7: The sum of squares of residuals of exploratory KOREL solutions as a function of the mass ratio K1/K2derived separately for the Mg II 4481 Å, Si II 6347 Å, and Fe II 4549 Å. See the text for details. |
| Open with DEXTER | |
The plot of the sum of squares of residuals as a function of the
semi-amplitude K1 is shown
in Fig. 6,
separately for the following four stronger lines:
Mg II 4481 Å line, Fe II 4549 Å
line,
Si II 6347 Å line, and He
I 6678 Å line.
The He I 4471 Å line is
not suitable since it has an almost
stationary Ti II 4468 Å
line in its blue wing. The H![]() line
was also found to be too complex and was not disentangled.
One can see that there are indeed several local minima and the range
of plausible values of K1
varies from one line to another.
It is especially instructive for the neighbourhood of the
He I 6678 Å line, where
any lines from the secondary and the third
spectrum are very weak or simply missing. In the end KOREL finds
more or less flat continua for the components 2 and 3 but from time to
time
it suddenly jumps to another, actually deeper minimum. Nevertheless,
our
direct measurements in SPEFO indicate a semi-amplitude of about
73 km s-1.
After inspecting the results for all four lines, we carried out another
series
of runs to find plausible limits for the mass ratio K1/K2,
this time
keeping K1 fixed at
73.5 km s-1.
line
was also found to be too complex and was not disentangled.
One can see that there are indeed several local minima and the range
of plausible values of K1
varies from one line to another.
It is especially instructive for the neighbourhood of the
He I 6678 Å line, where
any lines from the secondary and the third
spectrum are very weak or simply missing. In the end KOREL finds
more or less flat continua for the components 2 and 3 but from time to
time
it suddenly jumps to another, actually deeper minimum. Nevertheless,
our
direct measurements in SPEFO indicate a semi-amplitude of about
73 km s-1.
After inspecting the results for all four lines, we carried out another
series
of runs to find plausible limits for the mass ratio K1/K2,
this time
keeping K1 fixed at
73.5 km s-1.
This search was only carried out for the Mg II 4481 Å line, Fe II 4549 Å line, and Si II 6347 Å line since there is no detectable He I 6678 Å line of the secondary. The results of this search are again shown graphically, in Fig. 7. One can again note the different sensitivities of the different lines to the mass ratio but it seems that K1/K2 = 0.70 reproduces all three lines well.
Fixing the mass ratio, we carried out the final round of trial KOREL solutions, checking whether the third system of lines is stationary or exhibits some periodic RV changes with the binary orbital period. By increasing the value of K3 from zero to positive values, we always found a higher sum of residuals. We therefore conclude that the RV of the third system of spectral lines was constant over the period of our observations. This can be interpreted in two possible ways. Either the third spectrum represents a real third star, bounded or unbounded to the ellipsoidal binary, or it is a shell spectrum from some kind of envelope around the whole system.
In the final step of our analysis, we derived another
set of trial KOREL solutions for the four considered lines and now
also for the spectra covering the region containing the
He I 4437 Å and
He I 4471 Å lines, this
time
also allowing for the convergency of K1
and the mass ratio (the latter
with the exception of the He I 6678 Å
line, of course).
We slightly varied the initial values of the elements from their
mean values used after the first runs, and also varied the initial
steps.
For each line, we then adopted the solution with the smallest sum
of residuals. The resulting elements from these solutions are
summarized
in Table 4.
Since KOREL does not provide error estimates for
the elements, the inspection of Table 4 provides some idea
of the uncertainties in the elements. We also imported the
disentangled blue spectra of components 1 and 2 into SPEFO and derived
the mean systemic velocities from the RV measurements of 9 He I
and metallic lines. The results are ![]() km s-1
and
km s-1
and
![]() km s-1.
They represent the best estimate of the true
systemic velocity of the binary and the excellent mutual agreement
of both values shows the quality of the final disentangling.
km s-1.
They represent the best estimate of the true
systemic velocity of the binary and the excellent mutual agreement
of both values shows the quality of the final disentangling.
Our ultimate goal is to derive a simultaneous solution combining photometry and spectroscopy and using the program PHOEBE. It is true that KOREL also derives individual radial velocities for individual disentangled spectral components but the accuracy of these RVs depends on the quality of individual spectra. It is easy to verify that if an orbital solution is derived from these RVs (for instance, using the program FOTEL), the result differs from the orbital elements derived by KOREL. To constrain PHOEBE to adopt the KOREL orbital elements, we therefore proceeded in a somewhat unusual way. For each individual KOREL solution of Table 4, we derived the model-predicted RVs from KOREL for the HJDs of our 44 spectral observations. We then averaged these RVs from four wavelength segments for each individual spectrum and these average RVs were subsequently used in PHOEBE.
Table 3: Circular-orbit solutions derived with KOREL for several short spectral regions near stronger spectral lines.
4 Spectrophotometric modeling
To model the light and RV data simultaneously we used
PHOEBE 0.32 (Prsa & Zwitter
2005), a modeling suite based on the Wilson-Devinney
program (Wilson & Devinney 1971).
We paid attention to ensuring consistency
with SEDs, so that all gravity darkening effects caused by shape
distortion
follow the Von Zeipel law for radiative envelopes and the limb
darkening
coefficients are interpolated from the tables. That means that
the ratio ![]() is the only unknown.
Specific passband intensities and limb darkening
coefficients were computed for the Geneva passbands from
Castelli & Kurucz (2004)'s
NEWODF models spanning from 3500 K to
50 000 K
across the entire H-R diagram. The SED functions were synthetized with
SPECTRUM 2.75
is the only unknown.
Specific passband intensities and limb darkening
coefficients were computed for the Geneva passbands from
Castelli & Kurucz (2004)'s
NEWODF models spanning from 3500 K to
50 000 K
across the entire H-R diagram. The SED functions were synthetized with
SPECTRUM 2.75![]() (Gray & Corbally 1994)
at a
(Gray & Corbally 1994)
at a ![]() dispersion, from 3000
dispersion, from 3000 ![]() to
10 000
to
10 000 ![]() .
The limb darkening tables were computed by
synthetizing SEDs in 20 values of
.
The limb darkening tables were computed by
synthetizing SEDs in 20 values of ![]() from the center of
the disk to the limb, and fitting the linear cosine law and non-linear
log
and square root laws by least squares. The computed auxiliary tables
are
added to the default PHOEBE distribution and are freely available from
the PHOEBE homepage.
from the center of
the disk to the limb, and fitting the linear cosine law and non-linear
log
and square root laws by least squares. The computed auxiliary tables
are
added to the default PHOEBE distribution and are freely available from
the PHOEBE homepage.
To obtain an independent estimate of the effective
temperatures of
individual components, we used PHOEBE's color-constraining technique
(Prsa & Zwitter 2006).
The Cramer & Maeder (1979)
parameters X and Y were
computed for each observed photometric observation; they were used
to obtain a reddening-free effective temperature and effective gravity
of the object. Their values are depicted in Fig. 8; there is
a slight phase dependence present in parameter X,
which is expected
because of its dependence on ![]() that changes due to ellipsoidal variation. The values obtained in this
manner are
that changes due to ellipsoidal variation. The values obtained in this
manner are ![]() and
and ![]() .
Color constraining yields the estimates of individual temperatures to
be
.
Color constraining yields the estimates of individual temperatures to
be ![]() K
and
K
and ![]() ,
in close agreement with spectroscopic determination. Hence we suggest
the spectral types of the primary and secondary to be B7 and B8.5,
respectively.
,
in close agreement with spectroscopic determination. Hence we suggest
the spectral types of the primary and secondary to be B7 and B8.5,
respectively.
![\begin{figure}
\par\mbox{\includegraphics[width=8.5cm]{14096f8a.eps}\includegraphics[width=8.5cm]{14096f8b.eps} }\end{figure}](/articles/aa/full_html/2010/12/aa14096-10/img67.png)
|
Figure 8:
Left: Cramer
& Maeder (1979) parameters X
(dots)
and Y (crosses) of observed data points as a
function of phase.
There is a slight phase dependence present in parameter X,
which is expected
due to its dependence on |
| Open with DEXTER | |
Spectroscopic observations of V945 Cen provided RV curves for both
components,
allowing us to accurately derive the mass ratio q,
the projected
semi-major axis ![]() ,
and systemic velocity
,
and systemic velocity ![]() .
These values,
listed in Table 5,
were determined by passing the solution
iteratively between KOREL and PHOEBE, and validated by Gaussian fits
to spectral lines in SPEFO. The cross-correlation method based on
two templates, as implemented in TODCOR (Zucker
& Mazeh 1994), provided a fully
consistent fit for the primary RV, but failed to properly extract the
secondary
RV, because of the presence of the third system of spectral lines.
Once these parameters were determined from the RV modelling, we kept
them
fixed throughout the study. The projected semi-major axis value
.
These values,
listed in Table 5,
were determined by passing the solution
iteratively between KOREL and PHOEBE, and validated by Gaussian fits
to spectral lines in SPEFO. The cross-correlation method based on
two templates, as implemented in TODCOR (Zucker
& Mazeh 1994), provided a fully
consistent fit for the primary RV, but failed to properly extract the
secondary
RV, because of the presence of the third system of spectral lines.
Once these parameters were determined from the RV modelling, we kept
them
fixed throughout the study. The projected semi-major axis value
![]() was used to constrain the fit: for each value
of i, a was computed so that
was used to constrain the fit: for each value
of i, a was computed so that ![]() remained constant.
remained constant.
Table 4: Physical properties of V945 Cen based on measured RVs.
![\begin{figure}
\par\includegraphics[width=16.5cm,clip]{14096f9.eps}\vspace*{2.5mm}
\end{figure}](/articles/aa/full_html/2010/12/aa14096-10/img72.png)
|
Figure 9:
Boundaries of the physically plausible parameter
space. Grid search in inclinations between |
| Open with DEXTER | |
![\begin{figure}
\par\includegraphics[width=9cm]{14096f10.eps}
\end{figure}](/articles/aa/full_html/2010/12/aa14096-10/img73.png)
|
Figure 10: V945 Cen light curves and a model solution in the absence of third light. For clarity, individual curves are shifted along the ordinate and shown by different symbols. There is a notable discrepancy in the Geneva U passband due to systematic calibration issues in the Balmer jump region. |
| Open with DEXTER | |
Since V945 Cen is an ellipsoidal variable, there is a very strong
correlation between the stellar radii and the orbital inclination,
which prevents the identification of a unique solution. By considering
the two possible interpretations of the third system of spectral lines,
we modelled two distinct possibilities:
1) the third source is optically thin and contributes to line
blanketing;
and 2) the source is optically thick and contributes to the joint
continuum
as the third light in the system. To find physically plausible
boundaries of
the parameter space, we performed an i-search from
![]() to
to ![]() ,
adjusting effective potentials (proxies to stellar
radii) and the secondary temperature
,
adjusting effective potentials (proxies to stellar
radii) and the secondary temperature ![]() for each value of
i. The semi-major axis a, the
passband luminosities Li,
and the limb darkening
coefficients were computed automatically after every iteration. Solid
lines
in Fig. 9
depict the results with (left) and without (right)
the inclusion of the third light. From the cost function profile
(
for each value of
i. The semi-major axis a, the
passband luminosities Li,
and the limb darkening
coefficients were computed automatically after every iteration. Solid
lines
in Fig. 9
depict the results with (left) and without (right)
the inclusion of the third light. From the cost function profile
(
![]() ;
bottom right panel), it is immediately clear that for any inclination
above
;
bottom right panel), it is immediately clear that for any inclination
above ![]() for the model with the third light,
and
for the model with the third light,
and ![]() for the model without the third light, all
solutions
are degenerate.
for the model without the third light, all
solutions
are degenerate.
To break this degeneracy, we computed the values of the
primary and secondary
star surface potential corresponding to the smallest and largest
observed
radii for B7 and B8.5-type stars, namely
![]() ,
,
![]() ,
and
,
and
![]() ,
,
![]() (Harmanec 1988). These limits
are depicted by dash-dotted lines in
the upper two panels. The intersection with the model determines
the plausible range of radii, hence inclinations for V945 Cen,
and is marked
by a dark-grey strip on all panels. Finally, the horizontal band
limited
by the surface potential values at the Lagrange points L1
and L2 shows
the overcontact region of the parameter space. We conclude that,
for both considered models, V945 Cen is a nearly contact, yet
still
detached binary. For the model with the third
light,
a semi-detached configuration with the primary filling the Roche lobe
also appears to be satisfactory, but the mass of the primary that would
result from this configuration is unrealistic:
(Harmanec 1988). These limits
are depicted by dash-dotted lines in
the upper two panels. The intersection with the model determines
the plausible range of radii, hence inclinations for V945 Cen,
and is marked
by a dark-grey strip on all panels. Finally, the horizontal band
limited
by the surface potential values at the Lagrange points L1
and L2 shows
the overcontact region of the parameter space. We conclude that,
for both considered models, V945 Cen is a nearly contact, yet
still
detached binary. For the model with the third
light,
a semi-detached configuration with the primary filling the Roche lobe
also appears to be satisfactory, but the mass of the primary that would
result from this configuration is unrealistic: ![]() compared to
the expected
compared to
the expected ![]()
![]() .
Since the secondary-star
potential always falls well outside the overcontact region, an
overcontact
configuration can safely be ruled out.
.
Since the secondary-star
potential always falls well outside the overcontact region, an
overcontact
configuration can safely be ruled out.
For the masses of these two stars to be reconciled with the
expected masses of
the main-sequence B7 and B8.5 stars, the band's upper end inclinations
are
more suitable: for an inclination of ![]() and the implied semi-major
axis
and the implied semi-major
axis ![]() ,
the resulting radii
,
the resulting radii
![]() and
and ![]() and the derived masses
and the derived masses
![]() and
and ![]() are in excellent agreement
with those expected (Harmanec 1988).
Moreover, the effective
temperature of the secondary (
are in excellent agreement
with those expected (Harmanec 1988).
Moreover, the effective
temperature of the secondary (![]() 10 650 K and
10 650 K and
![]() 10 930 K
for the models with the third light and without it, respectively) does
not
contradict the expected value of
10 930 K
for the models with the third light and without it, respectively) does
not
contradict the expected value of ![]() 10 880 K.
Because of the degeneracy,
there is no way to qualify the correctness of the model
beyond these plausibility estimates; we thus refer to the solution as
probable, and discourage the use of
these values for calibration
purposes as they would lead to a circular argument.
10 880 K.
Because of the degeneracy,
there is no way to qualify the correctness of the model
beyond these plausibility estimates; we thus refer to the solution as
probable, and discourage the use of
these values for calibration
purposes as they would lead to a circular argument.
Table 5:
Probable V945 Cen model parameters and their formal
error estimates, where ![]() is the value of the Roche-model potential used
in the WD program, and Li
are the relative luminosities
of the components in individual photometric passbands.
is the value of the Roche-model potential used
in the WD program, and Li
are the relative luminosities
of the components in individual photometric passbands.
![\begin{figure}
\par\includegraphics[width=9cm]{14096f11.eps}
\end{figure}](/articles/aa/full_html/2010/12/aa14096-10/img123.png)
|
Figure 11: A diagram showing the geometry of binary components as seen by an observer on Earth. The system is close but still well detached. |
| Open with DEXTER | |
![\begin{figure}
\par\includegraphics[width=9cm,clip]{14096f12.eps}
\end{figure}](/articles/aa/full_html/2010/12/aa14096-10/img132.png)
|
Figure 12:
Evolutionary tracks compared with the components of
V945 Cen. Solid lines on
the main plot show tracks computed with the Padova evolution code
for the initial mass of |
| Open with DEXTER | |
Figure 11 that illustrates the geometrical configuration of the binary, as seen projected onto the sky, follows from our model. The binary is close but still well detached.
To examine the plausibility of both solutions further, we
overplotted
the modeled components in the ![]() -
-
![]() diagram
(cf. Fig. 12).
The depicted theoretical evolutionary
tracks for
diagram
(cf. Fig. 12).
The depicted theoretical evolutionary
tracks for ![]() ,
,
![]() ,
,
![]() and
and ![]() were adopted from the Padova stellar evolution models (Marigo et al. 2008)
and a log-normal initial mass function (Chabrier
2001). The main plot shows the tracks and the model solutions
with and without a third light contribution as pluses and crosses,
respectively. The location of the primary star on the diagram coincides
for both models because of the adopted
were adopted from the Padova stellar evolution models (Marigo et al. 2008)
and a log-normal initial mass function (Chabrier
2001). The main plot shows the tracks and the model solutions
with and without a third light contribution as pluses and crosses,
respectively. The location of the primary star on the diagram coincides
for both models because of the adopted
![]() K,
but the inferred masses are different:
K,
but the inferred masses are different:
![]() from the evolutionary tracks
agrees well with the third-light contaminated model (
from the evolutionary tracks
agrees well with the third-light contaminated model (
![]() ),
but only marginally well with the model without the third light
(
),
but only marginally well with the model without the third light
(
![]() ).
The location of the secondary star
for both models differs slightly and constrains the probable nature
of the third spectrum. Namely, for the model with the third light,
the mass of the secondary inferred from the tracks is
).
The location of the secondary star
for both models differs slightly and constrains the probable nature
of the third spectrum. Namely, for the model with the third light,
the mass of the secondary inferred from the tracks is
![]() (see the inset in Fig. 12),
in good agreement with the adopted spectrophotometric value
(see the inset in Fig. 12),
in good agreement with the adopted spectrophotometric value
![]() .
For the model without the third light
and the modeled spectrophotometric value of
.
For the model without the third light
and the modeled spectrophotometric value of ![]() ,
the evolution-inferred value of
,
the evolution-inferred value of ![]() ,
although
somewhat discrepant, is still well within the error bars. Finally, the
model
with the third light predicts both components to be at (or very close
to)
the zero-age main sequence (ZAMS) with an age of
,
although
somewhat discrepant, is still well within the error bars. Finally, the
model
with the third light predicts both components to be at (or very close
to)
the zero-age main sequence (ZAMS) with an age of ![]() 10 million
years.
The model without the third light, however, predicts the secondary star
temperature to be by
10 million
years.
The model without the third light, however, predicts the secondary star
temperature to be by ![]() 300 K
too hot for the ZAMS. Based on these
observations, it seems that a real third star is present in the system.
300 K
too hot for the ZAMS. Based on these
observations, it seems that a real third star is present in the system.
5 Conclusion
In this study, we have discovered that the bright variable star V945 Cen is a short-period, nearly contact double-lined spectroscopic binary with pronounced ellipsoidal variations. We derived the basic physical properties of the system from multicolor photometry and high-resolution spectroscopy. We also detected a strong and seemingly stationary third B-type line spectrum. Although the arguments presented in Sects. 2.3 and 4 strongly favour the presence of a real third body in the system, interferometric or high-precision astrometric observations would provide the final resolution of this issue and are strongly encouraged. In addition, future spectroscopic observations may allow the detection of measurable RV variations in the third spectrum and also a secular change in the systemic velocity of the close binary as the pair and the tertiary would move in the orbit around the common centre of gravity.
AcknowledgementsWe thank Peter De Cat, Joris De Ridder and Gwendolyn Meeus from the Institute of Astronomy of the K.U. Leuven, who obtained some photometric observations of V945 Cen during the long-term monitoring program. We acknowledge the use of the programs FOTEL and KOREL, made publicly available by their author, Dr. Petr Hadrava. Comments by an anonymous referee helped to improve the presentation. The research of P.H. was supported by the grants 205/03/0788, 205/06/0304, 205/08/H005, and in the final stages also P209/10/0715 of the Czech Science Foundation and also from the Research Program MSM0021620860 Physical study of objects and processes in the solar system and in astrophysics of the Ministry of Education of the Czech Republic. The Leuven authors are supported by the Research Council of K.U. Leuven under grant GOA/2008/04. We acknowledge the use of the electronic database from CDS Strasbourg and electronic bibliography maintained by the NASA/ADS system.
Appendix A: Simulation of a spurious RV variation resulting from a blend of three spectra
|
Figure A.1:
The RV of the H |
| Open with DEXTER | |
As we have shown in this study, the observed spectrum of
V945 Cen is a sum of three
spectra: two late B spectra of the binary components revolving around
each
other with a period of 0
![]() 649, and a stationary late-B
line spectrum from
a probable tertiary in the system. In this temperature range, the H
649, and a stationary late-B
line spectrum from
a probable tertiary in the system. In this temperature range, the H![]() profiles
have very extended Stark-broadened wings and sharp cores. We measured
the RV
of the H
profiles
have very extended Stark-broadened wings and sharp cores. We measured
the RV
of the H![]() core in the observed spectra manually, comparing the direct and
flipped profiles of the core in SPEFO. We obtained a RV variation
reminiscent
of a sum of two sinusoids. One has a period equal to the orbital period
of
the binary and the other one a period three times shorter
(cf. Fig. 5).
Our conclusion was that this RV variation is
spurious and arises from a strong blending of all three spectra
involved.
core in the observed spectra manually, comparing the direct and
flipped profiles of the core in SPEFO. We obtained a RV variation
reminiscent
of a sum of two sinusoids. One has a period equal to the orbital period
of
the binary and the other one a period three times shorter
(cf. Fig. 5).
Our conclusion was that this RV variation is
spurious and arises from a strong blending of all three spectra
involved.
To carry out a conclusive test that such an apparent RV variation can indeed originate from a blend of a stationary shell line with two spectra of an orbiting binary, we simulated such a situation with the help of synthetic profiles. We used synthetic spectra computed from Castelli & Kurucz (2004)'s NEWODF models, rotated them to 70, 55, and 30 km s-1, Doppler-shifted them according to the mid-exposure times of 44 observed spectra, and merged them with the appropriate relative strengths. We then rectified the resulting composite spectra in SPEFO and measured the RV of the absorption core, as we did for the real data.
The result is shown in Fig. A.1. The similarity
with the RV curve
obtained from the real H![]() profiles is obvious.
We note that this finding represents a very important
methodological warning: if one is unaware of the
presence
of a third spectrum and carries out similar measurements on the
observed
spectra, one may conclude that the object is a pulsating star or
at least a multiperiodic variable.
profiles is obvious.
We note that this finding represents a very important
methodological warning: if one is unaware of the
presence
of a third spectrum and carries out similar measurements on the
observed
spectra, one may conclude that the object is a pulsating star or
at least a multiperiodic variable.
References
- Aerts, C., & Kolenberg, K. 2005, A&A, 431, 615 [NASA ADS] [CrossRef] [EDP Sciences] [Google Scholar]
- Aerts, C., De Cat, P., Peeters, E., et al. 1999, A&A, 343, 872 [NASA ADS] [Google Scholar]
- Briquet, M., Aerts, C., Lüftinger, T., et al. 2004, A&A, 413, 273 [NASA ADS] [CrossRef] [EDP Sciences] [Google Scholar]
- Brown, A. G. A., & Verschueren, W. 1997, A&A, 319, 811 [NASA ADS] [Google Scholar]
- Castelli, F., & Kurucz, R. L. 2004, A&A, in Modelling of Stellar Atmospheres, ed. N. Piskunov et al., Poster A20, IAU Symp., 210 [arXiv:astro-ph/0405087] [Google Scholar]
- Chabrier, G. 2001, ApJ, 554, 1274 [NASA ADS] [CrossRef] [Google Scholar]
- Cramer, N., & Maeder, A. 1979, A&A, 78, 305 [NASA ADS] [Google Scholar]
- De Cat, P., & Aerts, C. 2002, A&A, 393, 965 [NASA ADS] [CrossRef] [EDP Sciences] [Google Scholar]
- De Cat, P., Aerts, C., De Ridder, J., et al. 2000, A&A, 355, 1015 [NASA ADS] [Google Scholar]
- Eyer, L., & Grenon, M. 1997, in Hipparcos - Venice '97, ESA SP-402, 467 [Google Scholar]
- Gray, R. O., & Corbally, C. J. 1994, AJ, 107, 742 [NASA ADS] [CrossRef] [Google Scholar]
- Hadrava, P. 1990, Contr. Astron. Obs. Skalnaté Pleso, 20, 23 [Google Scholar]
- Hadrava, P. 1995, A&AS, 114, 393 [NASA ADS] [Google Scholar]
- Hadrava, P. 1997, A&AS, 122, 581 [NASA ADS] [CrossRef] [EDP Sciences] [Google Scholar]
- Hadrava, P. 2004a, Publ. Astron. Inst. Acad. Sci. Czech Rep., 92, 1 [Google Scholar]
- Hadrava, P. 2004b, Publ. Astron. Inst. Acad. Sci. Czech Rep., 92, 15 [Google Scholar]
- Harmanec, P. 1988, BAC, 39, 329 [Google Scholar]
- Hill, G. 1982, Publ. Dom. Astrophys. Obs. Victoria, 16, 67 [Google Scholar]
- Horn, J., Kubat, J., Harmanec, P., et al. 1996, A&A, 309, 521 [NASA ADS] [Google Scholar]
- Kazarovets, A. V., Samus, N. N., Durlevich, O. V., et al. 1999, Inf. Bull. Var. Stars No., 4659, 1 [Google Scholar]
- Kurucz, R. L. 1979, ApJS, 40, 1 [NASA ADS] [CrossRef] [Google Scholar]
- Lenzen, R., Hartung, M., Brandner, W., et al. 2003, in SPIE Conf. Ser., Presented at the Society of Photo-Optical Instrumentation Engineers (SPIE) Conf., ed. M. Iye, & A. F. M. Moorwood, 4841, 944 [Google Scholar]
- Marigo, P., Girardi, L., Bressan, A., et al. 2008, A&A, 482, 883 [NASA ADS] [CrossRef] [EDP Sciences] [Google Scholar]
- Mathias, P., Aerts, C., Briquet, M., et al. 2001, A&A, 379, 905 [NASA ADS] [CrossRef] [EDP Sciences] [Google Scholar]
- Perryman, M. A. C., & ESA. 1997, The HIPPARCOS and TYCHO catalogues, Astrometric and photometric star catalogues derived from the ESA HIPPARCOS Space Astrometry Mission (Noordwijk, Netherlands: ESA Publications Division), ESA SP Ser., 1200 [Google Scholar]
- Prsa, A., & Zwitter, T. 2005, ApJ, 628, 426 [NASA ADS] [CrossRef] [Google Scholar]
- Prsa, A., & Zwitter, T. 2006, Ap&SS, 304, 347 [NASA ADS] [CrossRef] [Google Scholar]
- Rousset, G., Lacombe, F., Puget, P., et al. 2003, in SPIE Conf. Ser. Presented at the Society of Photo-Optical Instrumentation Engineers (SPIE) Conf., ed. P. L. Wizinowich, & D. Bonaccini, 4839, 140 [Google Scholar]
- Skoda, P. 1996, in Astronomical Data Analysis Software and Systems V, ASP Conf. Ser., 101, 187 [Google Scholar]
- Southworth, J., & Clausen, J. 2007, A&A, 461, 1077 [NASA ADS] [CrossRef] [EDP Sciences] [Google Scholar]
- Waelkens, C., Aerts, C., Kestens, E., Grenon, M., & Eyer, L. 1998, A&A, 330, 215 [NASA ADS] [Google Scholar]
- Wilson, R. E., & Devinney, E. J. 1971, ApJ, 166, 605 [NASA ADS] [CrossRef] [Google Scholar]
- Zucker, S., & Mazeh, T. 1994, ApJ, 420, 806 [NASA ADS] [CrossRef] [EDP Sciences] [MathSciNet] [Google Scholar]
Footnotes
- ... system?
- Based on photometry gathered with the Swiss 0.7-m telescope equipped with the P7 photometer of the Geneva Observatory and on spectroscopy assembled with the FEROS spectrograph attached to the ESO 2.2 m telescope, both situated at La Silla in Chile.
- ...
- Reduced data is only available in electronic form at the CDS via anonymous ftp to cdarc.u-strasbg.fr (130.79.128.5) or via http://cdsarc.u-strasbg.fr/viz-bin/qcat?J/A+A/520/A73
- ...
- Postdoctoral Fellow of the Fund for Scientific Research, Flanders.
- ... PH
- The program HEC35D with User's Manual and a few auxiliary programs is available to interested users at ftp://astro.troja.mff.cuni.cz/ftp/hec/HEC35. Reports of possible bugs to P.H. are welcome.
- ... edges
- This is necessary since KOREL requires that the number of the input data points is an integer multiple of 512.
- ...
SPECTRUM 2.75
- http://www.phys.appstate.edu/spectrum/spectrum.html
All Tables
Table 1: Journal of photometric and spectroscopic observations.
Table 2: Exploratory orbital solutions obtained with FOTEL for a circular orbit.
Table 3: Circular-orbit solutions derived with KOREL for several short spectral regions near stronger spectral lines.
Table 4: Physical properties of V945 Cen based on measured RVs.
Table 5:
Probable V945 Cen model parameters and their formal
error estimates, where ![]() is the value of the Roche-model potential used
in the WD program, and Li
are the relative luminosities
of the components in individual photometric passbands.
is the value of the Roche-model potential used
in the WD program, and Li
are the relative luminosities
of the components in individual photometric passbands.
All Figures
|
|
Figure 1: Four segments of the spectra containing some interesting spectral lines. Heliocentric Julian dates and orbital phases of the spectra are given in each panel. For clarity, the continua of subsequent spectra are shifted by 0.3 units in normalized intensity. The left panel shows the region near the He I 4437.551 Å line (the position of which is shown by a bar), the central panel shows the neighbourhood of He I 4471.508 Å and Mg II 4481.228 Å, and the right one shows the Fe II 4549 Å line. It is obvious that the observed spectrum is actually a combination of three different spectra, identified as components 1, 2, and 3 for the spectra taken at both elongations of the 0.65-d binary. Note, however, that the line of component 3 to the left of the He I 4471.508 Å line is Ti II 4468.507 Å. See the text for details. |
| Open with DEXTER | |
| In the text | |
|
|
Figure 2:
The observed spectral energy distribution of V945 Cen (circles
denoting
the measurements in various passbands plus a plot of the IUE spectrum)
is
compared to that from a Kurucz model atmosphere for |
| Open with DEXTER | |
| In the text | |
|
|
Figure 3:
A phase plot for the Geneva V ( upper panel)
and
Hipparcos |
| Open with DEXTER | |
| In the text | |
|
|
Figure 4: RV curves of all three components identified in the spectra as measured in SPEFO. The two upper panels show the RV curves of the weak He I 4437 Å line and a stronger He I 6678 Å line, which are both only seen for component 1; the third panel from the top shows the RVs derived from the Fe II 4549 Å line for components 1 and 2, and the bottom panel shows the RVs of the Ti II 4443 Å line of component 3. The RVs of components 1, 2, and 3 (see Fig. 1) are denoted by black dots, open circles, and diamonds, respectively. |
| Open with DEXTER | |
| In the text | |
|
|
Figure 5:
An apparent orbital variation in the RV of the H |
| Open with DEXTER | |
| In the text | |
|
|
Figure 6: The sum of squares of residuals of exploratory KOREL solutions as a function of the semi-amplitude of the primary, K1, derived separately for the four indicated spectral lines. See the text for details. |
| Open with DEXTER | |
| In the text | |
|
|
Figure 7: The sum of squares of residuals of exploratory KOREL solutions as a function of the mass ratio K1/K2derived separately for the Mg II 4481 Å, Si II 6347 Å, and Fe II 4549 Å. See the text for details. |
| Open with DEXTER | |
| In the text | |
|
|
Figure 8:
Left: Cramer
& Maeder (1979) parameters X
(dots)
and Y (crosses) of observed data points as a
function of phase.
There is a slight phase dependence present in parameter X,
which is expected
due to its dependence on |
| Open with DEXTER | |
| In the text | |
|
|
Figure 9:
Boundaries of the physically plausible parameter
space. Grid search in inclinations between |
| Open with DEXTER | |
| In the text | |
|
|
Figure 10: V945 Cen light curves and a model solution in the absence of third light. For clarity, individual curves are shifted along the ordinate and shown by different symbols. There is a notable discrepancy in the Geneva U passband due to systematic calibration issues in the Balmer jump region. |
| Open with DEXTER | |
| In the text | |
|
|
Figure 11: A diagram showing the geometry of binary components as seen by an observer on Earth. The system is close but still well detached. |
| Open with DEXTER | |
| In the text | |
|
|
Figure 12:
Evolutionary tracks compared with the components of
V945 Cen. Solid lines on
the main plot show tracks computed with the Padova evolution code
for the initial mass of |
| Open with DEXTER | |
| In the text | |
|
|
Figure A.1:
The RV of the H |
| Open with DEXTER | |
| In the text | |
Copyright ESO 2010
Current usage metrics show cumulative count of Article Views (full-text article views including HTML views, PDF and ePub downloads, according to the available data) and Abstracts Views on Vision4Press platform.
Data correspond to usage on the plateform after 2015. The current usage metrics is available 48-96 hours after online publication and is updated daily on week days.
Initial download of the metrics may take a while.