| Issue |
A&A
Volume 516, June-July 2010
|
|
|---|---|---|
| Article Number | A27 | |
| Number of page(s) | 9 | |
| Section | Interstellar and circumstellar matter | |
| DOI | https://doi.org/10.1051/0004-6361/201014133 | |
| Published online | 22 June 2010 | |
VLBI observations of SN 2008iz
I. Expansion velocity and limits on anisotropic expansion
A. Brunthaler1 - I. Martí-Vidal1 - K. M. Menten1 - M. J. Reid2 - C. Henkel1 - G. C. Bower3 - H. Falcke4,5 - H. Feng6 - P. Kaaret7 - N. R. Butler3 - A. N. Morgan3 - A. Weiß1
1 - Max-Planck-Institut für Radioastronomie, Auf dem Hügel 69, 53121 Bonn, Germany
2 -
Harvard-Smithsonian Center for Astrophysics, 60 Garden Street, Cambridge, MA 02138, USA
3 -
UC Berkeley, 601 Campbell Hall, Astronomy Department & Radio Astronomy Lab, Berkeley, CA 94720, USA
4 -
Department of Astrophysics, Radboud Universiteit Nijmegen, Postbus 9010, 6500 GL Nijmegen, The Netherlands
5 -
ASTRON, Postbus 2, 7990 AA Dwingeloo, The Netherlands
6 -
Department of Engineering Physics and Center for Astrophysics, Tsinghua University, Beijing 100084, PR China
7 -
Department of Physics and Astronomy, University of Iowa, Van Allen Hall, Iowa City, IA 52242, USA
Received 26 January 2010 / Accepted 25 March 2010
Abstract
We present observations of the recently discovered supernova 2008iz
in M 82 with the VLBI High Sensitivity Array at 22 GHz, the
Very Large Array at frequencies of 1.4, 4.8, 8.4, 22 and 43 GHz,
and the Chandra X-ray observatory. The supernova was clearly detected
in two VLBI images separated by 11 months. The source shows a ring-like
morphology and expands with a velocity of ![]() 23 000 km s-1. The most likely explosion date is in mid-February 2008. The measured expansion speed is a factor of
23 000 km s-1. The most likely explosion date is in mid-February 2008. The measured expansion speed is a factor of ![]() 2
higher than expected under the assumption that synchrotron
self-absorption dominates the light curve at the peak, indicating that
this absorption mechanism may not be important for the radio emission.
We find no evidence for an asymmetric explosion. The VLA spectrum shows
a broken power law, indicating that the source was still optically
thick at 1.4 GHz in April 2009. Finally, we report upper limits on
the X-ray emission from SN 2008iz and a second radio transient
recently discovered by MERLIN observations.
2
higher than expected under the assumption that synchrotron
self-absorption dominates the light curve at the peak, indicating that
this absorption mechanism may not be important for the radio emission.
We find no evidence for an asymmetric explosion. The VLA spectrum shows
a broken power law, indicating that the source was still optically
thick at 1.4 GHz in April 2009. Finally, we report upper limits on
the X-ray emission from SN 2008iz and a second radio transient
recently discovered by MERLIN observations.
Key words: stars: supernovae: general - stars: supernovae: individual: SN 2008iz - radio continuum: general - galaxies: individual: M 82
1 Introduction
Radio supernovae (RSNe) are rare events and are difficult to study. So far, only about two dozen have been detected (e.g. Weiler et al. 2002) and most of them are distant and weak. Few radio supernovae have been imaged with Very Long Baseline Interferometry (VLBI) techniques, and the evolution of their expanding shells has been studied in only four sources (SN 1979C, SN 1986J, SN 1987A, SN 1993J). The best studied radio supernova so far is SN 1993J in M 81. Following the expansion of the supernova allowed many different phenomena to be studied (Bartel et al. 2007; Bietenholz et al. 2001; Marcaide et al. 1997; Bartel et al. 2002; Bietenholz et al. 2003; Pérez-Torres et al. 2002a; Marcaide et al. 2009a; Pérez-Torres et al. 2001), including a measurement of the expansion speed, the deceleration of the shock front, and the proper motion of the supernova shell, for which a limit was obtained.
The recent discovery of a new bright radio supernova in M 82, SN 2008iz, (Brunthaler et al. 2009a,b) at a similar distance as SN 1993J offers the rare opportunity to study the evolution of another supernova in great detail and to make a comparison to SN 1993J. Prior to the results presented here, SN 2008iz has only been detected in the radio band with the VLA at 22 GHz (Brunthaler et al. 2009a), MERLIN at 5 GHz (Beswick et al. 2009), and the Urumqi telescope at 5 GHz (Marchili et al. 2010). There have been no reported detections in visible light and Fraser et al. (2009) report only a non detection in the near infrared on 2009 June 11. The non-detections at other wavebands indicate that the supernova exploded behind a large gas or dust cloud in the central part of M 82. Thus, it has not been possible to classify this supernova. However, since type Ia supernovae are not known to show strong radio emission, SN 2008iz is most likely a core collapse supernova, i.e. type Ib/c or II.
Here we present the first VLBI images of SN 2008iz taken ![]() 2.5 and
2.5 and ![]() 13.5 month after the explosion, a radio spectrum (at an age of
13.5 month after the explosion, a radio spectrum (at an age of ![]() 14.5
month) from 1.4 to 43 GHz and Chandra X-ray observations.
Throughout the paper, we adopt a distance of 3.6 Mpc (based on a
Cepheid distance to M 81 determined by Freedman et al. 1994).
14.5
month) from 1.4 to 43 GHz and Chandra X-ray observations.
Throughout the paper, we adopt a distance of 3.6 Mpc (based on a
Cepheid distance to M 81 determined by Freedman et al. 1994).
2 Observations and data reduction
2.1 High sensitivity array observations at 22 GHz
M 82 was observed using the High Sensitivity Array including the
NRAO![]() Very Long Baseline Array (VLBA), the Very Large Array
(VLA), the Green Bank Telescope (GBT), and the Effelsberg 100 m telescope under
project code BB255 on 2008 May 03 and 2009 April 08. The total observing time
at each epoch was 12 h. We used M 81*, the nuclear radio source in M 81, as
the phase calibrator and switched between M 81*, M 82, and 3 extragalactic background
quasars every 50 s in the sequence M 81* - 0945+6924 - M 81* - 0948+6848
- M 81* - M 82 - 1004+6936 - M 81*, yielding a total integration time of
Very Long Baseline Array (VLBA), the Very Large Array
(VLA), the Green Bank Telescope (GBT), and the Effelsberg 100 m telescope under
project code BB255 on 2008 May 03 and 2009 April 08. The total observing time
at each epoch was 12 h. We used M 81*, the nuclear radio source in M 81, as
the phase calibrator and switched between M 81*, M 82, and 3 extragalactic background
quasars every 50 s in the sequence M 81* - 0945+6924 - M 81* - 0948+6848
- M 81* - M 82 - 1004+6936 - M 81*, yielding a total integration time of ![]() 100 min on M 82. J1048+7143 was observed every
100 min on M 82. J1048+7143 was observed every ![]() 30 min
to phase-up the VLA, and DA193 was observed as fringe finder. The data
were recorded with four 8 MHz frequency bands in dual circular
polarization, with Nyquist sampling and 2 bits per sample (i.e., a
total recording rate of 256 Mbit s-1).
30 min
to phase-up the VLA, and DA193 was observed as fringe finder. The data
were recorded with four 8 MHz frequency bands in dual circular
polarization, with Nyquist sampling and 2 bits per sample (i.e., a
total recording rate of 256 Mbit s-1).
Before, in the middle, and at the end of the phase referencing
observations, we included ``geodetic blocks'', where we observed 18-21
bright sources from the International Celestial Reference Frame (ICRF)
at 22 GHz for ![]() 75 min to measure the tropospheric zenith delay offsets at each antenna (for a detailed discussion see Reid & Brunthaler 2004; Brunthaler et al. 2005).
The geodetic blocks were recorded with 8 IFs of 8 MHz in left
circular polarization. The first IF was centered at a frequency of
22.01049 GHz, and the other seven IFs were separated by 12.5,
37.5, 100.0, 262.5, 312.5, 412.5, and 437.5 MHz, respectively.
Here, only a single VLA antenna was used, which could observe only five
IFs at 0.0, 12.5, 37.5, 412.5, and 437.5 MHz relative to
22.01049 GHz.
75 min to measure the tropospheric zenith delay offsets at each antenna (for a detailed discussion see Reid & Brunthaler 2004; Brunthaler et al. 2005).
The geodetic blocks were recorded with 8 IFs of 8 MHz in left
circular polarization. The first IF was centered at a frequency of
22.01049 GHz, and the other seven IFs were separated by 12.5,
37.5, 100.0, 262.5, 312.5, 412.5, and 437.5 MHz, respectively.
Here, only a single VLA antenna was used, which could observe only five
IFs at 0.0, 12.5, 37.5, 412.5, and 437.5 MHz relative to
22.01049 GHz.
The data were correlated at the VLBA Array Operations Center in Socorro, New
Mexico. In the observation on 2008 May 03, the data were correlated at the
position of known water maser emission
(09![]() 55
55![]() 51
51
![]() 38702,
+69
38702,
+69![]() 40'44
40'44
![]() 4676, J2000) with 128 spectral channels per IF and an
integration time of 1 s. The observation on 2009 April 08 was correlated
at the position 09
4676, J2000) with 128 spectral channels per IF and an
integration time of 1 s. The observation on 2009 April 08 was correlated
at the position 09![]() 55
55![]() 51
51
![]() 5500,
+69
5500,
+69![]() 40'45
40'45
![]() 792, (J2000),
close to SN 2008iz with 16 spectral channels and an integration time of 1 s.
792, (J2000),
close to SN 2008iz with 16 spectral channels and an integration time of 1 s.
The data reduction was performed with the NRAO Astronomical Image Processing System (AIPS) in a standard manner. First we shifted the position of M 82 to the position of SN 2008iz using CLCOR in the observation on 2008 May 03. We applied the latest values of the Earth's orientation parameters and performed zenith delay corrections based on the results of the geodetic block observations. Total electron content maps of the ionosphere were used to correct for ionospheric phase changes. Amplitude calibration used system temperature measurements and standard gain curves. We performed a ``manual phase-calibration'' using the data from J1048+7143 to remove instrumental phase offsets among the frequency bands. Then, we fringe fitted the data from M 81* and performed an amplitude self-calibration on M 81*. In the observation on 2008 May 03, we additionally first performed a phase-self calibration and later an amplitude self-calibration on SN 2008iz. In the observation on 2009 April 08, the inclusion of the phased VLA increased the noise in the images significantly, possibly due to a problem with the phasing of the array (the VLA was in B-configuration). Thus, we flagged the VLA data from this epoch.
2.2 VLA observation on 2009 April 27 (1.4-43 GHz)
We observed M 82 with the VLA on 2009 April 27 at 1.4, 4.8,
8.4, 22, and 43 GHz, for a total observing time of 4 hours. We
observed with two frequency bands of 50 MHz, each in dual circular
polarization. 3C 48 and J1048+7143 were used as primary flux
density and phase calibrators, respectively. At 1.4, 4.8, and
8.4 GHz, we used a switching cycle of six minutes, spending one
minute on the phase calibrator and five minutes on M 82. We
repeated these cycles 5 times over the observations, yielding an
integration time of ![]() 25 min at
each frequency. At 22 and 43 GHz, we used a switching cycle of three minutes,
spending one minute on the phase calibrator and two minutes on M 82. These
cycles were repeated 10 times during the observation, yielding an
integration time of
25 min at
each frequency. At 22 and 43 GHz, we used a switching cycle of three minutes,
spending one minute on the phase calibrator and two minutes on M 82. These
cycles were repeated 10 times during the observation, yielding an
integration time of ![]() 20 min at these frequencies.
20 min at these frequencies.
The data reduction was performed in AIPS and involved amplitude calibration of 3C 48 using source models, followed by a phase calibration using J1048+7143 and an additional phase and amplitude self-calibration on J1048+7143. The calibration was then transferred to the target source M 82. We performed one phase-only self-calibration on M 82 at all frequencies, except 43 GHz where the source is too weak.
2.3 Chandra and Swift XRT observations
The Chandra X-ray observatory (CXO) observed M 82 on 2008 October 4, and 2009 April 17 and 29. Each observation was taken with an exposure of about 18 ks. In these observations, the target was off the optical axis by more than 3 arcmin, where the point spread function resembles an extended ellipse covering multiple pixels.
M 82 was also observed with the Swift X-ray Telescope
(XRT; Gehrels et al. 2004; Burrows et al. 2005)
on 2007 January 26, 2008 May 1, and 2009 April 25 with exposures of
4.6 ks, 5.0 ks, and 4.7 ks, respectively. Due to the low
resolution of the telescope, the collection of known X-ray sources
appears as a single point-like source in the XRT data, so only count
rates from the conglomerate of sources were measured. The data suffer
from heavy pile-up, which is accounted for by extracting count rates
from an annular region around the central, piled-up location![]() .
.
3 Results
3.1 VLBI images at 22 GHz
We imaged the data of SN 2008iz from 2008 May 03 with a slightly super-resolved beam ofThe supernova was clearly detected in both epochs (see Fig. 1). The source is already clearly resolved in the observation on 2008 May 03 and shows a ring-like structure, typical for a radio supernova. In the following eleven months the source expanded and faded significantly.
3.2 VLA radio spectrum
![\begin{figure}
\par\resizebox{8.8cm}{!}{\includegraphics[bb=1.5cm 7.40cm 20.0cm
...
...graphics[bb=1.5cm 6.50cm 20.0cm
22.8cm,clip,angle=0]{14133f1b.ps}}
\end{figure}](/articles/aa/full_html/2010/08/aa14133-10/img20.png)
|
Figure 1:
HSA contour plots of SN 2008iz at 22 GHz in May 2008 ( top) and April 2009 ( bottom). Contours start at 0.3 mJy ( top), 0.1 mJy ( bottom) and increase with |
| Open with DEXTER | |
Table 1: Flux densities of SN 2008iz and two other supernova remnants in M 82 from the VLA observation on 2009 April 27.
M 82 was imaged at all frequencies using only data from
baselines longer than 30 k![]() to ensure that most of the extended
emission in M 82 is resolved out. Flux densities were extracted by fitting
two-dimensional Gaussians to the images.
to ensure that most of the extended
emission in M 82 is resolved out. Flux densities were extracted by fitting
two-dimensional Gaussians to the images.
The measured flux densities of SN 2008iz and two other supernova remnants that
could be easily separated from the diffuse background emission are listed in
Table 1. The errors are estimated by adding in quadrature the
formal error from the fit to the images, the difference between peak and
integrated flux densities, and a 5![]() error allowing for uncertainty in the
overall flux density scale. Furthermore, we added an additional 5
error allowing for uncertainty in the
overall flux density scale. Furthermore, we added an additional 5![]() error
at 1.4, 4.8, and 8.4 GHz, since we have more confusion from the extended
emission at these frequencies. Note that the flux density at 4.8 GHz is in good
agreement with the flux densities obtained with MERLIN a few days later (
error
at 1.4, 4.8, and 8.4 GHz, since we have more confusion from the extended
emission at these frequencies. Note that the flux density at 4.8 GHz is in good
agreement with the flux densities obtained with MERLIN a few days later (![]() mJy)
by Beswick et al. (2009).
mJy)
by Beswick et al. (2009).
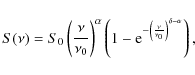
The spectrum of SN 2008iz is shown in Fig. 2. First, we fitted a
single power-law spectrum to the data, which resulted in a best-fit spectral index of
![]() .
However, the fit has a large reduced
.
However, the fit has a large reduced ![]() value of 2.6, due to the the 1.4 GHz value being too low. Thus, to
account for this, we also fitted the spectrum with a broken power-law,
value of 2.6, due to the the 1.4 GHz value being too low. Thus, to
account for this, we also fitted the spectrum with a broken power-law,
|
(1) |
where
![\begin{figure}
\par\includegraphics[angle=-90,width=9cm,clip]{14133f2.ps}
\end{figure}](/articles/aa/full_html/2010/08/aa14133-10/img40.png)
|
Figure 2: Spectrum of SN 2008iz taken with the VLA on 2009 April 27. Also shown are a single power-law fit (dotted line) and two broken power-law fits with a spectral index of 2.5 (solid line) and 4.5 (dash-dotted line) in the optically thick part. |
| Open with DEXTER | |
3.3 X-ray upper limits
The off-axis configuration and consequently the degraded angular resolution, as well as the diffuse background, significantly decreased the sensitivity of the Chandra measurements. The detection limit for these observations is estimated from the total emission around the radio position in a region with the same size as the point spread function. SN 2008iz is located close to several variable ultraluminous X-ray sources, but no emission was detected at the position of the supernova. Muxlow et al. (2009) and Muxlow et al. (2010) report the discovery of a second radio transient in M 82 with the MERLIN telescope. This source appeared between 2009 April 24 and 2009 May 5 and is located at a position with diffuse emission background. It is surrounded by a few point-like sources. There is no enhanced X-ray emission at the location of this second radio transient on 2009 April 17 or 2009 April 29.
In order to compare our results with those of SN 1993J, we
assume that physical properties are similar at a similar ages, i.e.,
thermal bremsstrahlung emission with a temperature of 1.05 keV,
abundances from Table 2, Col. 4 of Zimmermann & Aschenbach (2003), and an absorption column density of
![]() cm-2 (see Sect. 5.1). We then obtaing a
cm-2 (see Sect. 5.1). We then obtaing a ![]() upper limit for SN 2008iz of
upper limit for SN 2008iz of
![]() erg s-1
in the energy range 0.3-2.4 keV. This is consistent with the X-ray
luminosity of SN 1993J at a similar age and energy range (Zimmermann & Aschenbach 2003).
erg s-1
in the energy range 0.3-2.4 keV. This is consistent with the X-ray
luminosity of SN 1993J at a similar age and energy range (Zimmermann & Aschenbach 2003).
The ![]() sensitivity at the location of the MERLIN transient, assuming a column density of 1022 cm-2
and a photon power-law index of 1.7 (an approximation to a thermal
bremsstrahlung spectrum with a temperature of 10 keV, as seen in
SN1995N; Fox et al. 2000), is found to be about
sensitivity at the location of the MERLIN transient, assuming a column density of 1022 cm-2
and a photon power-law index of 1.7 (an approximation to a thermal
bremsstrahlung spectrum with a temperature of 10 keV, as seen in
SN1995N; Fox et al. 2000), is found to be about
![]() erg s-1 in 0.3-2.4 keV, which we take as the upper limit for the X-ray luminosity.
erg s-1 in 0.3-2.4 keV, which we take as the upper limit for the X-ray luminosity.
The resulting count rates in the Swift XRT data (0.5-8.0 keV)
are
![]() ,
,
![]() ,
and
,
and
![]() s-1 on 2007
January 26, 2008 May 1, and 2009 April 25, respectively.
There is no clear rise in total flux between the pre-SNe observation and
the May 2008 post-explosion epoch at
s-1 on 2007
January 26, 2008 May 1, and 2009 April 25, respectively.
There is no clear rise in total flux between the pre-SNe observation and
the May 2008 post-explosion epoch at ![]() 75 days, and, while a
75 days, and, while a ![]() 15%
increase in count rate is seen in the final observation, this is
consistent with BeppoSAX observations of the central region of M 82
showing variations on the order of 15-30% (2-10 keV) on hour time-scales
(Cappi et al. 1999). Indeed, such intrinsic variations are
also seen over the course of each epoch in the XRT observations as
well. Given the complications with the data
and the intrinsic variability of the sources, strong constraints are
difficult. However, since no increase in flux density larger than the
intrinsic variability is seen, we can place an upper limit on the SNe
X-ray flux of approximately
15%
increase in count rate is seen in the final observation, this is
consistent with BeppoSAX observations of the central region of M 82
showing variations on the order of 15-30% (2-10 keV) on hour time-scales
(Cappi et al. 1999). Indeed, such intrinsic variations are
also seen over the course of each epoch in the XRT observations as
well. Given the complications with the data
and the intrinsic variability of the sources, strong constraints are
difficult. However, since no increase in flux density larger than the
intrinsic variability is seen, we can place an upper limit on the SNe
X-ray flux of approximately
![]() erg s-1 (0.5-2.4 keV) on
2008 May 1 (assuming the same model as for the Chandra observations above).
erg s-1 (0.5-2.4 keV) on
2008 May 1 (assuming the same model as for the Chandra observations above).
4 Expansion speed and explosion center
4.1 Estimates of size and position
Estimating a physical size from the VLBI data is not straightforward, and different methods have been applied to determine the expansion curves of several radio supernovae (e.g. Bartel et al. 2002; Marcaide et al. 2009a,b). Estimating the source size in the image plane may have running biases (i.e., biases that depend on the source size) related to the different resolutions achieved in the different images (i.e., the structure is better resolved as the source expands). One way to avoid such biases is to use a dynamic beam, i.e., a similar ratio between source size and beam size (e.g. Marcaide et al. 1997) at each epoch. Here we use several different methods to determine the source size. The results for each method are summarized in Table 2.
![\begin{figure}
\par\includegraphics[angle=-90,width=9cm,clip]{14133f3.ps}
\end{figure}](/articles/aa/full_html/2010/08/aa14133-10/img49.png)
|
Figure 3: Intensity of concentric rings of widths 0.05 mas in the images from 2008 May 03 and 2009 April 08. The flux densities in the second observation were scaled by a factor of 5. The vertical lines mark the position of the peak and the radius where the intensity is 50% of the peak level. |
| Open with DEXTER | |
![\begin{figure}
\par\includegraphics[width=8.5cm,clip]{14133f4.ps}
\end{figure}](/articles/aa/full_html/2010/08/aa14133-10/img50.png)
|
Figure 4:
HSA images at 22 GHz of SN 2008iz in May 2008 ( top) and April 2009 ( middle and bottom). The bottom
image is convolved with a dynamic beam of 0.99 mas (i.e. the ratios of
beam size and source size are identical in the top and bottom images).
The rings denote the best fitted positions and radii from CPM in both
epochs, i.e. 320 and 1580 |
| Open with DEXTER | |
4.1.1 Concentric rings
First, we measured the intensity in concentric rings (of 0.05 mas width)
using the AIPS task IRING. Examples of intensity profiles for both observations
are shown in Fig. 3 together with fits to the data. One can
define the radius, ![]() ,
where the intensity falls to
,
where the intensity falls to ![]() of
the peak intensity, with any chosen value of n. Since
of
the peak intensity, with any chosen value of n. Since ![]() can be multi-valued (i.e., the inner and outer radii), we always use the
outer radius. Figure 3 shows the
can be multi-valued (i.e., the inner and outer radii), we always use the
outer radius. Figure 3 shows the ![]() (i.e. the peak
itself) and
(i.e. the peak
itself) and ![]() values.
A value of n=50% has the advantage that the profile is much steeper and the
position can be better determined than at the peak (where the profile is flat).
In order to avoid a running bias, it is important to use a
similar ratio of source size to beam size (i.e. a dynamic beam) in each epoch.
This method will give a size which is equal to the real size of the
expanding shell times an unknown factor. This factor will be smaller for
large values of n (the measured sizes are smaller for large values of n).
Figure 4 shows the images of SN 2008iz at both epochs and an
image of the second epoch with a dynamic beam.
values.
A value of n=50% has the advantage that the profile is much steeper and the
position can be better determined than at the peak (where the profile is flat).
In order to avoid a running bias, it is important to use a
similar ratio of source size to beam size (i.e. a dynamic beam) in each epoch.
This method will give a size which is equal to the real size of the
expanding shell times an unknown factor. This factor will be smaller for
large values of n (the measured sizes are smaller for large values of n).
Figure 4 shows the images of SN 2008iz at both epochs and an
image of the second epoch with a dynamic beam.
It is important to note that the intensity profile is sensitive to the
position of the central pixel of the concentric rings. A position
offset would smear out the intensity profile. This can be seen in
Fig. 5
where we plot the width of the intensity profile for different position
offsets in the first observation. As expected, the width shows a strong
dependence on the position offset. We estimate the position of the
center in the first epoch as 09![]() 55
55![]() 51
51
![]() 55026, +69
55026, +69![]() 40'45
40'45
![]() 7913 (J2000). Note that the uncertainty in the absolute position is dominated by the uncertainty of the position of
the phase referencing source M 81* (
7913 (J2000). Note that the uncertainty in the absolute position is dominated by the uncertainty of the position of
the phase referencing source M 81* (![]() 0.5 mas).
0.5 mas).
![\begin{figure}
\par\includegraphics[angle=-90,width=9cm,clip]{14133f5.ps}\vspace*{2mm}
\end{figure}](/articles/aa/full_html/2010/08/aa14133-10/img55.png)
|
Figure 5:
The width of the intensity profile as a function of position offset
(relative to a reference pixel) in the observation on 2008 May 03. One
pixel corresponds to 0.05 mas. Shown are position offsets in right
ascension (+) and declination ( |
| Open with DEXTER | |
4.1.2 Common point method
A different method to determine source size that uses the concept of a dynamic beam in a natural way is the Common-Point Method (CPM, Marcaide et al. 2009a). This method relies on the existence of a point in the radial profile of the supernova structure that remains unaltered under small changes in the convolving beam. This point is closely related to the source size (indeed, the ratio between the radial position of this point and the source radius is near unity; see Appendix A of Marcaide et al. 2009a, for details). In Fig. 6 we show the radial intensity profiles of SN 2008iz, computed from the azimuthal averages of the CLEAN models convolved using different beams. The ``common points'' in the profiles can be clearly seen in the figure.
![\begin{figure}
\par\includegraphics[width=9cm,clip]{14133f6.eps}
\end{figure}](/articles/aa/full_html/2010/08/aa14133-10/img56.png)
|
Figure 6: Solid lines: radial intensity profiles of SN 2008iz at the two VLBI epochs, computed using different convolving beams (1.0, 1.1, 1.2, 1.3, and 1.4 times the source radius at each epoch). The radial positions of the common points at each epoch (see Sect. 4.1.2) are marked with dashed lines. |
| Open with DEXTER | |
4.1.3 Model fitting
Finally, we estimated the size from model-fitting to the visibilities,
using a simplified model of the supernova radio structure. This method may
have undetermined running biases if the model is
not a good representation of the true supernova emission structure.
We fitted the visibilities using a model of a spherical shell of 30%
fractional width. This is the model that best describes the
structure of SN 1993J in Marcaide et al. (2009a). A smaller fractional
width between 20 and 25%, as prefered by other authors
(Bartel et al. 2002; Bietenholz et al. 2003; Bartel et al. 2000) or predicted by
Chevalier (1982), could lead to different source sizes. However, the
current data, based only on
two epochs at one frequency, do not allow a relaible statement about the
true fractional width of SN2008iz. For the model-fitting, we used
a modified version of the subroutine MODELFIT in the program DIFMAP
(Shepherd et al. 1995), which fits a parameterized shell model to the real and
imaginary parts of the visibilities. The use of the real and imaginary parts
of the visibilities (instead of amplitudes and phases) is more robust from a
statistical point of view, especially in the case of low signal-to-noise
data, since the noise involved in the data is gaussian-like (as assumed
in the modelling algorithms based on a ![]() minimization).
minimization).
4.2 Expansion speed
Using the ![]() value for the physical
size, we obtain a radius of 307
value for the physical
size, we obtain a radius of 307 ![]() as on 2008 May 03 and 1462
as on 2008 May 03 and 1462 ![]() as on 2009
April 08. The measured sizes correspond to an average expansion speed of 1243
as on 2009
April 08. The measured sizes correspond to an average expansion speed of 1243
![]() as yr-1 or
as yr-1 or
![]() km s-1. Extrapolating this
expansion back to a radius of zero and assuming constant expansion (
km s-1. Extrapolating this
expansion back to a radius of zero and assuming constant expansion (
![]() with an expansion index m=1) leads to an explosion date t0 of 2008
February 02. However, a significant deceleration (i.e. m < 1) would shift the
explosion date to a later time. Since the supernova was first seen in a VLA
observation on 2008 March 24, one can use this to give a lower limit for the expansion
index m of 0.7. Marchili et al. (2010) model the 5 GHz
light curve of SN 2008iz and find evidence of a modest deceleration with an
expansion index m=0.89 and an explosion date of 2008 February 18 (
with an expansion index m=1) leads to an explosion date t0 of 2008
February 02. However, a significant deceleration (i.e. m < 1) would shift the
explosion date to a later time. Since the supernova was first seen in a VLA
observation on 2008 March 24, one can use this to give a lower limit for the expansion
index m of 0.7. Marchili et al. (2010) model the 5 GHz
light curve of SN 2008iz and find evidence of a modest deceleration with an
expansion index m=0.89 and an explosion date of 2008 February 18 (![]() 6
days). Extrapolating the expansion seen on the VLBI images backward using this
expansion index, yields an explosion date of 2008 February 22. This value for
the explosion date is in reasonable agreement with the estimate from the 5 GHz
light curve.
6
days). Extrapolating the expansion seen on the VLBI images backward using this
expansion index, yields an explosion date of 2008 February 22. This value for
the explosion date is in reasonable agreement with the estimate from the 5 GHz
light curve.
The resulting source sizes for the different methods are summarized in
Table 2. Most methods give similar expansion speeds
between 19 600 and 23 800 km s-1. Since the ![]() values give a
significantly lower expansion speed and a very late explosion date, we
conclude that the
values give a
significantly lower expansion speed and a very late explosion date, we
conclude that the ![]() values underestimate the true source sizes
significantly. Hence, we do not consider these values in the following
analysis. Based on the information of the two VLBI images, we
conclude that the explosion occured between 2008 January 22 and 2008
March 24. We get a lower limit for the expansion index of m>0.65, and an
average expansion speed in the range of 19 600-23 800 km s-1.
values underestimate the true source sizes
significantly. Hence, we do not consider these values in the following
analysis. Based on the information of the two VLBI images, we
conclude that the explosion occured between 2008 January 22 and 2008
March 24. We get a lower limit for the expansion index of m>0.65, and an
average expansion speed in the range of 19 600-23 800 km s-1.
Table 2: Source sizes, expansion speeds, a lower limit for the expansion index m, and explosion dates (in 2008).
Since the CPM source sizes should be very close to the real sizes, the
expansion speed is very close to the average value of all
methods (![]() 22 000 km s-1, excluding
22 000 km s-1, excluding ![]() as discussed above),
and the explosion date is in very good agreement with the light curve
modeling, we adopt these values. The formal errors in our various fits are
exceedingly small (of the order of 20
as discussed above),
and the explosion date is in very good agreement with the light curve
modeling, we adopt these values. The formal errors in our various fits are
exceedingly small (of the order of 20 ![]() as). Since the systematic errors
from the different methods are much larger, the spread in velocities
(
as). Since the systematic errors
from the different methods are much larger, the spread in velocities
(![]() 1650 km s-1) and explosion dates (
1650 km s-1) and explosion dates (![]() 7 days) better reflects our uncertainties.
7 days) better reflects our uncertainties.
This expansion speed is much higher than the values reported in Brunthaler et al. (2009b). There are three reasons for this discrepancy. Firstly, the lower value was based on a preliminary data reduction, without the data from the phased VLA and without the geodetic block corrections. Secondly, the radius of the brightest emission was used as an approximation for the source size. However, as shown here, this method underestimates the true expansion speed. Thirdly, the sizes were measured by hand from the images and this gave an overestimated size in the first epoch, where the source was still very compact.
4.3 Expansion center, self-similarity, and anisotropic expansion
The ring is not symmetric and the brightest region in both images is the south-western part of the shell. This could be caused either by an asymmetry in the explosion or in the circumstellar medium (CSM), i.e. a clump with higher density in the southwest. A clumpy CSM is very common for red supergiant stars (e.g. Smith et al. 2009) which are likely progenitors for this supernova. Furthermore, a comparison of the 5 GHz light curve and the available 22 GHz data shows evidence for a clumpy CSM (Marchili et al. 2010).
![\begin{figure}
\par\includegraphics[width=9cm,clip]{14133f7.eps}\vspace*{2.6mm}
\end{figure}](/articles/aa/full_html/2010/08/aa14133-10/img61.png)
|
Figure 7:
Cross-correlation coefficient,
|
| Open with DEXTER | |
As mentioned in Sect. 4.1.1,
we also estimated the central position of the ring. We do not detect
any significant shift in the position, with an upper limit of ![]() 50
50 ![]() as in right ascension and 100
as in right ascension and 100 ![]() as
in declination. To verify the relative astrometric accuracy of the
positions, we also imaged the three extragalactic background sources
0945+6924, 0948+6848, and 1004+6936. The average position change
between the two observations of M 81* relative to these quasars is
as
in declination. To verify the relative astrometric accuracy of the
positions, we also imaged the three extragalactic background sources
0945+6924, 0948+6848, and 1004+6936. The average position change
between the two observations of M 81* relative to these quasars is
![]() as in right ascension and
as in right ascension and ![]()
![]() as in declination, where the uncertainties are the standard deviation
as in declination, where the uncertainties are the standard deviation![]() .
Thus, we can rule out that any significant position shift is introduced
by jet motion in M 81*. We note that the angular separation of
M 82 to M 81* is not larger than the angular separation
between M 81* and the three background quasars. Hence, systematic
errors in the astrometry should be similar for all sources.
.
Thus, we can rule out that any significant position shift is introduced
by jet motion in M 81*. We note that the angular separation of
M 82 to M 81* is not larger than the angular separation
between M 81* and the three background quasars. Hence, systematic
errors in the astrometry should be similar for all sources.
According to Chevalier (1982), the expansion of a supernova is self-similar, i.e., the source structure remains unaltered regardless of the source size. This model of a self-similar expansion has been extensively tested with SN 1993J (e.g. Bartel et al. 2002; Marcaide et al. 1997,2009a). Although some deviations from self-similarity were found in the expansion of SN 1993J, this supernova kept its structure nearly self-similar for more than a decade. If the expansion of SN 2008iz was also self-similar between our two VLBI epochs, the VLBI images obtained should be equal (regardless of the global flux density scale) if we scale the first image to the size of the second one and use the same convolving beam for both images. However, the result of scaling the first VLBI image, to compare to the second one, depends on the point in the image that is chosen as the center of expansion. Therefore, a direct comparison between the images, to check the self-similarity in the expansion, is not possible if the coordinates of the expansion center of the supernova are not known.
In order to determine the coordinates of the expansion center of the supernova independently from the method described above, we computed different scaled versions of the image of the first VLBI epoch using different centers of expansion. The scaled images were obtained by scaling the positions of the CLEAN components of the model, according to the ratios of the supernova sizes reported in the previous section. We then used the same beam to convolve the CLEAN model of the second epoch and the resulting (scaled) CLEAN models of the first epoch. Finally, we compared the resulting image of the second epoch with the resulting (scaled) images of the first epoch by computing the cross correlation between both images:
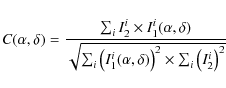
|
(2) |
where Ii2 is the ith pixel of the image of the second epoch and
Additionally, the value of
![]() at its maximum is a measure of
the degree of self-similarity (and/or anisotropy) in the expansion. The maximum
cross-correlation of the images is 0.98, if we use the CPM size to expand the
image of the first epoch, and 0.97, if we use instead the model-fitting size.
These values are very close to 1, which is the case of a perfect self-similar
expansion. Therefore, we conclude that the expansion of SN 2008iz was
self-similar to a high degree between our two VLBI epochs.
at its maximum is a measure of
the degree of self-similarity (and/or anisotropy) in the expansion. The maximum
cross-correlation of the images is 0.98, if we use the CPM size to expand the
image of the first epoch, and 0.97, if we use instead the model-fitting size.
These values are very close to 1, which is the case of a perfect self-similar
expansion. Therefore, we conclude that the expansion of SN 2008iz was
self-similar to a high degree between our two VLBI epochs.
5 Discussion
5.1 Column density and extinction
The non-detection of SN 2008iz in the optical, infrared, and
X-rays indicates that it exploded inside or behind a very dense cloud.
Indeed, the 12CO (
![]() )
line intensity map in Weiß et al. (2001) shows a prominent cloud exactly at the position of the supernova (Fig. 8). The line intensity at the position of SN 2008iz is
)
line intensity map in Weiß et al. (2001) shows a prominent cloud exactly at the position of the supernova (Fig. 8). The line intensity at the position of SN 2008iz is ![]() 1800 K km s-1. Using the Galactic conversion factor
1800 K km s-1. Using the Galactic conversion factor
![]() cm-2 (K km s-1)-1, this corresponds to a H2 column density
cm-2 (K km s-1)-1, this corresponds to a H2 column density
![]() of
of ![]()
![]() cm-2. However, Weiß et al. (2001) find much smaller and spatially variable conversion factors from radiative transfer calculations, that lead to smaller H2 column densities. At the position of SN 2008iz, their conversion factor is
cm-2. However, Weiß et al. (2001) find much smaller and spatially variable conversion factors from radiative transfer calculations, that lead to smaller H2 column densities. At the position of SN 2008iz, their conversion factor is ![]()
![]() cm-2 (K km s-1)-1 (their Fig. 10). This leads to an H2 column density of
cm-2 (K km s-1)-1 (their Fig. 10). This leads to an H2 column density of ![]()
![]() cm-2. However, the CO observations were performed with a linear resolution of
cm-2. However, the CO observations were performed with a linear resolution of ![]() 25 pc. Thus, it is possible that the supernova is located
behind a smaller cloud with much higher column density. We also note that the 12CO line
intensity at the position of the MERLIN transient is almost 4 times smaller (
25 pc. Thus, it is possible that the supernova is located
behind a smaller cloud with much higher column density. We also note that the 12CO line
intensity at the position of the MERLIN transient is almost 4 times smaller (![]() 500 K km s-1).
500 K km s-1).
![\begin{figure}
\par\includegraphics[width=9cm,clip]{14133f8.eps}
\vspace*{5mm}%
\end{figure}](/articles/aa/full_html/2010/08/aa14133-10/img73.png)
|
Figure 8:
12CO (
|
| Open with DEXTER | |
Taking the latter value (
![]() cm-2) for
cm-2) for
![]() and assuming that all of the column is between SN 2008iz and us, we derive a visual extinction,
and assuming that all of the column is between SN 2008iz and us, we derive a visual extinction, ![]() ,
of 24.4 mag. Here we have used the relation between optical extinction and atomic hydrogen column density, N(
,
of 24.4 mag. Here we have used the relation between optical extinction and atomic hydrogen column density, N(![]() ), derived by Güver & Özel (2009) from X-ray absorption data of a sample of Galactic SNRs, and assumed that all hydrogen is in molecular form, i.e., N(
), derived by Güver & Özel (2009) from X-ray absorption data of a sample of Galactic SNRs, and assumed that all hydrogen is in molecular form, i.e., N(
![]() ). Such a high value of the extinction would explain the lack of an optical counterpart.
). Such a high value of the extinction would explain the lack of an optical counterpart.
The derived extinction is much higher than toward SN 1993J, for which Richmond et al. (1994) discuss values of
![]() and 1.0 mag. With the extinction law given by Cardelli et al. (1989),
and 1.0 mag. With the extinction law given by Cardelli et al. (1989),
![]() ,
we calculate 2.8 mag for the K-band (
,
we calculate 2.8 mag for the K-band (![]() m) extinction.
Fraser et al. (2009) report an even higher K-band extinction of up to 11 mag based on their non-detection (
m) extinction.
Fraser et al. (2009) report an even higher K-band extinction of up to 11 mag based on their non-detection (![]() upper limit on the absolute K-band
magnitude of -5 mag) and the assumption that the infrared light curve
of SN 2008iz behaves similarly to that of SN 1993J. Thus,
upper limit on the absolute K-band
magnitude of -5 mag) and the assumption that the infrared light curve
of SN 2008iz behaves similarly to that of SN 1993J. Thus,
SN 2008iz is either very weak in the infrared, compared to SN 1993J, or behind a smaller but even denser cloud than estimated here.
5.2 Expansion velocity and synchrotron self-absorption
Chevalier (1998) proposed a way to
estimate the mean expansion velocity of a supernova based on the
radio-light curve and assuming that synchrotron self-absorption (SSA)
dominates the light curve at the peak. If SSA is not the dominant
absorption process at the peak of the light curve, then the estimate of
the expansion velocity is a lower bound to the real expansion velocity
of the radio shell. Following Chevalier (1998),
the estimate mean expansion velocity at the peak of the radio-light
curve (assuming dominant SSA) is given by the following equation:
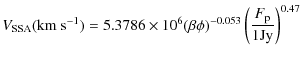
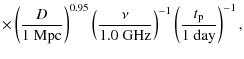
where
For SN2008iz, Eq. (3) yields a mean expansion velocity (depending
on k) in the range
8100-11 800 km s-1 at the peak
of the 5 GHz radio light curve. Using an expansion index of 0.89,
these velocities translate into a mean expansion velocity in the
range
7000-10 300 km s-1 on 2009 April 27.
This range of velocities is a factor ![]() 2 smaller than the
velocities estimated from our VLBI observations, thus indicating
that, in contrast to the case of SN1993J, SSA may not be
the dominant absorption mechanism in the SN2008iz radio emission.
This is also consistent with the results in
Marchili et al. (2010) who were able to model the radio light
curve of SN2008iz assuming that SSA effects are much smaller than free-free
absorption (FFA) during the whole supernova expansion.
2 smaller than the
velocities estimated from our VLBI observations, thus indicating
that, in contrast to the case of SN1993J, SSA may not be
the dominant absorption mechanism in the SN2008iz radio emission.
This is also consistent with the results in
Marchili et al. (2010) who were able to model the radio light
curve of SN2008iz assuming that SSA effects are much smaller than free-free
absorption (FFA) during the whole supernova expansion.
5.3 Comparison with other type II radio supernovae
Table 3: Comparison between SN 1993J and SN 2008iz.
Estimates of the expansion velocities of other type II radio supernovae
have been estimated from VLBI observations, and very different results
have been obtained. For instance, the mean expansion velocity of
SN 1979C during the first year after explosion has been estimated to be ![]() 10 000-11 000 km s-1 (Bartel & Bietenholz 2003; Marcaide et al. 2009b); for
SN 1986J, a velocity of
10 000-11 000 km s-1 (Bartel & Bietenholz 2003; Marcaide et al. 2009b); for
SN 1986J, a velocity of ![]() 14 700 km s-1 was obtained
by Pérez-Torres et al. (2002b), while
Bietenholz et al. (2002) find 20 000 km s-1 3 month
after the explosion; Staveley-Smith et al. (1993) report a mean
expansion speed of
14 700 km s-1 was obtained
by Pérez-Torres et al. (2002b), while
Bietenholz et al. (2002) find 20 000 km s-1 3 month
after the explosion; Staveley-Smith et al. (1993) report a mean
expansion speed of ![]() 35 000 km s-1 during the first years for SN 1987A
before it slowed down to
35 000 km s-1 during the first years for SN 1987A
before it slowed down to ![]() 4800 km s-1;
for SN 2004et, the expansion velocity was >15 700 km s-1
(Martí-Vidal et al. 2007); and for SN 2008ax, an
expansion velocity as large as 52 000 km s-1 was obtained
(Martí-Vidal et al. 2009). Estimates of the
expansion velocities of other supernova remnants in M 82 (the
host galaxy of SN 2008iz) have also been reported to range
between
4800 km s-1;
for SN 2004et, the expansion velocity was >15 700 km s-1
(Martí-Vidal et al. 2007); and for SN 2008ax, an
expansion velocity as large as 52 000 km s-1 was obtained
(Martí-Vidal et al. 2009). Estimates of the
expansion velocities of other supernova remnants in M 82 (the
host galaxy of SN 2008iz) have also been reported to range
between ![]() 1500 and 11 000 km s-1 (Beswick et al. 2006).
The larger velocities above are much higher (by a
factor of 3-22) than the predicted velocities from the model of
Chevalier & Fransson (2001), based on the high
pressure expected in the interstellar medium (ISM) of M 82. The
expansion velocity reported in this paper for SN2008iz is indeed a
factor
1500 and 11 000 km s-1 (Beswick et al. 2006).
The larger velocities above are much higher (by a
factor of 3-22) than the predicted velocities from the model of
Chevalier & Fransson (2001), based on the high
pressure expected in the interstellar medium (ISM) of M 82. The
expansion velocity reported in this paper for SN2008iz is indeed a
factor ![]() 40 larger than the predicted velocities in
Chevalier & Fransson (2001), although of the same order-of-magnitude than the velocities reported in Beswick et al. (2006) for the other remnants in M 82, and the typical velocities of the other type II supernovae observed to date.
40 larger than the predicted velocities in
Chevalier & Fransson (2001), although of the same order-of-magnitude than the velocities reported in Beswick et al. (2006) for the other remnants in M 82, and the typical velocities of the other type II supernovae observed to date.
Weiler et al. (1998) find a correlation between peak radio luminosity
at 5 GHz and the time between the explosion and the peak in the 5 GHz
light curve for type II supernovae. The 5 GHz light curve of SN 2008iz from
Marchili et al. (2010) gives a peak luminosity of
![]()
![]() erg s-1 Hz-1 at
erg s-1 Hz-1 at ![]() 120 days after the
explosion. These values are well within the scatter of the correlation. Thus
it seems plausible that SN 2008iz is also a type II supernova.
120 days after the
explosion. These values are well within the scatter of the correlation. Thus
it seems plausible that SN 2008iz is also a type II supernova.
Since SN 2008iz and SN 1993J are located at very similar distances, this allows a detailed comparison between these two supernovae. Several properties of both supernovae are summarized in Table 3. The radio spectral indices, the peak radio luminosities, rise times, and early VLBI expansion velocities are similar (considering that the rise times and peak radio luminosities can vary by several orders of magnitudes for type II radio supernovae). The non-detection in X-rays of SN 2008iz can be attributed to absorption by the dense molecular cloud seen in the CO data.
6 Summary
In this paper we presented the first VLBI images, a VLA radio spectrum from 1.4 to 43 GHz, and Chandra X-ray observations of SN 2008iz. Our main results are as follows:
- The VLBI images separated by
 11 month show a shell-like structure
expanding with a velocity of 23 000 km s-1.
11 month show a shell-like structure
expanding with a velocity of 23 000 km s-1.
- The inferred expansion speed is a factor of 2 higher than expected if SSA dominates the light curve, suggesting that SSA is not important for the radio emission.
- The most likely explosion date is in mid-February 2008, but not earlier than January 22 and not later than March 24.
- We find a high degree of self-similarity between the two VLBI observations and no evidence for an asymmetric explosion.
- The VLA radio spectrum is well fitted by a broken power law with a
turnover frequency of
 GHz and a spectral index of
 in the optically thin part.
- SN 2008iz is located behind (or inside) a large molecular cloud with an
H2 column density of
 cm-2 (on a scale of 25 pc),
corresponding to a visual extinction,
cm-2 (on a scale of 25 pc),
corresponding to a visual extinction,  ,
of 24.4 mag.
,
of 24.4 mag.
- Due to the high column density, we obtain only upper limits on the
X-ray luminosity of
 and
and
 erg s-1
75 and 200 days after the explosion, which are consistent with
the X-ray luminosities of SN 1993J at similar ages. We also obtain an
upper limit for the X-ray luminosity of the second radio transient of
erg s-1
75 and 200 days after the explosion, which are consistent with
the X-ray luminosities of SN 1993J at similar ages. We also obtain an
upper limit for the X-ray luminosity of the second radio transient of
 erg s-1 (in 0.3-2.4 keV).
This work is partially based on observations with the 100-m telescope of the MPIfR (Max-Planck-Institut für Radioastronomie) at Effelsberg. MV is a fellow of the Alexander von Humboldt Foundation in Germany.
References
- Bartel, N., & Bietenholz, M. F. 2003, ApJ, 591, 301 [NASA ADS] [CrossRef] [Google Scholar]
- Bartel, N., Bietenholz, M. F., Rupen, M. P., et al. 2000, Science, 287, 112 [NASA ADS] [CrossRef] [PubMed] [Google Scholar]
- Bartel, N., Bietenholz, M. F., Rupen, M. P., et al. 2002, ApJ, 581, 404 [NASA ADS] [CrossRef] [Google Scholar]
- Bartel, N., Bietenholz, M. F., Rupen, M. P., & Dwarkadas, V. V. 2007, ApJ, 668, 924 [NASA ADS] [CrossRef] [Google Scholar]
- Beswick, R. J., Riley, J. D., Marti-Vidal, I., et al. 2006, MNRAS, 369, 1221 [NASA ADS] [CrossRef] [Google Scholar]
- Beswick, R. J., Muxlow, T. W. B., Pedlar, A., et al. 2009, The Astronomer's Telegram, 2060, 1 [NASA ADS] [Google Scholar]
- Bietenholz, M. F., Bartel, N., & Rupen, M. P. 2001, ApJ, 557, 770 [NASA ADS] [CrossRef] [Google Scholar]
- Bietenholz, M. F., Bartel, N., & Rupen, M. P. 2002, ApJ, 581, 1132 [NASA ADS] [CrossRef] [Google Scholar]
- Bietenholz, M. F., Bartel, N., & Rupen, M. P. 2003, ApJ, 597, 374 [NASA ADS] [CrossRef] [Google Scholar]
- Brunthaler, A., Menten, K. M., Reid, M. J., et al. 2009a, A&A, 499, L17 [NASA ADS] [CrossRef] [EDP Sciences] [Google Scholar]
- Brunthaler, A., Menten, K. M., Reid, M. J., et al. 2009b, Central Bureau Electronic Telegrams, 1803, 1 [NASA ADS] [Google Scholar]
- Brunthaler, A., Reid, M. J., & Falcke, H. 2005, in Future Directions in High Resolution Astronomy, ASP Conf. Ser., 340, 455 [Google Scholar]
- Burrows, D. N., Hill, J. E., Nousek, J. A., et al. 2005, Space Sci. Rev., 120, 165 [NASA ADS] [CrossRef] [Google Scholar]
- Cappi, M., Palumbo, G. G. C., Pellegrini, S., & Persic, M. 1999, Astron. Nachr., 320, 248 [NASA ADS] [CrossRef] [Google Scholar]
- Cardelli, J. A., Clayton, G. C., & Mathis, J. S. 1989, ApJ, 345, 245 [NASA ADS] [CrossRef] [Google Scholar]
- Chevalier, R. A. 1982, ApJ, 258, 790 [Google Scholar]
- Chevalier, R. A. 1998, ApJ, 499, 810 [NASA ADS] [CrossRef] [Google Scholar]
- Chevalier, R. A., & Fransson, C. 2001, ApJ, 558, L27 [NASA ADS] [CrossRef] [Google Scholar]
- Fox, D. W., Lewin, W. H. G., Fabian, A., et al. 2000, MNRAS, 319, 1154 [NASA ADS] [CrossRef] [Google Scholar]
- Fraser, M., Smartt, S. J., Crockett, M., et al. 2009, The Astronomer's Telegram, 2131, 1 [NASA ADS] [Google Scholar]
- Freedman, W. L., Hughes, S. M., Madore, B. F., et al. 1994, ApJ, 427, 628 [NASA ADS] [CrossRef] [Google Scholar]
- Gehrels, N., Chincarini, G., Giommi, P., et al. 2004, ApJ, 611, 1005 [NASA ADS] [CrossRef] [Google Scholar]
- Güver, T., & Özel, F. 2009, MNRAS, 400, 2050 [NASA ADS] [CrossRef] [Google Scholar]
- Marcaide, J. M., Alberdi, A., Ros, E., et al. 1995, Science, 270, 1475 [NASA ADS] [CrossRef] [Google Scholar]
- Marcaide, J. M., Alberdi, A., Ros, E., et al. 1997, ApJ, 486, L31 [NASA ADS] [CrossRef] [Google Scholar]
- Marcaide, J. M., Martí-Vidal, I., Alberdi, A., et al. 2009a, A&A, 505, 927 [NASA ADS] [CrossRef] [EDP Sciences] [Google Scholar]
- Marcaide, J. M., Martí-Vidal, I., Perez-Torres, M. A., et al. 2009b, A&A, 503, 869 [NASA ADS] [CrossRef] [EDP Sciences] [Google Scholar]
- Marchili, N., Marti-Vidal, I., Brunthaler, A., et al. 2010, A&A, 509, A47 [NASA ADS] [CrossRef] [EDP Sciences] [Google Scholar]
- Martí-Vidal, I., Marcaide, J. M., Alberdi, A., et al. 2007, A&A, 470, 1071 [NASA ADS] [CrossRef] [EDP Sciences] [Google Scholar]
- Martí-Vidal, I., Marcaide, J. M., Alberdi, A., et al. 2009, A&A, 499, 649 [NASA ADS] [CrossRef] [EDP Sciences] [Google Scholar]
- Muxlow, T. W. B., Beswick, R. J., Pedlar, A., et al. 2009, The Astronomer's Telegram, 2073, 1 [NASA ADS] [Google Scholar]
- Muxlow, T. W. B., Beswick, R. J., Garrington, S. T., et al. 2010, MNRAS, 404, L109 [NASA ADS] [Google Scholar]
- Pacholczyk, A. G. (ed.) 1970, Radio astrophysics. Nonthermal processes in galactic and extragalactic sources [Google Scholar]
- Pérez-Torres, M. A., Alberdi, A., & Marcaide, J. M. 2001, A&A, 374, 997 [NASA ADS] [CrossRef] [EDP Sciences] [Google Scholar]
- Pérez-Torres, M. A., Alberdi, A., & Marcaide, J. M. 2002a, A&A, 394, 71 [NASA ADS] [CrossRef] [EDP Sciences] [Google Scholar]
- Pérez-Torres, M. A., Alberdi, A., Marcaide, J. M., et al. 2002b, MNRAS, 335, L23 [NASA ADS] [CrossRef] [Google Scholar]
- Reid, M. J., & Brunthaler, A. 2004, ApJ, 616, 872 [NASA ADS] [CrossRef] [Google Scholar]
- Richmond, M. W., Treffers, R. R., Filippenko, A. V., et al. 1994, AJ, 107, 1022 [NASA ADS] [CrossRef] [Google Scholar]
- Shepherd, M. C., Pearson, T. J., & Taylor, G. B. 1995, in BAAS, ed. B. J. Butler, & D. O. Muhleman, 27, 903 [Google Scholar]
- Smith, N., Hinkle, K. H., & Ryde, N. 2009, AJ, 137, 3558 [NASA ADS] [CrossRef] [Google Scholar]
- Staveley-Smith, L., Briggs, D. S., Rowe, A. C. H., et al. 1993, Nature, 366, 136 [NASA ADS] [CrossRef] [Google Scholar]
- van Dyk, S. D., Weiler, K. W., Sramek, R. A., Rupen, M. P., & Panagia, N. 1994, ApJ, 432, L115 [NASA ADS] [CrossRef] [Google Scholar]
- Weiler, K. W., van Dyk, S. D., Montes, M. J., Panagia, N., & Sramek, R. A. 1998, ApJ, 500, 51 [NASA ADS] [CrossRef] [Google Scholar]
- Weiler, K. W., Panagia, N., Montes, M. J., & Sramek, R. A. 2002, ARA&A, 40, 387 [NASA ADS] [CrossRef] [Google Scholar]
- Weiß, A., Neininger, N., Hüttemeister, S., & Klein, U. 2001, A&A, 365, 571 [NASA ADS] [CrossRef] [EDP Sciences] [Google Scholar]
- Zimmermann, H., & Aschenbach, B. 2003, A&A, 406, 969 [NASA ADS] [CrossRef] [EDP Sciences] [Google Scholar]
Footnotes
- ...
NRAO
![[*]](/icons/foot_motif.png)
- The National Radio Astronomy Observatory is a facility of the National Science Foundation operated under cooperative agreement by Associated Universities, Inc.
- ... location
- Given the pile-up and uncertainty in the XRT astrometry on the order of a few arcseconds, attempting to separate any supernova flux from the other flux is practically impossible.
- ... deviation
- These values give 1
 upper limits on the proper motion of M 81 of 260 km s-1 in right ascension and 1270 km s-1 in declination.
All Tables
Table 1: Flux densities of SN 2008iz and two other supernova remnants in M 82 from the VLA observation on 2009 April 27.
Table 2: Source sizes, expansion speeds, a lower limit for the expansion index m, and explosion dates (in 2008).
Table 3: Comparison between SN 1993J and SN 2008iz.
All Figures
|
|
Figure 1:
HSA contour plots of SN 2008iz at 22 GHz in May 2008 ( top) and April 2009 ( bottom). Contours start at 0.3 mJy ( top), 0.1 mJy ( bottom) and increase with |
| Open with DEXTER | |
| In the text | |
|
|
Figure 2: Spectrum of SN 2008iz taken with the VLA on 2009 April 27. Also shown are a single power-law fit (dotted line) and two broken power-law fits with a spectral index of 2.5 (solid line) and 4.5 (dash-dotted line) in the optically thick part. |
| Open with DEXTER | |
| In the text | |
|
|
Figure 3: Intensity of concentric rings of widths 0.05 mas in the images from 2008 May 03 and 2009 April 08. The flux densities in the second observation were scaled by a factor of 5. The vertical lines mark the position of the peak and the radius where the intensity is 50% of the peak level. |
| Open with DEXTER | |
| In the text | |
|
|
Figure 4:
HSA images at 22 GHz of SN 2008iz in May 2008 ( top) and April 2009 ( middle and bottom). The bottom
image is convolved with a dynamic beam of 0.99 mas (i.e. the ratios of
beam size and source size are identical in the top and bottom images).
The rings denote the best fitted positions and radii from CPM in both
epochs, i.e. 320 and 1580 |
| Open with DEXTER | |
| In the text | |
|
|
Figure 5:
The width of the intensity profile as a function of position offset
(relative to a reference pixel) in the observation on 2008 May 03. One
pixel corresponds to 0.05 mas. Shown are position offsets in right
ascension (+) and declination ( |
| Open with DEXTER | |
| In the text | |
|
|
Figure 6: Solid lines: radial intensity profiles of SN 2008iz at the two VLBI epochs, computed using different convolving beams (1.0, 1.1, 1.2, 1.3, and 1.4 times the source radius at each epoch). The radial positions of the common points at each epoch (see Sect. 4.1.2) are marked with dashed lines. |
| Open with DEXTER | |
| In the text | |
|
|
Figure 7:
Cross-correlation coefficient,
|
| Open with DEXTER | |
| In the text | |
|
|
Figure 8:
12CO (
|
| Open with DEXTER | |
| In the text | |
Copyright ESO 2010
Current usage metrics show cumulative count of Article Views (full-text article views including HTML views, PDF and ePub downloads, according to the available data) and Abstracts Views on Vision4Press platform.
Data correspond to usage on the plateform after 2015. The current usage metrics is available 48-96 hours after online publication and is updated daily on week days.
Initial download of the metrics may take a while.