| Issue |
A&A
Volume 514, May 2010
|
|
|---|---|---|
| Article Number | A49 | |
| Number of page(s) | 6 | |
| Section | Atomic, molecular, and nuclear data | |
| DOI | https://doi.org/10.1051/0004-6361/200913642 | |
| Published online | 12 May 2010 | |
Methane clathrate hydrate infrared spectrum
II. Near-infrared overtones, combination modes and cages assignments
E. Dartois![]() - D. Deboffle - M. Bouzit
- D. Deboffle - M. Bouzit
Institut d'Astrophysique Spatiale, UMR-8617, Université Paris-Sud, Bât. 121, 91405 Orsay, France
Received 11 November 2009 / Accepted 28
January 2010
Abstract
Context. Recently, we recorded the infrared spectrum
of the methane clathrate hydrate stretching mode at low temperature, a
caged compound of possible interest for solar system studies as well as
interstellar ice mantles.
Aims. We provide a practical infrared spectroscopic
identification for methane clathrate hydrate to examine its
astrophysical presence or absence. We investigate the crystal field
induced shifts, and assign the different transitions to the different
encaged molecules environments in this clathrate hydrate.
Methods. A methane clathrate crystal is produced in
an infrared transmitting moderate-pressure closed cell. Using Fourier
transform infrared (FTIR) spectroscopy, the overtones (![]() ,
,
![]() )
and combination modes (
)
and combination modes (
![]() ,
,
![]() ,
,
![]() ,
,
![]() ,
,
![]() ,
,
![]() ,
,
![]() )
falling in the 6000-3000 cm-1 (
)
falling in the 6000-3000 cm-1 (![]() 1.65-3.4
1.65-3.4 ![]() m) and their
temperature behaviour are investigated. In addition, non-astrophysical
CH4/CF4 gas mixtures are
used to build clathrates with different methane large and small cage
occupancies to help in assignments.
m) and their
temperature behaviour are investigated. In addition, non-astrophysical
CH4/CF4 gas mixtures are
used to build clathrates with different methane large and small cage
occupancies to help in assignments.
Results. Combination modes show the two distinct
cages and the quasi-free rotor low temperature ro-vibrational structure
expected for methane clathrate hydrates. A comparison with the pure
phase I is performed. Implications for methane clathrate hydrate
detection are clearly identified.
Conclusions. Solid methane actual remote
observations of solar system objects surfaces do not display the
clathrate hydrates' specific shift and occupancy signatures.
Observationnally, a search for their infrared spectroscopic specific
signatures should be performed, focusing on thermodynamically
favourable objects like trans- neptunian objects (TNOs) or recently
exposed (e.g. fresh impact) planet (or their satellites) surfaces. On
the modeling side, efforts must be undertaken to progressively
implement clathrate formation kinetics.
Key words: line: identification - comets: general - planets ans satellites: general - ISM: lines and bands - dust, extinction - molecular data
1 Introduction
The existence of clathrate hydrate dates back to the early 19th century, when Faraday (1823) defined the chlorine clathrate hydrate discovered by Davy in 1810. Since then, a huge amount of effort has been made to study clathrate hydrates not only for the intrinsinc scientific interest in this new phase, but also because they were shown in the last century to be responsible for plugs in pipelines, forming ice stoppers endangering gas and oil field explotations as well as the life of the workers. Methane clathrate hydrate provides a (although difficult to exploit) future energy resource in addition to petroleum, as it is an important constituent of the permafrost. Clathrate hydrates could also provide an ecologically clean storage medium for small molecules, and in particular for safe hydrocarbons or hydrogen transportation or for engine applications. Their properties can also be used to trigger phase separation or purification for chemical constituents in mixed phases, and are promising to sequestrate greenhouse gases like CO2 (Chatti et al. 2005, and references therein).
Clathrate hydrate thus enters into diverse applications, and space astrophysics is no exception to the rule, as they were early proposed to explain the anomalous desorption behaviour of gaseous parent molecules in comets (e.g. Delsemme & Swings 1952), by providing a dissociation pressure curve intermediate between the pure compound sublimation equilibrium and the water ice phase. It was subsequently applied to understand other objects of the solar system, from planets to their moons and outer solar nebula planetesimals (e.g. Lunine & Stevenson1985; Sill & Wilkening 1978; Miller 1961). Nowdays it is the source for many astrophysical investigations with application ranging from explaining part of giant planets (and/or their satellites), observed molecular abundances (e.g. Hersant et al. 2004), Mars carbon dioxide clathrate hydrates (e.g. Schmitt et al. 2003; Kuhs & Klapproth 2000), or ethane sequestration on Titan (Mousis & Schmitt 2008). We experimentally investigate the near to mid-infrared spectroscopic signature of type I methane clathrate hydrate, as well as CH4/CF4 clathrate mixtures to decipher the different cage assignments. We describe the experiments in Sect. 2 and the associated results in Sect. 3. We discuss in Sect. 4 the spectra and cage identification and Sect. 5 discuss the astrophysical implications for clathrate hydrate observations. We then conclude.
2 Experiments
A new evacuable enclosed cell was built to supersede the cell used in our previous clathrate hydrate experimental setup (Dartois & Deboffle 2008). The two thick (4 mm) lateral ZnSe or Sapphire windows diameter were reduced to 13 mm diameter and were mounted so that the high pressure acting inside improved their sealing by squeezing their indium gasket. In addition, the copper cell was optically polished and subsequently gold-coated by electrolysis to improve its reflectivity in the infrared, ensuring a lower heat load. The cell was thermally coupled to a liquid He transfer cold finger, placed in a high vacuum-evacuated cryostat ( P < 10-7 mbar). A stainless-steel injection tube for the entrance or evacuation of the gases was sealed at the bottom of the cell and ended with a four port injector inside. An image of the cell is shown in Fig. 1.
![\begin{figure}
\par\includegraphics[angle=180,width=5cm,clip]{13642fg1.eps}
\end{figure}](/articles/aa/full_html/2010/06/aa13642-09/img13.png)
|
Figure 1: Low temperature moderate pressure closed cell used to nucleate and characterise the methane clathrate hydrate. The top is attached to a liquid He transfer cold finger, masked by a thermal shield cylinder. The lower injection tube is used both to inject gaseous water and methane as well as to evacuate it once the hydrate is formed. The two cylindrical gold coated copper part support the ZnSe windows, offering a 3.5 mm radius aperture to the infrared beam. |
| Open with DEXTER | |
The formation of the methane hydrate follows a procedure described previously (Dartois & Deboffle 2008), in which the ice film is formed first and pressurized with methane gas during approximately two days in a region of the (P, T) diagram above the equilibrium curve for methane clathrate hydrate. Then the temperature is decreased while the excess methane is progressively evacuated and care is taken to maintain the system below the vaporization or sublimation of the methane phase diagram. Methane clathrate hydrate near-infrared FTIR spectra were recorded with a Bruker IFS 66v at a resolution of 0.5 cm-1 and 3 terms Blackman-Harris apodization, with a globar IR source, KBr beamsplitter and an HgCdTe detector cooled at LN2. The stretching mode region spectrum is the one already discussed in Dartois & Deboffle (2008). Pure methane spectra were recorded in its two phases I (25K) and II (5.6K) in the same cell for comparison.
Mixed methane-carbon tetrafluoride clathrate hydrates were
produced by maintaining the cell above the equilibrium pressure curve
measured by Mooijer-van den Heuvel et al. (2006).
Experiments with CH4/CF4
gas molar ratios of 5%, 15% and 50%, provided by Messer special gases
(with an uncertainty of 2% relative to the methane content) were
injected into the cell. CF4 is not
astrophysically relevant in such high proportions. The aim of these
mixtures is to modify cage occupancies in the clathrate, once formed,
as will be discussed in the results. The set of experiments were
conducted over more than six months, and the cell thermal shield
insulation was progressively improved with respect to the initial
methane hydrate experiments. Thus the lowest temperatures reached
varied from 7 K for the methane clathrate stretching mode
(Dartois & Deboffle 2008)
to as low as ![]() 5.05 K
for the CH4/CF4 50% molar
ratio. The resolution for these FTIR spectra also varied and was set to
0.4 cm-1 and three terms
Blackman-Harris apodization for the 5% and 15% mixtures and
0.15 cm-1 and four points apodization
for the 50% mixture, respectively. They were recorded in different
source configurations (either globar IR source or tungsten lamp), CaF2
or KBr beamsplitter and an InSb detector cooled at LN2
to optimise the signal-to-noise in specific wavelength regions. A
summary of the (P, T) formation
conditions is given in Table 3 in the
discussion.
5.05 K
for the CH4/CF4 50% molar
ratio. The resolution for these FTIR spectra also varied and was set to
0.4 cm-1 and three terms
Blackman-Harris apodization for the 5% and 15% mixtures and
0.15 cm-1 and four points apodization
for the 50% mixture, respectively. They were recorded in different
source configurations (either globar IR source or tungsten lamp), CaF2
or KBr beamsplitter and an InSb detector cooled at LN2
to optimise the signal-to-noise in specific wavelength regions. A
summary of the (P, T) formation
conditions is given in Table 3 in the
discussion.
The clathrate ice films are sometimes of poor optical quality (i.e. not planar) as the growth of uncontrolled large clathrate crystallites in the cell deform the FTIR-probed strong water ice bands, as already shown in Fig. 2 of Dartois & Deboffle (2008) and in Fig. 2 here. The raw clathrate hydrate spectra are dominated by broad water-ice vibrational transitions, the thin lines superimposed on the water-ice features in the NIR pertaining to encaged methane related transitions. The ice deposit is grainy, and additional non-uniformity during the clathrate growth induces some scattering, giving rise to the deformed ice profile observed. This cell allows an efficient growth of clathrates, but a cell to circumvent the uncontrolled defects is being built.
![\begin{figure}
\par\includegraphics[width=9cm,clip]{13642fg2.eps}
\end{figure}](/articles/aa/full_html/2010/06/aa13642-09/img14.png)
|
Figure 2: Typical raw cell transmittance deformed spectra containing the clathrate crystallites for different CH4/CF4 used in this study, at low temperatures. |
| Open with DEXTER | |
The spectra presented are thus baseline corrected. These growing conditions prevent us from establishing absolute optical constants values, although an estimate of the near-IR relative methane transitions is possible.
![\begin{figure}
\par\includegraphics[angle=90,width=9cm,clip]{13642fg3.eps}
\end{figure}](/articles/aa/full_html/2010/06/aa13642-09/img15.png)
|
Figure 3:
Temperature-dependent spectrum for methane clathrate hydrate in the 3 |
| Open with DEXTER | |
![\begin{figure}
\par\includegraphics[angle=90,width=9cm,clip]{13642fg4.eps}
\vspace*{-2mm}
\end{figure}](/articles/aa/full_html/2010/06/aa13642-09/img16.png)
|
Figure 4:
Temperature-dependent spectrum for methane clathrate hydrate in the |
| Open with DEXTER | |
![\begin{figure}
\par\includegraphics[angle=90,width=9cm,clip]{13642fg5.eps}
\end{figure}](/articles/aa/full_html/2010/06/aa13642-09/img17.png)
|
Figure 5:
Temperature dependent spectrum for methane clathrate hydrate in the |
| Open with DEXTER | |
![\begin{figure}
\par\includegraphics[angle=90,width=9cm,clip]{13642fg6.eps}
\end{figure}](/articles/aa/full_html/2010/06/aa13642-09/img18.png)
|
Figure 6:
Lowest temperature spectrum for weak methane clathrate hydrate
transitions in the |
| Open with DEXTER | |
3 Results
3.1 Methane clathrate hydrate in the 3500-6000 cm-1 range
The CH4 clathrate hydrate baseline-corrected
near-infrared spectrum covering the ![]() ,
,
![]() ,
,
![]() ,
,
![]() modes is shown in Figs. 3-5. We
also observed at low signal-to-noise the
modes is shown in Figs. 3-5. We
also observed at low signal-to-noise the ![]() ,
,
![]() and
and ![]() combination mode range, displayed in Fig. 6 at
the lowest temperature for evident line contrast maximization. The
spectrum is compared to the phase I and II pure methane
spectra recorded in our cell at 5.6 K and 25 K
respectively, as the transition from phase II to I occurs at
20.53 K (Vogt & Pitzer 1976).
Some structures appear in the phase II spectrum because some methane
molecules are able to rotate in this phase. The observed near-infrared
and clathrate hydrate lines (and methane phase II) are given in
Table 1.
The relative integrated intensities of the measured near-infrared
transitions, normalised to the
combination mode range, displayed in Fig. 6 at
the lowest temperature for evident line contrast maximization. The
spectrum is compared to the phase I and II pure methane
spectra recorded in our cell at 5.6 K and 25 K
respectively, as the transition from phase II to I occurs at
20.53 K (Vogt & Pitzer 1976).
Some structures appear in the phase II spectrum because some methane
molecules are able to rotate in this phase. The observed near-infrared
and clathrate hydrate lines (and methane phase II) are given in
Table 1.
The relative integrated intensities of the measured near-infrared
transitions, normalised to the ![]() vibration mode, are given in Table 2 and are
compared to methane-ice values from the literature.
vibration mode, are given in Table 2 and are
compared to methane-ice values from the literature.
Table 1: Observed NIR methane phase II and clathrate hydrate lines.
Table 2: Relative NIR clathrate hydrate and methane ice integrated intensitiesa.
Table 3: Calculated cages occupancy equilibrium.
3.2 Tetrafluoromethane-methane mixed clathrate hydrates
When tetrafluoromethane-methane is used to form a mixed clathrate
hydrate, the larger Van der Waals radius of the CF4
molecule can force the system to adopt structure I with a
preferential occupancy of small (S) cages by methane and
large (L) cages by tetrafluoromethane, as shown in Kunita
et al. (2007)
with Raman spectroscopy at 291.1 K for gas CH4/CF4
molar ratios below 30% (in the 30-80% ratios, a
structure II clathrate hydrate was formed under Kunita's
experimental conditions). As a consequence, the methane CH-stretching
mode region should show large cages to small cages occupancy
variations. We chose three distinct CH4:CF4
molar gas ratios (5%, 15% and 50%) to perform experiments probing the
varying L/S occupancies. Following the analysis by Kunita
et al. (2007),
at higher temperature (291.1 K) one can expect clathrate CH4
large to small cage occupancy variations. The spectra for the three
mixed clathrates and pure CH4 clathrate in the ![]() antisymmetric stretching mode at low temperature are displayed in
Fig. 7
and the first combinations in Fig. 8.
antisymmetric stretching mode at low temperature are displayed in
Fig. 7
and the first combinations in Fig. 8.
4 Discussion
4.1 Cages identification
The overlap of large cage (
![]() 62) and
small cage (
62) and
small cage (
![]() )
methane rovibrational patterns recorded previously prevented us from
directly assign a given cage environment for the observed transitions.
The large to small cage favoured occupancy expected (2S versus 6M)
allowed us to tentatively attribute the strongest transitions in the
)
methane rovibrational patterns recorded previously prevented us from
directly assign a given cage environment for the observed transitions.
The large to small cage favoured occupancy expected (2S versus 6M)
allowed us to tentatively attribute the strongest transitions in the ![]() CH-stretching mode region to methane in the large cages (Dartois
& Deboffle 2008).
However, to confirm these assignments and improve the sensitivity to
small cage transitions, we thus forced the clathrate hydrate small
cages occupancy by using mixed clathrate properties.The relative
variation of methane infrared active transitions in CH4/CF4
mixed clathrate as compared to the pure one, shown in Figs. 7
and 8
for CH fundamental modes and first combinations, respectively, confirm
the identifications proposed. For CH stretching modes, when the
absorptions are normalized to the sharpest transitions (indicated by an
arrow labeled N for ``normalized''), the two broader ones increase with
CF4 content. The sharper transitions can thus be
attributed to CH4 molecules in large cages,
whose proportion diminishes with CF4 increase,
the others to small cage entrapped methane transitions. A relative cage
occupancy can be estimated from our spectra by integrating the peak
area ratio and normalizing to the pure methane clathrate hydrate.
CH-stretching mode region to methane in the large cages (Dartois
& Deboffle 2008).
However, to confirm these assignments and improve the sensitivity to
small cage transitions, we thus forced the clathrate hydrate small
cages occupancy by using mixed clathrate properties.The relative
variation of methane infrared active transitions in CH4/CF4
mixed clathrate as compared to the pure one, shown in Figs. 7
and 8
for CH fundamental modes and first combinations, respectively, confirm
the identifications proposed. For CH stretching modes, when the
absorptions are normalized to the sharpest transitions (indicated by an
arrow labeled N for ``normalized''), the two broader ones increase with
CF4 content. The sharper transitions can thus be
attributed to CH4 molecules in large cages,
whose proportion diminishes with CF4 increase,
the others to small cage entrapped methane transitions. A relative cage
occupancy can be estimated from our spectra by integrating the peak
area ratio and normalizing to the pure methane clathrate hydrate.
Combining CH stretch and combinations, we obtained the large
to small occupancies given in Table 3, if a
theoretical cage statistic of ![]() (100% CH4)
is assumed and the absorption intrinsic intensities of the CH4
transition remains the same in all mixtures.
(100% CH4)
is assumed and the absorption intrinsic intensities of the CH4
transition remains the same in all mixtures.
4.2 Cages occupancy modelling
In order to compare with our experimental results, we modelled the expected cage occupancies in the type I clathrate structure.
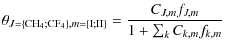
To model the cage occupancies, following the recent work of
Ballard & Sloan (2002),
the guest fraction ![]() in the hydrate is given by the following equation:
in the hydrate is given by the following equation:
|
(1) |
where J stands for CH4 or CF4 in our case, and m for either type I or II clathrate cavity. fJ,m is the fugacity of guest J in the cage m. CJ,m is the associated Langmuir constant of guest J in cavity m, and is given by
![$\displaystyle C_{J,m}=\frac{4\pi}{kT}\int_0^{R_1-a_J} \exp \left[-\frac{\sum_n \omega_{J,n}(r)}{kT}\right] r^2 {\rm d}r.$](/articles/aa/full_html/2010/06/aa13642-09/img32.png)
|
(2) |
The Langmuir constant describes the potential interaction between the encaged guest molecule and the water molecules forming the cages. In the Ballard & Sloan model, the potential is evaluated up to the first ``shell'' (
![$\displaystyle \omega_{J,m}(r)= 2\epsilon_J z_m \left[
\frac{\sigma^{12}_J}{R^{1...
...}_m r} \left(\delta^{4}_{J,m} + \frac{a_J}{R_m}\delta^{5}_{J,m} \right)
\right]$](/articles/aa/full_html/2010/06/aa13642-09/img35.png)
|
(3) |
with
![$\displaystyle \delta^N_{J,m}= \frac{1}{N} \Bigg[
\left( 1 - \frac{r}{R_m} - \fr...
...ht) ^{-N}
-\left( 1 + \frac{r}{R_m} - \frac{a_J}{R_m} \right) ^{-N}
\Bigg]\cdot$](/articles/aa/full_html/2010/06/aa13642-09/img36.png)
|
(4) |
We adopt the Mooijer-van den Heuvel et al. (2002) Kihara parameters for CF4 (
![\begin{figure}
\par\includegraphics[width=9cm,clip]{13642fg7.eps}
\end{figure}](/articles/aa/full_html/2010/06/aa13642-09/img39.png)
|
Figure 7:
Stretching-mode FTIR spectrum of the methane clathrate hydrate as
recorded at 7 K, compared to methane/carbon tetrafluoride
mixed clathrates at 5.3 K starting with a gas-phase-ratio of
5% and 15%, and 5.05 K with a gas-phase-ratio of 50%,
respectively. The transmittance of each spectrum was normalised to the
100% CH4 clathrate |
| Open with DEXTER | |
In the type I structure limit, our findings presented in
Table 3
agree relatively well with the model, which further confirms the
assignments. The assignment is now secured and can also be performed in
the near-infrared as shown in Fig. 8,
normalising the spectra to the ![]() large cage transitions.
large cage transitions.
4.3 Astrophysical implications
Some discussion was initiated in a letter dedicated to the CH stretching mode of type I methane clathrate (Dartois & Deboffle 2008). We also previously investigated the carbon dioxide type I clathrate FTIR spectrum in the near-infrared (Dartois et al. 2009) to complete mid-infrared previous measurements, and the readers are invited to include the spectroscopic implications discussed there, which remain valid.
Methane-ice transitions have been remotely detected in many
objects of the solar system. Among objects linked to the
trans-Neptunian region and Kuiper belt, CH4 is
observed in Pluto (Cruikshank et al. 1976; Metz 1976), Makemake
(2005, FY9; Barkume et al. 2005; Licandro
et al. 2006),
Eris (2003, UB313; Dumas et al. 2007), Sedna
(e.g. Barucci et al. 2005;
Trujillo et al. 2005),
Quaoar (Schaller & Brown 2007), Triton
(Cruikshank & Apt 1984).
When accessible to high resolution spectra, however, the position of
the methane lines does not correspond to the methane clathrate reported
in this article. For Pluto it is blue-shifted and shown to be embedded
into the also detected ![]() -N2
ice (e.g. Douté et al. 1999;
Grundy & Buie 2001),
whereas the shift for Makemake (Brown et al. 2007) is
intermediate between Pluto's and pure methane-ice absorptions. A
similar
-N2
ice (e.g. Douté et al. 1999;
Grundy & Buie 2001),
whereas the shift for Makemake (Brown et al. 2007) is
intermediate between Pluto's and pure methane-ice absorptions. A
similar ![]() -nitrogen
matrix-shift is observed for Triton (e.g. Cruikshank et al. 1993;
Quirico et al. 1999;
Grundy &Young 2004).
In addition, in many of these objects the water-ice does not dominate
the inventory of surface-observed species. In their core, water-ice is
probably present, and if the surface has been replenished in methane
recently by outgassing from the interior, a very strong driving force
must be at work if these species are trapped as clathrate hydrates.
-nitrogen
matrix-shift is observed for Triton (e.g. Cruikshank et al. 1993;
Quirico et al. 1999;
Grundy &Young 2004).
In addition, in many of these objects the water-ice does not dominate
the inventory of surface-observed species. In their core, water-ice is
probably present, and if the surface has been replenished in methane
recently by outgassing from the interior, a very strong driving force
must be at work if these species are trapped as clathrate hydrates.
![\begin{figure}
\par\includegraphics[width=9cm,clip]{13642fg8.eps}
\end{figure}](/articles/aa/full_html/2010/06/aa13642-09/img41.png)
|
Figure 8:
Same set of spectra as in Fig. 7 for mixed
methane/carbon tetrafluoride clathrate hydrates in the |
| Open with DEXTER | |
Closer to Earth, methane was observed recently in the atmosphere of Mars (e.g. Formisano et al. 2004, and references therein), although the methane abundance is still much debated. Some models invoke the possibility of a methane clathrate source (e.g. Chastain & Chevrier 2007; Chassefiere 2009). If that existed, it would escape direct remote infrared detection, because it must lie well under the surface to be stable on a geological time scale. The peculiar molecular and rare gas abundance pattern observed in giant planets and the late release of volatiles from comets has also been associated to possible modifications induced by clathrate hydrates trapping in the proto-solar nebula (e.g. Lunine & Stevenson1985; Gautier et al. 2001; Iro et al. 2003; Hersant et al. 2008).
At least three aspects can be explored, which touch the numerous modellings or observations of clathrates in astrophysics. The first is thermodynamics, the other two are kinetics and spectroscopy (both often neglected in constraining the astrophysical problem). Thermodynamics provides, in particular, phase diagrams with stability curves, a necessary condition to meet for the clathrates' existence, but leading to very high upper limits in models when formation kinetic is neglected. Kinetics may be the limiting factor in some astrophysical bodies. Assessing a possible presence of clathrate hydrates based on thermodynamics is a first step, and if efforts must be undertaken to measure their thermodynamic properties at astrophysical temperatures, clathrate hydrates must be concomitantly searched for observationally by spectroscopic means. The spectra indicate that at temperatures higher than 80 K, rotational lines are broadened (as compared to the sharper very low temperature transitions), a temperature closer to most of the outer solar system water-dominant ice surfaces (100-120 K Jovian and Saturnian). The shift and degeneracy lift induced by the cages should still be observable through remote sensing. In the context of outer solar system objects, their intrinsic lower temperatures increase the chance to detect clathrates (both from spectroscopy and thermodynamics) and a focus on e.g. the TNOs richest in water-ice is desirable.
5 Conclusion
We conducted pure methane and mixed methane-carbon tetrafluoride clathrate hydrate formation in a medium pressure closed-cell and analysed their FTIR spectra to explore a broad range of astrophysical spectroscopic identification. By varying the cage occupancies, which is related to the mixture ratios, we disentangled the line assignments of the different cages for methane in type I clathrate hydrate stretching modes, combination and overtones, and confirmed our previous analysis in the stretching mode range. The small and large cage type I methane clathrate transitions identification was performed for evident spectral simplification reasons at the lowest temperature reached in the experiments, which is only relevant to interstellar dense clouds environments, but drives the identification for the higher temperatures (77 K) clathrates spectra recorded closer to solar system objects conditions. Because the small cage is common to the two main clathrates structures (type I and II clathrates forms), it provides a way to unequivocally identify the presence of methane encaged in such a structure at low temperatures.
An outcome for observational astrophysics of this work is that
the wavelength range covered (1.65 to 3.4 ![]() m) by our dataset allows us to probe transitions
accessible both to planetary (combinations and overtones) reflectance
and interstellar medium (CH stretching mode) transmittance remote
spectroscopy, taking into account the distinct opacity regimes. Up to
now, the astrophysically observed methane is involved in other
interactions, sometimes less stable from the thermodynamics point of
view than clathrates.
We are currently experimentally investigating the formation of the type
II methane clathrate structure for completeness of the analysis. The
work presented here provides a spectroscopic dictionary to allow either
clathrate detection or stringent upper limit non-detections.
Immediately following, we are building low temperature laboratory
kinetic experiments, for which spectroscopy is an invaluable
constraint.
m) by our dataset allows us to probe transitions
accessible both to planetary (combinations and overtones) reflectance
and interstellar medium (CH stretching mode) transmittance remote
spectroscopy, taking into account the distinct opacity regimes. Up to
now, the astrophysically observed methane is involved in other
interactions, sometimes less stable from the thermodynamics point of
view than clathrates.
We are currently experimentally investigating the formation of the type
II methane clathrate structure for completeness of the analysis. The
work presented here provides a spectroscopic dictionary to allow either
clathrate detection or stringent upper limit non-detections.
Immediately following, we are building low temperature laboratory
kinetic experiments, for which spectroscopy is an invaluable
constraint.
We acknowledge fruitful discussions and/or technical support from A. Arondel, A. Chardin, N. Coron, B. Crane, D. Deboffle, C. Dumesnil, J.-J. Fourmond, L. d'Hendecourt, F. Langlet, T. Redon, G. Renoux as well as A. Peter for a thorough reading of the article.
References
- Baciocco, G., Calvani, P., & Cunsolo, S. 1987a, J. Chem. Phys., 87, 1913 [NASA ADS] [CrossRef] [Google Scholar]
- Baciocco, G., Calvani, P., & Cunsolo, S. 1987b, International Journal of Infrared and Millimeter Waves, 8, 923 [NASA ADS] [CrossRef] [Google Scholar]
- Ballard, A. L., & Sloan, E. D. 2002, Fluid Phase Equilibria, 194, 371 [CrossRef] [Google Scholar]
- Barkume, K. M., Brown, M. E., & Schaller, E. L. 2005, BAAS, 37, 738 [NASA ADS] [Google Scholar]
- Barucci, M. A., Cruikshank, D. P., Dotto, E., et al. 2005, A&A, 439, L1 [NASA ADS] [CrossRef] [EDP Sciences] [Google Scholar]
- Brown, M. E., Barkume, K. M., Blake, G. A., et al. 2007, AJ, 133, 284 [NASA ADS] [CrossRef] [Google Scholar]
- Brunetto, R., Caniglia, G., Baratta, G. A., & Palumbo M. E. 2008, ApJ, 686, 1480 [NASA ADS] [CrossRef] [Google Scholar]
- Calvani, P., Cunsolo, S., Lupi, S., & Nucara, A. 1992, J. Chem. Phys., 96, 7372 [NASA ADS] [CrossRef] [Google Scholar]
- Chapados, C., & Cabana, A. 1972, Can. J. Chem., 50, 3521 [NASA ADS] [CrossRef] [Google Scholar]
- Chastain, B. K., & Chevrier, V. 2007, Planet. Space Sci., 55, 1246 [Google Scholar]
- Chatti, I., Delahaye, A., Fournaison, L., & Petitet, J.-P. 2005, Energy Conversion and Managment, 46, 1333 [Google Scholar]
- Cruikshank, D. P., & Apt, J. 1984, Icarus, 58, 306 [NASA ADS] [CrossRef] [Google Scholar]
- Cruikshank, D. P., Pilcher, C. B., & Morrison, D. 1976, Science, 194, 835 [NASA ADS] [Google Scholar]
- Cruikshank, D. P., Roush, T. L., Owen, T. C., et al. 1993, Science, 261, 742 [NASA ADS] [CrossRef] [PubMed] [Google Scholar]
- Dartois, E., & Deboffle, D. 2008, A&A, 490, L19 [Google Scholar]
- Dartois, E., & Schmitt, B. 2009, A&A, 504, 869 [NASA ADS] [CrossRef] [EDP Sciences] [Google Scholar]
- Delsemme, A. H., & Swings, P. 1952, Ann. Astrophys., 15, 1 [NASA ADS] [Google Scholar]
- Douté, S., Schmitt, B., Quirico, E., et al. 1999, Icarus, 142, 421 [NASA ADS] [CrossRef] [Google Scholar]
- Dumas, C., Merlin, F., Barucci, M. A., et al. 2007, A&A, 471, 331 [NASA ADS] [CrossRef] [EDP Sciences] [Google Scholar]
- Faraday, M. 1823, On Hydrate of Chlorine, Quartly J. Sci., 15, 71 [Google Scholar]
- Formisano, V., Atreya, S., Encrenaz, T., Ignatiev, N., & Giuranna, M. 2004, Science, 306, 1758 [NASA ADS] [CrossRef] [PubMed] [Google Scholar]
- Gautier, D., Hersant, F., Mousis, O., & Lunine, J. I. 2001, ApJ, 550, L227 [NASA ADS] [CrossRef] [Google Scholar]
- Grundy, W. M., & Buie, M. W. 2001, Icarus, 153, 248 [NASA ADS] [CrossRef] [Google Scholar]
- Grundy, W. M., & Young, L. A. 2004, Icarus, 172, 455 [NASA ADS] [CrossRef] [Google Scholar]
- Grundy, W. M., Schmitt, B., & Quirico, E. 2002, Icarus, 155, 486 [NASA ADS] [CrossRef] [Google Scholar]
- Hersant, F., Gautier, D., & Lunine, J. I. 2004, Planet. Space Sci., 52, 623 [NASA ADS] [CrossRef] [Google Scholar]
- Hersant, F., Gautier, D., Tobie, G., & Lunine, J. I. 2008, Planet. Space Sci., 56, 1103 [Google Scholar]
- Iro, N., Gautier, D., Hersant, F., Bockelée-Morvan, D., & Lunine, J. I. 2003, Icarus, 161, 511 [NASA ADS] [CrossRef] [Google Scholar]
- Khanna, R. 1990, Spectrochim. Acta Part A: Mol. Spectrosc., 46, 1057 [NASA ADS] [CrossRef] [Google Scholar]
- Kobashi, K., Okada, K., & Yamamoto, T. 1977, J. Chem. Phys., 66, 5568 [NASA ADS] [CrossRef] [Google Scholar]
- Kuhs, W. F., & Klapproth, A. 2000, Second International Conference on Mars Polar Science and Exploration, 100 [Google Scholar]
- Kunita, Y., Makino, T., Sugahara, T., & Ohgaki, K. 2007, Fluid Phase Equilibria, 251, 145 [CrossRef] [Google Scholar]
- Licandro, J., Pinilla-Alonso, N., Pedani, M., et al. 2006, A&A, 445, L35 [NASA ADS] [CrossRef] [EDP Sciences] [Google Scholar]
- Lunine, J. I., & Stevenson, D. J. 1985, ApJS, 58, 493 [NASA ADS] [CrossRef] [Google Scholar]
- Metz, W. D. 1976, Science, 192, 362 [NASA ADS] [CrossRef] [PubMed] [Google Scholar]
- Miller, S. L. 1961, Proceedings of the National Academy of Science, 47, 1798 [Google Scholar]
- Mooijer-van den Heuvel, M. M., Peters C. J., & de Swaan Arons, J. 2002, Fluid Phase Equilibria, 172, 73 [CrossRef] [Google Scholar]
- Mooijer-van den Heuvel, M. M., Sawirjo, N. M., & Peters C. J. 2006, Fluid Phase Equilibria, 241, 124 [CrossRef] [Google Scholar]
- Mousis, O., & Schmitt, B. 2008, ApJ, 677, L67 [NASA ADS] [CrossRef] [Google Scholar]
- Quirico, E., & Schmitt, B. 1997, Icarus, 127, 357 [Google Scholar]
- Quirico, E., Doute, S., Schmitt, B., et al. 1999, Icarus, 139, 159 [NASA ADS] [CrossRef] [Google Scholar]
- Schaller, E. L., & Brown, M. E. 2007, ApJ, 670, L49 [NASA ADS] [CrossRef] [Google Scholar]
- Schmitt, B., Mulato, L., & Douté, S. 2003, Third International Conference on Mars Polar Science and Exploration, 8073 [Google Scholar]
- Sill, G. T., & Wilkening, L. 1978, Icarus, 33, 13 [NASA ADS] [CrossRef] [Google Scholar]
- Trujillo, C. A., Brown, M. E., Rabinowitz, D. L., & Geballe, T. R. 2005, ApJ, 627, 1057 [NASA ADS] [CrossRef] [Google Scholar]
- Vogt, G. J., & Pitzer, K. S. 1976, J. Chem. Thermodynam., 8, 1011 [CrossRef] [Google Scholar]
Footnotes
- ... Dartois
![[*]](/icons/foot_motif.png)
- Part of the equipment used in this work has been financed by the French INSU-CNRS program ``Physique et Chimie du Milieu Interstellaire'' (PCMI).
All Tables
Table 1: Observed NIR methane phase II and clathrate hydrate lines.
Table 2: Relative NIR clathrate hydrate and methane ice integrated intensitiesa.
Table 3: Calculated cages occupancy equilibrium.
All Figures
|
|
Figure 1: Low temperature moderate pressure closed cell used to nucleate and characterise the methane clathrate hydrate. The top is attached to a liquid He transfer cold finger, masked by a thermal shield cylinder. The lower injection tube is used both to inject gaseous water and methane as well as to evacuate it once the hydrate is formed. The two cylindrical gold coated copper part support the ZnSe windows, offering a 3.5 mm radius aperture to the infrared beam. |
| Open with DEXTER | |
| In the text | |
|
|
Figure 2: Typical raw cell transmittance deformed spectra containing the clathrate crystallites for different CH4/CF4 used in this study, at low temperatures. |
| Open with DEXTER | |
| In the text | |
|
|
Figure 3:
Temperature-dependent spectrum for methane clathrate hydrate in the 3 |
| Open with DEXTER | |
| In the text | |
|
|
Figure 4:
Temperature-dependent spectrum for methane clathrate hydrate in the |
| Open with DEXTER | |
| In the text | |
|
|
Figure 5:
Temperature dependent spectrum for methane clathrate hydrate in the |
| Open with DEXTER | |
| In the text | |
|
|
Figure 6:
Lowest temperature spectrum for weak methane clathrate hydrate
transitions in the |
| Open with DEXTER | |
| In the text | |
|
|
Figure 7:
Stretching-mode FTIR spectrum of the methane clathrate hydrate as
recorded at 7 K, compared to methane/carbon tetrafluoride
mixed clathrates at 5.3 K starting with a gas-phase-ratio of
5% and 15%, and 5.05 K with a gas-phase-ratio of 50%,
respectively. The transmittance of each spectrum was normalised to the
100% CH4 clathrate |
| Open with DEXTER | |
| In the text | |
|
|
Figure 8:
Same set of spectra as in Fig. 7 for mixed
methane/carbon tetrafluoride clathrate hydrates in the |
| Open with DEXTER | |
| In the text | |
Copyright ESO 2010
Current usage metrics show cumulative count of Article Views (full-text article views including HTML views, PDF and ePub downloads, according to the available data) and Abstracts Views on Vision4Press platform.
Data correspond to usage on the plateform after 2015. The current usage metrics is available 48-96 hours after online publication and is updated daily on week days.
Initial download of the metrics may take a while.