| Issue |
A&A
Volume 513, April 2010
|
|
|---|---|---|
| Article Number | A65 | |
| Number of page(s) | 14 | |
| Section | Interstellar and circumstellar matter | |
| DOI | https://doi.org/10.1051/0004-6361/200911803 | |
| Published online | 30 April 2010 | |
The large-scale magnetic field in the fourth Galactic quadrant
T. Nota - P. Katgert
Leiden Observatory, Leiden University, Niels Bohrweg 2, Leiden, The Netherlands
Received 5 February 2009 / Accepted 28 November 2009
Abstract
Context. Aims. We have re-examined the published rotation measures (RMs) of extragalactic point sources and pulsars with
![]() to study the magnetic field in the fourth Galactic quadrant.
to study the magnetic field in the fourth Galactic quadrant.
Methods. We reduced the influence of structure in electron density as much as possible by excluding objects for which H![]() -data indicate large fluctuations in
-data indicate large fluctuations in ![]() somewhere along the line of sight. We also excluded objects for which the RM may have been significantly ``corrupted'' by an intervening supernova remnant. We modeled RM(l), the longitude dependence of RM
of the unaffected extragalactic sources and pulsars. We assumed several
geometries for the large-scale field. All but one of those are based on
logarithmic spiral arms (with various pitch angles and widths), while
one has circular symmetry. We also made different assumptions about the
large-scale
somewhere along the line of sight. We also excluded objects for which the RM may have been significantly ``corrupted'' by an intervening supernova remnant. We modeled RM(l), the longitude dependence of RM
of the unaffected extragalactic sources and pulsars. We assumed several
geometries for the large-scale field. All but one of those are based on
logarithmic spiral arms (with various pitch angles and widths), while
one has circular symmetry. We also made different assumptions about the
large-scale ![]() -distribution.
-distribution.
Results. The data suggest the following generic behaviour of the
large-scale field in the 4th Galactic quadrant. The field is most
likely organized along logarithmic spiral arms and shows two
significant reversals: from the Norma arm (CCW field) to the Norma-Crux
interarm region (CW field), and from the Norma-Crux interarm region to
the Crux arm (CCW field). The present data do not constrain the field
in and beyond the Crux-Carina interarm region. Although the models give
a good description of the global character of RM(l), individual RM-estimates
deviate by typically 15 times their measurement errors. We argue that
these large deviations are most likely due to the ``small-scale'' field
that dominates on scales of up to several hundred pc.
Conclusions. The picture that emerges is thus of a field that
has significant structure on smaller scales, but for which the average
values in arms and interarm regions are nevertheless well-defined. In
addition, this smaller-amplitude large-scale field appears to reverse
at each arm-interarm boundary that we can study with the present data.
We briefly discuss the link between these results and theoretical
predictions.
Key words: Galaxy: structure - ISM: magnetic fields
1 Introduction
In nearby galaxies, the large-scale magnetic field can be mapped fairly well (e.g., Beck 2007). However, because the observations in general still have fairly low linear resolution, structure on scales below a (few) hundred pc is not resolved, and any smaller-scale structure in the magnetic field is averaged out. In the Galaxy, on the other hand, observations of the magnetic field can have much higher linear resolution, but it has proven difficult to construct an unambiguous picture of the large-scale magnetic field in our Galaxy ``from within''. The small-scale field may be comparable to the large-scale field, and this makes it even more difficult to obtain unbiased estimates of the large-scale field in the Galaxy.
Notwithstanding these difficulties, several groups have tried to map
the large-scale Galactic field, using observations of the rotation
measures (RM) of pulsars (e.g., Men et al. 2008; Weisberg et al. 2004; Han et al. 2006; Vallée 2008a; Noutsos et al. 2008) and/or extragalactic radio sources
(Brown et al. 2007). An intrinsic problem in the use of RM is that its
information on the l.o.s.-component of the magnetic field, ![]() ,
is coupled with the density of free electrons
,
is coupled with the density of free electrons ![]() ,
since
,
since
(where the integral extends from source to observer). Beck et al. (2003) pointed out that all estimates of the strength of the large-scale magnetic field
For pulsars, the dispersion measure, DM, can be obtained, which
gives the integral of ![]() ,
and the
,
and the ![]() -weighted average value of
-weighted average value of
![]() between observer and pulsar follows as
between observer and pulsar follows as
![]() .
However, most pulsars do not have parallactic
distances, and the uncertainty in the model of the Galactic
.
However, most pulsars do not have parallactic
distances, and the uncertainty in the model of the Galactic
![]() -distribution then limits the precision with which the distance
can be derived from DM. This in turn limits the quality of the
mapping of the large-scale field. For extragalactic sources, the
distances are well known (effectively infinite compared to Galactic
scales) but one must again resort to a model of the Galactic
-distribution then limits the precision with which the distance
can be derived from DM. This in turn limits the quality of the
mapping of the large-scale field. For extragalactic sources, the
distances are well known (effectively infinite compared to Galactic
scales) but one must again resort to a model of the Galactic
![]() -distribution to obtain an estimate of the
-distribution to obtain an estimate of the ![]() -averaged value
of the Galactic
-averaged value
of the Galactic ![]() .
In principle, RM estimates of
extragalactic sources might include an intergalactic contribution but
due to lack of information this is generally ignored, and we follow
that custom.
.
In principle, RM estimates of
extragalactic sources might include an intergalactic contribution but
due to lack of information this is generally ignored, and we follow
that custom.
The various analyses of the large-scale Galactic magnetic field are
often based on identical or very similar datasets. Still, they have
led to different or even contradictory conclusions. Using RMs of
554 southern pulsars mostly in the first and fourth Galactic
quadrants, Han et al. (2006) conclude that the field in the spiral arms
interior to the Sun is counterclockwise (CCW) as viewed from the
Galactic North Pole (a convention that we follow), while the field in
the interarm regions is most likely clockwise (CW). Brown et al. (2007)
used RMs of 148 EGS close to the Galactic plane (
![]() )
in the fourth Galactic quadrant, in combination with RMs of 120 pulsars in the same region. They concluded that the best-fit model to
those data has a CW field everywhere, except in the Crux-Scutum arm
and in the Molecular Ring. This picture is confirmed, to a large
extent, by Vallée (2008a), who concludes in addition that the
magnetic field does not follow the arms (with an approximate pitch
angle of about -10
)
in the fourth Galactic quadrant, in combination with RMs of 120 pulsars in the same region. They concluded that the best-fit model to
those data has a CW field everywhere, except in the Crux-Scutum arm
and in the Molecular Ring. This picture is confirmed, to a large
extent, by Vallée (2008a), who concludes in addition that the
magnetic field does not follow the arms (with an approximate pitch
angle of about -10![]() )
but instead has circular symmetry.
)
but instead has circular symmetry.
Noutsos et al. (2008) compared their pulsar data with predictions from four
analytical models, and found that none of the models provide an
acceptable description of the data. Using 482 pulsars with
![]() ,
Men et al. (2008) concluded that the three most widely used
theoretical models are all ruled out by the data, and at similar
confidence levels. They attribute this to the large-scale field in the
Galactic disk having a more complex pattern than just circular,
axisymmetric, or bisymmetric.
,
Men et al. (2008) concluded that the three most widely used
theoretical models are all ruled out by the data, and at similar
confidence levels. They attribute this to the large-scale field in the
Galactic disk having a more complex pattern than just circular,
axisymmetric, or bisymmetric.
In this paper, we use published RM data of pulsars and extragalactic
sources in the fourth Galactic quadrant with
![]() in an
attempt to understand the reasons for these (at least partly)
conflicting results. A crucial step in our analysis is the assessment
of the reliability (as opposed to the uncertainty) of each RMestimate. As was first stressed by Mitra et al. (2003), RM estimates
of pulsars may be biased when the pulsar lies behind an HII region,
and we extend this idea to the more general case of unusually large
variations in the electron density
in an
attempt to understand the reasons for these (at least partly)
conflicting results. A crucial step in our analysis is the assessment
of the reliability (as opposed to the uncertainty) of each RMestimate. As was first stressed by Mitra et al. (2003), RM estimates
of pulsars may be biased when the pulsar lies behind an HII region,
and we extend this idea to the more general case of unusually large
variations in the electron density ![]() along the line of sight to
the pulsar or EGS. In addition, we also consider the potential bias in
RM introduced when the line of sight to the pulsar or EGS is
intercepted by a supernova remnant.
along the line of sight to
the pulsar or EGS. In addition, we also consider the potential bias in
RM introduced when the line of sight to the pulsar or EGS is
intercepted by a supernova remnant.
In Sect. 2, we summarize the data that we used. In Sect. 3, we describe our analysis of the reliability of individual RM estimates, and in Sect. 4 we present the results of the reliability analysis, as well as the longitude dependence of the reliable RMs. In Sect. 5, we present the properties of the models that we fit to the data. In Sect. 6, we discuss the information about the large-scale field that emerges from the model fitting. In Sect. 7, we discuss the source of the large spread of the data about the best-fit models, and in Sect. 8 we summarize and discuss our results.
2 The data
We limited ourselves to the fourth Galactic quadrant, for which homogeneous samples of RMs of low-latitude extragalactic sources (henceforth EGS) and pulsars (PSR) are available in the literature. Our discussion is therefore restricted to the magnetic field in the Galactic midplane.
We used the 148 EGS observed and used by Brown et al. (2007) in the
Galactic longitude range
![]() and with
Galactic latitudes
and with
Galactic latitudes
![]() to which we added 12 sources from
Gaensler et al. (2001), one from Broten et al. (1988), and one from
Clegg et al. (1992) in the same longitude range but with
to which we added 12 sources from
Gaensler et al. (2001), one from Broten et al. (1988), and one from
Clegg et al. (1992) in the same longitude range but with
![]() .
Thus, the total number of EGS is 162, and details of
these are given in Tables 2 and 4. The
effective latitude limit of
.
Thus, the total number of EGS is 162, and details of
these are given in Tables 2 and 4. The
effective latitude limit of
![]() implies a maximum vertical
distance from the midplane (z) of about 500 pc for a line-of-sight
20 kpc long.
implies a maximum vertical
distance from the midplane (z) of about 500 pc for a line-of-sight
20 kpc long.
We used 180 PSR with
![]() and
and
![]() .
The data were taken from Han et al. (1999), Taylor et al. (2000),
Han et al. (2006), and from the ATNF pulsar
catalogue
.
The data were taken from Han et al. (1999), Taylor et al. (2000),
Han et al. (2006), and from the ATNF pulsar
catalogue![]() . For
the average estimated distance of the PSR of about 5 kpc our latitude
limit corresponds to a maximum vertical distance |z| of about 250 pc. We chose not to apply a limit in |z|. First, such a limit would
be ill-defined in view of the considerable uncertainties in the pulsar
distances, which are almost all based on dispersion measures and thus
rely heavily on assumptions about the
. For
the average estimated distance of the PSR of about 5 kpc our latitude
limit corresponds to a maximum vertical distance |z| of about 250 pc. We chose not to apply a limit in |z|. First, such a limit would
be ill-defined in view of the considerable uncertainties in the pulsar
distances, which are almost all based on dispersion measures and thus
rely heavily on assumptions about the ![]() -distribution. Secondly,
PSR at higher latitudes with
-distribution. Secondly,
PSR at higher latitudes with
![]() have, on average, shorter
distances and do not provide much extra information about the
horizontal component of the large-scale field due to projection.
have, on average, shorter
distances and do not provide much extra information about the
horizontal component of the large-scale field due to projection.
Noutsos et al. (2008) published new and revised RM estimates for many PSR. In the majority of cases, the differences between the new and old values are within the quoted errors, although some objects show a disagreement of up to 10 rad m-2. However, only very rarely are the two RM-values highly discrepant. Where applicable, we adopted the values from Noutsos et al. (2008). The details of the 180 PSR are given in Tables 3 and 5. The RM estimates and their estimated errors were taken from the various papers; the estimated errors generally range from a few to a few tens of rad m-2.
In Fig. 1, we show all data for EGS (upper panel) and PSR (lower panel) versus Galactic longitude. We show only the RMestimates, because for the large majority of objects the symbols encompass the estimated errors. In other words, the large spread in RM in both panels is not due to errors in the RM estimates.
![\begin{figure}
\par\includegraphics[width=8.5cm,clip]{11803fg1a.ps}\par\vspace*{2mm}
\includegraphics[width=8.5cm,clip]{11803fg1b.ps}
\end{figure}](/articles/aa/full_html/2010/05/aa11803-09/img29.png)
|
Figure 1:
The RM estimates from the literature for EGS ( upper
panel) and PSR ( lower panel), versus Galactic longitude; there are
162 EGS and 180 PSR with
|
| Open with DEXTER | |
3 The reliability of the RM estimates
As was shown by Noutsos et al. (2008), the large spread in RM in
Fig. 1 can neither be due to measurement errors nor to
180
![]() ambiguities in the polarization angles; the latter are
essentially under control in ``modern'' closely-spaced multi-frequency
polarization data. The large spread in RM is most apparent in the
ambiguities in the polarization angles; the latter are
essentially under control in ``modern'' closely-spaced multi-frequency
polarization data. The large spread in RM is most apparent in the
![]() of close pairs (with angular distances of at most a few
degrees) which can be as large as several hundreds or even 1000 rad m-2. These
of close pairs (with angular distances of at most a few
degrees) which can be as large as several hundreds or even 1000 rad m-2. These ![]() values most likely have their origin in
structure in the Galactic interstellar medium (ISM), which manifests
itself in the small-scale magnetic field and in inhomogeneities in the
electron density.
values most likely have their origin in
structure in the Galactic interstellar medium (ISM), which manifests
itself in the small-scale magnetic field and in inhomogeneities in the
electron density.
One aspect of the latter is the effect of HII regions on RM values of EGS and PSR. This was first discussed by Mitra et al. (2003), following earlier work on the effect of HII regions and OB stars on the dispersion measure (DM) of PSR by Prentice & Ter Haar (1969), Grewing & Walmsley (1971), and in an earlier paper by Mitra & Ramachandran (2001). Several discussions of such observed or suspected RM anomalies can be found in the literature (see e.g., Brown & Taylor 2001; Rand & Kulkarni 1989; Han et al. 1999). Another aspect of the effect of structure in the ISM on RM estimates is that produced by Supernova Remnants (SNR); this has been discussed by Mitra et al. (2003), Haverkorn et al. (2008), and Whiting et al. (2009).
Somewhat surprisingly, these two effects have never been fully taken into account in discussions of the large-scale component of the Galactic magnetic field based on RM estimates of PSR and/or EGS (see e.g., Rand & Kulkarni 1989; Rand & Lyne 1994; Indrani & Deshpande 1999; Han et al. 1999; Frick et al. 2001; Han et al. 2006; Brown et al. 2007; Men et al. 2008; Vallée 2008a). From time to time, one finds references to unexpected deviations from smoothness in the RM-distributions, as e.g., in the so-called ``Carina-anomaly'' mentioned by Han et al. (2006). However we are not aware of any systematic identification of unreliable RM estimates except in the analysis of Haverkorn et al. (2008), but their focus was not on the large-scale Galactic magnetic field.
Yet, the ``corruption'' of RMs due to structure in the ISM was
demonstrated to be potentially severe by Mitra et al. (2003). These
authors estimated that an HII region with angular size of 2
![]() and
a linear diameter of 30 pc could produce a
and
a linear diameter of 30 pc could produce a ![]() of 250 rad m-2, and that would make the estimated magnetic field strength
very unreliable, if not unusable. In the following subsections, we
describe how we judged the (un-)reliability of the individual RMestimates of EGS and PSR. The other aspect of structure in the
Galactic ISM, namely variations of the magnetic field on small scales,
and its effect on RM values of EGS and PSR will be discussed in
Sect. 7.
of 250 rad m-2, and that would make the estimated magnetic field strength
very unreliable, if not unusable. In the following subsections, we
describe how we judged the (un-)reliability of the individual RMestimates of EGS and PSR. The other aspect of structure in the
Galactic ISM, namely variations of the magnetic field on small scales,
and its effect on RM values of EGS and PSR will be discussed in
Sect. 7.
3.1 RM ``corruption'' by significant structure in n
When using a measured RM estimate as an indicator of the
![]() -averaged strength of the magnetic field, it is advisable to
eliminate data for which there is evidence that the
-averaged strength of the magnetic field, it is advisable to
eliminate data for which there is evidence that the ![]() -distribution
is very non-uniform. This is because a very non-uniform weighting of
the line-of-sight component of the field may enhance local structure
in the field, which can rob the concept of large-scale field of its
meaning. That is particularly relevant when the small-scale field is
comparable to or stronger than the large-scale field, as is thought to
be the case in the spiral arms (e.g., Haverkorn et al. 2008; Beck 2007). This problem is exacerbated by field reversals,
because a very uneven weighting of positive and negative field
contributions may even lead to incorrect conclusions about the
direction of the mean field.
-distribution
is very non-uniform. This is because a very non-uniform weighting of
the line-of-sight component of the field may enhance local structure
in the field, which can rob the concept of large-scale field of its
meaning. That is particularly relevant when the small-scale field is
comparable to or stronger than the large-scale field, as is thought to
be the case in the spiral arms (e.g., Haverkorn et al. 2008; Beck 2007). This problem is exacerbated by field reversals,
because a very uneven weighting of positive and negative field
contributions may even lead to incorrect conclusions about the
direction of the mean field.
Berkhuijsen et al. (2006) determined the degree of non-uniformity in the
![]() -distribution along lines of sight towards 157 PSR, at Galactic
latitudes
-distribution along lines of sight towards 157 PSR, at Galactic
latitudes
![]() and within about 3 kpc from the Sun. They
quantify the degree of non-uniformity by the volume filling factor,
and within about 3 kpc from the Sun. They
quantify the degree of non-uniformity by the volume filling factor,
![]() (
(![]()
![]() ,
where
,
where
![]() is the emission measure
produced in front of the PSR and D its physical distance. They find
that
is the emission measure
produced in front of the PSR and D its physical distance. They find
that ![]() ranges from about 1 to 50%, with a median value of about 10%.
ranges from about 1 to 50%, with a median value of about 10%.
To be able to eliminate lines of sight with very non-uniform
![]() -distributions, we must have a way of selecting against low
values of
-distributions, we must have a way of selecting against low
values of ![]() .
However, since we do not have DM estimates for the
EGS, we cannot use
.
However, since we do not have DM estimates for the
EGS, we cannot use ![]() as an indicator of unreliable estimates of
RM for EGS and PSR alike. In principle, we could have inferred
as an indicator of unreliable estimates of
RM for EGS and PSR alike. In principle, we could have inferred ![]() for our PSR directly from EM and DM, if at these low latitudes a
reliable correction for extinction was possible, and if the estimation
of
for our PSR directly from EM and DM, if at these low latitudes a
reliable correction for extinction was possible, and if the estimation
of
![]() would not be as problematic as it is at low latitudes.
would not be as problematic as it is at low latitudes.
From the above expression for ![]() ,
it can be seen that large values
of EM correspond in general to low values of
,
it can be seen that large values
of EM correspond in general to low values of ![]() .
However, a large
value of EM by itself does not guarantee a low value of
.
However, a large
value of EM by itself does not guarantee a low value of ![]() ,
but
one can compare the EM value for the line of sight of interest with
EM values for neighbouring lines of sight. More precisely: one can
estimate the probability that the observed EM for the line of sight
in question will be exceeded in a random draw from the collection of
EM values observed for neighbouring lines of sight. If this
probability is below a certain threshold value, the RM estimate for
the particular line of sight is suspect because the EM value is
uncharacteristically high for its surroundings.
,
but
one can compare the EM value for the line of sight of interest with
EM values for neighbouring lines of sight. More precisely: one can
estimate the probability that the observed EM for the line of sight
in question will be exceeded in a random draw from the collection of
EM values observed for neighbouring lines of sight. If this
probability is below a certain threshold value, the RM estimate for
the particular line of sight is suspect because the EM value is
uncharacteristically high for its surroundings.
We used the Southern H![]() Sky Survey Atlas
(SHASSA, Gaustad et al. 2001) to investigate whether the EM values
for the lines of sight to our EGS and PSR are uncharacteristically
high for their surroundings. We used the H
Sky Survey Atlas
(SHASSA, Gaustad et al. 2001) to investigate whether the EM values
for the lines of sight to our EGS and PSR are uncharacteristically
high for their surroundings. We used the H![]() intensities
straight from the survey, without translation into EM (the ratio of
the two is constant and depends only on temperature), and without
correction for interstellar reddening (as reddening corrections cannot
be usefully applied for
intensities
straight from the survey, without translation into EM (the ratio of
the two is constant and depends only on temperature), and without
correction for interstellar reddening (as reddening corrections cannot
be usefully applied for
![]() ;
see
e.g. Berkhuijsen et al. 2006). For PSR, we did not attempt to correct
the observed EM to
;
see
e.g. Berkhuijsen et al. 2006). For PSR, we did not attempt to correct
the observed EM to
![]() .
It is therefore possible that we
erroneously reject a PSR RM because of a highly non-uniform
.
It is therefore possible that we
erroneously reject a PSR RM because of a highly non-uniform
![]() -distribution beyond the PSR, but then at least we do not
retain unreliable RMs that should have been rejected.
-distribution beyond the PSR, but then at least we do not
retain unreliable RMs that should have been rejected.
We compared the H![]() intensity observed towards each object with
the distributions of the H
intensity observed towards each object with
the distributions of the H![]() intensities in 3 ``concentric''
squares centered on the object, with sides of
intensities in 3 ``concentric''
squares centered on the object, with sides of
![]() ,
,
![]() and
and
![]() .
If the H
.
If the H![]() intensity towards the object exceeds a
certain threshold in at least one of the square areas, its RMestimate is considered to be unreliable. We gauged the effect of the
value of the threshold on the results by considering thresholds
corresponding to the 97.5th, 95th, 90th, 80th, and 60th percentiles in
the
intensity towards the object exceeds a
certain threshold in at least one of the square areas, its RMestimate is considered to be unreliable. We gauged the effect of the
value of the threshold on the results by considering thresholds
corresponding to the 97.5th, 95th, 90th, 80th, and 60th percentiles in
the
![]() -distributions. It appears that the estimates of the
large-scale magnetic field are quite insensitive to the exact value of
the threshold, although for the 60th-percentile threshold the
statistics are significantly reduced. Even though the spread in the
observed RM values about the model solutions (see
Sect. 6) varies by at most 10% from the 80th percentile
upwards, we used the 95th-percentile threshold for the model fits
discussed in Sect. 6, because
-distributions. It appears that the estimates of the
large-scale magnetic field are quite insensitive to the exact value of
the threshold, although for the 60th-percentile threshold the
statistics are significantly reduced. Even though the spread in the
observed RM values about the model solutions (see
Sect. 6) varies by at most 10% from the 80th percentile
upwards, we used the 95th-percentile threshold for the model fits
discussed in Sect. 6, because
![]() is smallest
for that value.
is smallest
for that value.
We guarded against H![]() intensities that are exceptional on a
small but not on a larger angular scale by rescinding the verdict
``unreliable'' if the H
intensities that are exceptional on a
small but not on a larger angular scale by rescinding the verdict
``unreliable'' if the H![]() intensity towards the object was
exceeded by more than 10% of the H
intensity towards the object was
exceeded by more than 10% of the H![]() intensities in (one of)
the larger square(s). Clearly, the verdict ``unreliable'' cannot be
rescinded when based on the data in the largest square. This procedure
finds sources that are at a significant local maximum within a rather
uniform H
intensities in (one of)
the larger square(s). Clearly, the verdict ``unreliable'' cannot be
rescinded when based on the data in the largest square. This procedure
finds sources that are at a significant local maximum within a rather
uniform H![]() intensity, or near mostly (but not exclusively)
small HII regions (step 1).
intensity, or near mostly (but not exclusively)
small HII regions (step 1).
To identify sources close to a local maximum on a strong
H![]() -intensity
gradient (say, towards the edge of an HII region),
we divided each of the 3 rectangular areas centered on the object
in 4 quadrants and applied the above test to the 4 subareas.
If this showed
the object to be at a local maximum on an H
-intensity
gradient (say, towards the edge of an HII region),
we divided each of the 3 rectangular areas centered on the object
in 4 quadrants and applied the above test to the 4 subareas.
If this showed
the object to be at a local maximum on an H![]() -intensity
gradient, we checked that the gradient was likely to be caused by a
nearby (<
-intensity
gradient, we checked that the gradient was likely to be caused by a
nearby (<
![]() )
HII region (step 2). Finally, we also checked
whether the object was in the direction of a known large HII region (e.g., from the RCW catalogue, Rodgers et al. 1960), which
might not have been evident from either of the above tests (step 3).
)
HII region (step 2). Finally, we also checked
whether the object was in the direction of a known large HII region (e.g., from the RCW catalogue, Rodgers et al. 1960), which
might not have been evident from either of the above tests (step 3).
While EGS at a maximum in the H![]() intensity are always beyond
the structure that causes the maximum, this is not necessarily true
for PSR. The distance of the PSR must therefore be compared with the
estimated distance of the HII region (from stellar distances or
kinematical distances from e.g., CO velocities) to decide whether the
RM of the PSR is unreliable. As is commonly done, we estimated the
PSR distances from the observed DM with the
intensity are always beyond
the structure that causes the maximum, this is not necessarily true
for PSR. The distance of the PSR must therefore be compared with the
estimated distance of the HII region (from stellar distances or
kinematical distances from e.g., CO velocities) to decide whether the
RM of the PSR is unreliable. As is commonly done, we estimated the
PSR distances from the observed DM with the ![]() -model of
Cordes & Lazio (2002) (which we will refer to as CL02), but it must be
remembered that in general these estimates are quite uncertain. In the
latter comparison we adopt a 20% uncertainty in the PSR distance
obtained from the observed DM in combination with CL02, i.e., the
HII region must be closer than 80% of the estimated PSR distance for
the RM estimate to be rejected.
-model of
Cordes & Lazio (2002) (which we will refer to as CL02), but it must be
remembered that in general these estimates are quite uncertain. In the
latter comparison we adopt a 20% uncertainty in the PSR distance
obtained from the observed DM in combination with CL02, i.e., the
HII region must be closer than 80% of the estimated PSR distance for
the RM estimate to be rejected.
3.2 RM corruption by supernova remnants
If the line of sight towards a target is intercepted by (part of) a SNR shell, the RM of the target may be significantly biased,as significant variations of RM, of up to 100 rad m-2, have been observed across individual SNR (see e.g. Mitra et al. 2003, and references therein). We used the SNR catalogue produced from observations at 843 MHz with the Molonglo Observatory Synthesis Telescope by Whiteoak & Green (1996), and its updates, to identify targets for which the RM estimate is likely to be biased. Since not all sources rejected by Haverkorn et al. (2008) were identified in this way, we also inspected the 2.4 GHz Stokes I maps from Parkes (Duncan et al. 1995b), to ensure consistency with Haverkorn et al.
As before, we need to ascertain that the SNR is in front of the PSR before we can reject a PSR RM estimate as being unreliable. Distances of SNR are generally not very well known, as they are mostly based on observed average surface brightness in combination with evolutionary models (see e.g., Green 2004). We again adopted a 20% uncertainty in the PSR distance implied by the observed DM, in combination with CL02. For several PSR, it was likely that the RMis corrupted by an intervening SNR. In addition, for some PSR a physical association with the SNR is very likely.
4 Application of the tests for RM reliability
4.1 Rejected PSR and extragalactic sources
The objects that were rejected as a result of the procedures described
above (with 95%-percentile
![]() -threshold), are listed in
Tables 2 and 3. PSR are listed with their
estimated rotation measure (RM), dispersion measure (DM), distance
(from the observed DM and the CL02 model), and H
-threshold), are listed in
Tables 2 and 3. PSR are listed with their
estimated rotation measure (RM), dispersion measure (DM), distance
(from the observed DM and the CL02 model), and H![]() intensity.
For objects that were rejected by the H
intensity.
For objects that were rejected by the H![]() /HII-region test we
indicate the reason for the rejection (``H
/HII-region test we
indicate the reason for the rejection (``H![]() step''). We also give
distance estimates of the HII-regions that are likely to be
responsible for the enhanced emission, as well as references to the
source of this distance estimate. For PSR that are omitted because the
line of sight appears to be intercepted by a supernova remnant, we
give the name of the remnant and its distance estimate, again with a
reference to the source of the distance estimate. As mentioned before,
for the EGS there is no need to give distance estimates of either HII regions or supernova remnants.
step''). We also give
distance estimates of the HII-regions that are likely to be
responsible for the enhanced emission, as well as references to the
source of this distance estimate. For PSR that are omitted because the
line of sight appears to be intercepted by a supernova remnant, we
give the name of the remnant and its distance estimate, again with a
reference to the source of the distance estimate. As mentioned before,
for the EGS there is no need to give distance estimates of either HII regions or supernova remnants.
It is remarkable that the H![]() /HII-region test has a relatively
large effect on lines of sight with large values of RM. This is
evident from Fig. 1 where the open symbols indicate the
unreliable RM estimates. About half (31 of 60) of the lines of sight
with
|RM| > 500 rad m-2 are rejected and this fraction is the
same for PSR (14 of 27) and EGS (17 of 33). Since the values of RM do not enter the tests at all, this provides support for the
assumption that a significant part of the large spread in
Fig. 1 is indeed due to structure in
/HII-region test has a relatively
large effect on lines of sight with large values of RM. This is
evident from Fig. 1 where the open symbols indicate the
unreliable RM estimates. About half (31 of 60) of the lines of sight
with
|RM| > 500 rad m-2 are rejected and this fraction is the
same for PSR (14 of 27) and EGS (17 of 33). Since the values of RM do not enter the tests at all, this provides support for the
assumption that a significant part of the large spread in
Fig. 1 is indeed due to structure in ![]() .
Additional
support is provided by the results of the modeling described in
Sect. 6.
.
Additional
support is provided by the results of the modeling described in
Sect. 6.
The SNR test leads to the rejection of 10 RM estimates of PSR and 23 of EGS. Of these 33 objects, 9 have |RM| > 500 rad m-2.
The slightly different rejection statistics of EGS and PSR (21 against 25%) probably reflects the fact that PSR are concentrated in the spiral arms, where the HII regions occur predominantly, while the relation between spiral arms and SNR is probably less tight.
4.2 The reliable data
The EGS and PSR with reliable RMs are listed in
Tables 4 and 5. Ten of the PSR in
Table 5 would have been rejected by the
H![]() /HII-region test, if the HII-region had not been either
clearly beyond the PSR or at least not clearly in front of it, taking
account of the error margins. These PSR and HII-regions are:
J0837-4135 (RCW27), J1015-5719 (RCW49), J1020-5921 (RCW47), J1038-5831
(RCW53), J1046-5813 (RCW53), J1048-5832 (RCW53), J1056-6258 (RCW55),
J1123-6102 (RCW57B), J1126-6054 (RCW57B), and J1718-3825 (RCW123).
/HII-region test, if the HII-region had not been either
clearly beyond the PSR or at least not clearly in front of it, taking
account of the error margins. These PSR and HII-regions are:
J0837-4135 (RCW27), J1015-5719 (RCW49), J1020-5921 (RCW47), J1038-5831
(RCW53), J1046-5813 (RCW53), J1048-5832 (RCW53), J1056-6258 (RCW55),
J1123-6102 (RCW57B), J1126-6054 (RCW57B), and J1718-3825 (RCW123).
![\begin{figure}
\par\includegraphics[width=8.5cm,clip]{11803fg2a.ps}\par\vspace*{2mm}
\includegraphics[width=8.5cm,clip]{11803fg2b.ps}
\end{figure}](/articles/aa/full_html/2010/05/aa11803-09/img44.png)
|
Figure 2:
The dependence on Galactic longitude l of the reliable
RM values. In the upper panel, the PSR are shown, coded according
to distance (open symbols: PSR within 5 kpc; filled symbols: PSR
beyond 5 kpc). In the lower panel, the distant PSR (filled squares)
and extragalactic sources (open circles) are shown together; in this
panel, the lower limit to PSR distance is 6 kpc for
|
| Open with DEXTER | |
Figure 2 shows that application of the two rejection
criteria has turned Fig. 1 into a unexpectedly clean
picture, especially for
![]() .
The data in the lower panel
indicate three clear changes of the sign of RM, namely at
.
The data in the lower panel
indicate three clear changes of the sign of RM, namely at
![]() ,
,
![]() ,
and
,
and
![]() .
The change of
sign at
.
The change of
sign at
![]() is well-documented, and it is also clearly
visible in the total dataset (see, in particular, the upper panel of
Fig. 1). The other changes of sign rely very much on
the predominantly (but admittedly not exclusively) positive
RM-values around
is well-documented, and it is also clearly
visible in the total dataset (see, in particular, the upper panel of
Fig. 1). The other changes of sign rely very much on
the predominantly (but admittedly not exclusively) positive
RM-values around
![]() .
These carried little weight in
the analyses of Brown et al. (2007) and Vallée (2008a); however,
most of those RM estimates survived the two tests that we described
in Sect. 3.
.
These carried little weight in
the analyses of Brown et al. (2007) and Vallée (2008a); however,
most of those RM estimates survived the two tests that we described
in Sect. 3.
Another remarkable result in Fig. 2 is that the RM(l)distributions of EGS and ``distant'' PSR are quite similar. The
similarity is most apparent in the longitudes at which RM appears to
change sign, but it also manifests itself in the global magnitudes of
the RM estimates. We note that most of the data in the longitude
range
![]() (except for small-distance PSR)
was found to be unreliable, because they mostly failed the
H
(except for small-distance PSR)
was found to be unreliable, because they mostly failed the
H![]() /HII-region test. This means that all results that rely
heavily or exclusively on data in that longitude range (where the
Carina arm dominates) must be regarded with caution.
/HII-region test. This means that all results that rely
heavily or exclusively on data in that longitude range (where the
Carina arm dominates) must be regarded with caution.
5 Model predictions of RM(l)
To go beyond the general conclusions in the last paragraphs of
Sect. 4.2, and to obtain information about the large-scale
Galactic magnetic field and its possible reversals, we compared the
observed RM(l) with model predictions. Such predictions require at
least the following ingredients: 1) a model of the ![]() -distribution;
and 2) a definition of the global geometry of the large-scale
field. The latter involves the demarcation of the regions in which we
will assume the field to have the same strength and handedness.
-distribution;
and 2) a definition of the global geometry of the large-scale
field. The latter involves the demarcation of the regions in which we
will assume the field to have the same strength and handedness.
5.1 Electron-density model
We used two models for the Galactic ![]() -distribution: one derived by
Cordes & Lazio (2002) from the measured dispersion measures of 1143 PSR
and one with a uniform density. The model by Cordes & Lazio (CL02)
consists of several components: thin and thick disks, spiral arms, and
a Galactic center component. The code NE2001-1.0, which allows the
calculation of
-distribution: one derived by
Cordes & Lazio (2002) from the measured dispersion measures of 1143 PSR
and one with a uniform density. The model by Cordes & Lazio (CL02)
consists of several components: thin and thick disks, spiral arms, and
a Galactic center component. The code NE2001-1.0, which allows the
calculation of ![]() according to CL02 at arbitrary positions within
the Galaxy, is publicly available
according to CL02 at arbitrary positions within
the Galaxy, is publicly available![]() . The CL02 model is
based on data for 1143 PSR, but only a very small fraction of those
have accurate distances. Since this model became available, new
estimates have been made of the scale-height of the thick-disk
component (Berkhuijsen & Müller 2008; Gaensler et al. 2008); and new information
about the small-scale structure of the warm ionized medium, such as
the volume filling-factor (Berkhuijsen et al. 2006; Berkhuijsen & Müller 2008),
was obtained. However, these new insights have not yet led to an
improved overall model. As Gaensler et al. (2008) noted, the new
insights are probably less relevant at low latitudes, and the by now
well-documented underestimation of PSR distances by the CL02 model is
most severe at high latitudes.
. The CL02 model is
based on data for 1143 PSR, but only a very small fraction of those
have accurate distances. Since this model became available, new
estimates have been made of the scale-height of the thick-disk
component (Berkhuijsen & Müller 2008; Gaensler et al. 2008); and new information
about the small-scale structure of the warm ionized medium, such as
the volume filling-factor (Berkhuijsen et al. 2006; Berkhuijsen & Müller 2008),
was obtained. However, these new insights have not yet led to an
improved overall model. As Gaensler et al. (2008) noted, the new
insights are probably less relevant at low latitudes, and the by now
well-documented underestimation of PSR distances by the CL02 model is
most severe at high latitudes.
Since many of the details of the ![]() -model have yet to be confirmed
and/or updated, we have also used a model with constant
-model have yet to be confirmed
and/or updated, we have also used a model with constant ![]() .
From 81 low-latitude PSR with reliable RM, we derived the constant value of
.
From 81 low-latitude PSR with reliable RM, we derived the constant value of
![]() that on average would produce the CL02 PSR distances, to be
that on average would produce the CL02 PSR distances, to be
![]() cm-3. It must be noted that this is just an estimate of
the smeared-out density in the CL02 model, which may therefore still
be an overestimate. It is certainly much higher than recent estimates
of the midplane density of the thick disk. Berkhuijsen & Müller (2008)
find 0.023 cm-3, but Gaensler et al. (2008) find 0.03 cm-3, at
least when they include the low-latitude PSR. To this, the
contributions of the thin disk and the smoothed spiral arms must be
added but neither contribution is known very well. Cordes & Lazio (2002)
give a density of the thin disk at z=0 of 0.09 cm-3 but the
error in this is probably quite substantial, while in their model the
thin-disk density has already dropped to 0.01 cm-3 at
cm-3. It must be noted that this is just an estimate of
the smeared-out density in the CL02 model, which may therefore still
be an overestimate. It is certainly much higher than recent estimates
of the midplane density of the thick disk. Berkhuijsen & Müller (2008)
find 0.023 cm-3, but Gaensler et al. (2008) find 0.03 cm-3, at
least when they include the low-latitude PSR. To this, the
contributions of the thin disk and the smoothed spiral arms must be
added but neither contribution is known very well. Cordes & Lazio (2002)
give a density of the thin disk at z=0 of 0.09 cm-3 but the
error in this is probably quite substantial, while in their model the
thin-disk density has already dropped to 0.01 cm-3 at
![]() pc. Given all these uncertainties, we decided to use, somewhat
arbitrarily, a constant value of
pc. Given all these uncertainties, we decided to use, somewhat
arbitrarily, a constant value of
![]() cm-3.
cm-3.
5.2 The geometry of the large-scale magnetic field
![\begin{figure}
\par\includegraphics[width=8.5cm,clip]{11803fg3.ps}
\end{figure}](/articles/aa/full_html/2010/05/aa11803-09/img54.png)
|
Figure 3:
The regions with constant-amplitude field in our modeling
of the large-scale magnetic field in the fourth Galactic quadrant.
The definition of these regions is superimposed on a logarithmic
greyscale representation of CL02 for z = 0. The Sun is at x = 0,
y = 8.5. In the left panel, we show the definition for
|
| Open with DEXTER | |
It is widely assumed that the large-scale Galactic magnetic field follows the spiral arms. The main reason for that assumption is the orientation w.r.t. the optical spiral arms of the radio polarization angles in external galaxies. In our analysis, we thus mostly assume that the large-scale magnetic field can be fully described by its strength and handedness in arm and interarm regions. This requires a definition of the extent of these regions, so that we can assign each position on a given line of sight (i.e., for each (l,b)-pair) to one of these regions.
To define the spiral arms, we used the six observed longitudes in the
1st and 4th quadrants where the arms are seen tangentially, as derived
by Vallée (2008b) from a host of observations using various
tracers. These longitudes are:
![]() and
and
![]() in the 1st quadrant and
in the 1st quadrant and
![]() ,
,
![]() ,
,
![]() ,
and
,
and
![]() in
the 4th quadrant. To these values, we fitted four-armed logarithmic
spirals with various pitch angles p. The rms deviations between
the observed and predicted longitudes were used, together with the
Carina-Perseus interarm distance (along the direction from the
Galactic center to the Sun), and the accurate distance to the W3OH
complex in the Perseus arm, to estimate the allowed range of pitch
angles.
in
the 4th quadrant. To these values, we fitted four-armed logarithmic
spirals with various pitch angles p. The rms deviations between
the observed and predicted longitudes were used, together with the
Carina-Perseus interarm distance (along the direction from the
Galactic center to the Sun), and the accurate distance to the W3OH
complex in the Perseus arm, to estimate the allowed range of pitch
angles.
We used
![]() kpc for the interarm distance and
kpc for the interarm distance and
![]() kpc for the W3OH distance (where
kpc for the W3OH distance (where
![]() kpc, in line with
CL02). We conclude that the allowed range of p is approximately
kpc, in line with
CL02). We conclude that the allowed range of p is approximately
![]() ,
and we derived solutions for
,
and we derived solutions for
![]() ]. These values are consistent with
previous estimates by e.g., Vallée (2005b), but we note that
the estimate of the pitch angle by Heiles (1996) from starlight
polarization data is not consistent with these values.
]. These values are consistent with
previous estimates by e.g., Vallée (2005b), but we note that
the estimate of the pitch angle by Heiles (1996) from starlight
polarization data is not consistent with these values.
For the definition of the various arm and interarm regions, we assume that all arm regions have the same constant width d about the defining logarithmic spirals, and we have chosen d = 0.8(0.2)1.4 kpc. Since the interarm regions complement the arm regions, they do not have constant widths, but open up outwardly (see e.g., the left panel of Fig. 3). With the 12 (p,d)-pairs, we attempt to mimic that in reality spiral arms have neither constant pitch angle nor constant arm width.
The model thus has 7 regions (4 arm and 3 interarm regions), in each
of which we assume the magnetic field to have the same strength
(where we ignore the details of the jump conditions of the field at
the interfaces between neighbouring regions with different field
strengths). The field direction at each point is identical to
that at the nearest point on the central line of the arm or interarm
region (midpoint between neighbouring arms) to which it belongs. At
each position, this defines the angle between the magnetic field and
the line of sight, and thus the projection factor required to derive
the line-of-sight component of the field. We assume that the
definition of arm and interarm regions is identical for all vertical
heights z of interest because we limit ourselves to
![]() (i.e.,
(i.e.,
![]() pc). We also assume that the field strength does
not depend on the vertical distance z from the plane (at least for
the distances in question) and that the field vector is parallel to
that at the footpoint in the plane.
pc). We also assume that the field strength does
not depend on the vertical distance z from the plane (at least for
the distances in question) and that the field vector is parallel to
that at the footpoint in the plane.
Our definition of arms and interarm regions in the Galactic plane for
![]() and d=1.0 kpc is shown in the left panel of
Fig. 3, superimposed on a logarithmic grey-scale
representation of the CL02 model at z=0. The arms represented in our
models correspond approximately to the Perseus, Carina, Crux, and
Norma arms. It is clear that the arms in the CL02
and d=1.0 kpc is shown in the left panel of
Fig. 3, superimposed on a logarithmic grey-scale
representation of the CL02 model at z=0. The arms represented in our
models correspond approximately to the Perseus, Carina, Crux, and
Norma arms. It is clear that the arms in the CL02 ![]() -model are not
perfectly consistent with an m=4 logarithmic spiral. In particular,
the Crux arm is not reproduced very well in the logarithmic-spiral
model. However, we refrained from tweaking the spiral model, in view
of the uncertainties in the CL02 model.
-model are not
perfectly consistent with an m=4 logarithmic spiral. In particular,
the Crux arm is not reproduced very well in the logarithmic-spiral
model. However, we refrained from tweaking the spiral model, in view
of the uncertainties in the CL02 model.
For the Galaxy, the assumption of a spiral-arm related field was
challenged by Vallée (2005a) who, in a study of RM estimates of
over 350 PSR in all 4 quadrants, assumed that the field has circular
symmetry, which he claimed provides the best fit to the data. In his
most recent analysis (Vallée 2008a), he finds that the field is
clockwise (CW) everywhere except in a 2 kpc wide annulus between 5 and
7 kpc (with
![]() kpc), where it is counterclockwise
(CCW). Men et al. (2008) also compare the PSR data with a ring model,
and find that this model does not provide a good fit to the
data. However, it is not clear to us how robust these conclusions are,
because in these analyses unreliable RM estimates were not
identified and rejected. Below (see Sect. 6), we
investigate this point further, and therefore we show, in the right
panel of Fig. 3,
a ring model with ringwidth of 1 kpc. With a radial range
from 4 to 12 kpc, this model has a number of unknowns
(field strenghths) that is comparable to that in the model
shown in the left panel.
kpc), where it is counterclockwise
(CCW). Men et al. (2008) also compare the PSR data with a ring model,
and find that this model does not provide a good fit to the
data. However, it is not clear to us how robust these conclusions are,
because in these analyses unreliable RM estimates were not
identified and rejected. Below (see Sect. 6), we
investigate this point further, and therefore we show, in the right
panel of Fig. 3,
a ring model with ringwidth of 1 kpc. With a radial range
from 4 to 12 kpc, this model has a number of unknowns
(field strenghths) that is comparable to that in the model
shown in the left panel.
5.3 Combining n
with the model for the large-scale field
![\begin{figure}
\par\includegraphics[width=17cm,clip]{11803fg4.ps}
\end{figure}](/articles/aa/full_html/2010/05/aa11803-09/img71.png)
|
Figure 4:
The results of the model fits of RM(l) for the spiral-arm
related large-scale field, for EGS and PSR with CL02 |
| Open with DEXTER | |
A model prediction of RM at a particular l and b can be regarded
as the sum of several ![]() contributions, one
contributions, one ![]() for
each of the arm/interarm regions, or for each of the concentric
rings. Each term is equal to the field strength in the region |Bi|multiplied by a weight Wi, or
for
each of the arm/interarm regions, or for each of the concentric
rings. Each term is equal to the field strength in the region |Bi|multiplied by a weight Wi, or
The weight Wi converts field strength into
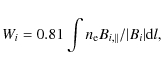
where the integral extends over the part(s) of the line of sight that belong to region i, and where
The values of Wi were calculated by numerical integration using a
50-pc grid of ![]() ,
for the (l,b)-combinations of all objects with
a reliable RM estimate in the longitude range
,
for the (l,b)-combinations of all objects with
a reliable RM estimate in the longitude range
![]() .
For the EGS, the integration was performed out to the
boundary of the
.
For the EGS, the integration was performed out to the
boundary of the ![]() -grid (corresponding to
-grid (corresponding to
![]() kpc)
because
kpc)
because ![]() is not defined in CL02 beyond that distance. For the
PSR, the integration was performed out to the distance of the PSR.
is not defined in CL02 beyond that distance. For the
PSR, the integration was performed out to the distance of the PSR.
Note that the PSR distances in Tables 3
and 5 were taken from the literature (and those follow
from the CL02 web-interface). In the modeling (with CL02), we
performed a direct integration of ![]() up to the measured DM to
obtain the PSR distance, as recommended by Cordes (private
communication). The effect of the distance errors cannot be taken
into account in the modeling, because a redistribution of all PSR
according to their distance errors produces a pseudo-observation that
is equivalent to the original one. Therefore, no information about the
effect of the distance errors can be obtained.
up to the measured DM to
obtain the PSR distance, as recommended by Cordes (private
communication). The effect of the distance errors cannot be taken
into account in the modeling, because a redistribution of all PSR
according to their distance errors produces a pseudo-observation that
is equivalent to the original one. Therefore, no information about the
effect of the distance errors can be obtained.
6 The large-scale field in the 4th Galactic quadrant
We derived the best-fit values of Bi for pitch angles
![]() ,
and
,
and
![]() and for armwidths d = 0.8, 1.0, 1.2, and 1.4 kpc, from least-squares fits to the observed RM(l) values. We did
not weight the observations with the inverse of the square of the
estimated error of the measured RM, because the residuals between
data and model are typically 15-30 larger than the measurement
errors of
and for armwidths d = 0.8, 1.0, 1.2, and 1.4 kpc, from least-squares fits to the observed RM(l) values. We did
not weight the observations with the inverse of the square of the
estimated error of the measured RM, because the residuals between
data and model are typically 15-30 larger than the measurement
errors of ![]() 10-20 rad m-2. We regard this as an indication
that the differences between data and model are not due to measurement
errors. As we will discuss in Sect. 7 it is likely that
these differences are primarily due to the small-scale component of
the magnetic field. In spite of the large spread about the best-fit
solutions, the significance of several of the derived Bi-values is
quite high (up to 7
10-20 rad m-2. We regard this as an indication
that the differences between data and model are not due to measurement
errors. As we will discuss in Sect. 7 it is likely that
these differences are primarily due to the small-scale component of
the magnetic field. In spite of the large spread about the best-fit
solutions, the significance of several of the derived Bi-values is
quite high (up to 7![]() ). The values of
). The values of
![]() were
derived from 10 000 bootstraps with residual resampling. The histograms
of the 10 000 values of Bi are all very close to being Gaussian, and
thus yield
were
derived from 10 000 bootstraps with residual resampling. The histograms
of the 10 000 values of Bi are all very close to being Gaussian, and
thus yield
![]() .
.
We derived separate solutions for EGS and PSR. We used all PSR with
reliable RM estimates (i.e., those displayed in the upper panel of
Fig. 2) and not just those beyond 5 or 6 kpc, which are
shown in the lower panel of the same figure. The results are displayed
in Fig. 4 for both EGS and PSR, and for 2 ![]() models
(CL02, and
models
(CL02, and
![]() cm-3). Each subpanel contains 12 field
strengths with their bootstrap errors. These are arranged (from left
to right) in three groups of pitch angle (
cm-3). Each subpanel contains 12 field
strengths with their bootstrap errors. These are arranged (from left
to right) in three groups of pitch angle (
![]() ,
,
![]() ,
,
![]() ), and each group contains the solutions for the four arm
widths (0.8 kpc, 1 kpc, 1.2 kpc, 1.4 kpc), also ordered from left to right.
), and each group contains the solutions for the four arm
widths (0.8 kpc, 1 kpc, 1.2 kpc, 1.4 kpc), also ordered from left to right.
The most remarkable result in Fig. 4 is that the
character of the solutions depends relatively little on the geometric
details of the model (i.e., pitch angle and armwidth). In other words,
the data that we used appear to define a generic solution. The
three field strengths that are determined at ![]()
![]() (for the
Norma and Crux arms, and for the Norma-Crux interarm region) always
show very convincing evidence for reversals. Because the relative
contributions of arm and interarm regions vary with assumed arm width,
the inferred field strengths in arms are lower for larger arm widths,
while in interarm regions the opposite is true. However, the effects
are not large and the handedness is not affected.
(for the
Norma and Crux arms, and for the Norma-Crux interarm region) always
show very convincing evidence for reversals. Because the relative
contributions of arm and interarm regions vary with assumed arm width,
the inferred field strengths in arms are lower for larger arm widths,
while in interarm regions the opposite is true. However, the effects
are not large and the handedness is not affected.
The dependence of the solution on the ![]() -model is slightly
different for EGS and PSR. For the EGS, the field strengths scale more
or less with the inverse of
-model is slightly
different for EGS and PSR. For the EGS, the field strengths scale more
or less with the inverse of
![]() .
However, the details in the CL02
model produce deviations from strict inverse proportionality, and
change the significance of the Bi-values. In contrast, the field
strengths derived from the PSR appear to scale more weakly with
.
However, the details in the CL02
model produce deviations from strict inverse proportionality, and
change the significance of the Bi-values. In contrast, the field
strengths derived from the PSR appear to scale more weakly with
![]() .
This relative independence from the assumed
.
This relative independence from the assumed ![]() -model is
not unexpected. Although the PSR distances differ on average by a
factor of 1.5 (see Sect. 5.1) between the two models, about
60% of the PSR assigments are unchanged. The field strengths implied
by the PSR with unchanged assignment hardly change because the product
of
-model is
not unexpected. Although the PSR distances differ on average by a
factor of 1.5 (see Sect. 5.1) between the two models, about
60% of the PSR assigments are unchanged. The field strengths implied
by the PSR with unchanged assignment hardly change because the product
of ![]() and distance (i.e., DM) is unchanged. Only for the Norma arm
does Bi differ significantly between the two
and distance (i.e., DM) is unchanged. Only for the Norma arm
does Bi differ significantly between the two ![]() -models, because
very few PSR are assigned to that arm in the CL02 model.
-models, because
very few PSR are assigned to that arm in the CL02 model.
Table 1: The field strengths in the best-fit model in which the field has circular symmetry.
The significant reversals that we find in the inner Galaxy were, to some extent, already hinted at in Han et al. (2006) and Brown et al. (2007), although in the latter analysis the location of, in particular, the Norma arm differs substantially from ours. However, in neither of these studies was the significance and robustness of the result discussed. Our analysis shows that the field beyond the Crux arm is not constrained by the present data for EGS or PSR. Therefore, we attribute the apparent discrepancy between the results of Han et al. (2006) and Brown et al. (2007) for, in particular, the Carina arm to structure inIncidentally, the field strenghths and directions implied by EGS and
PSR for the Norma and Crux arms and the Norma-Crux interarm region
agree quite well. This is probably a manifestation of the fact that
the projection of the field (as a result of the angle between field
vector and line-of-sight) reduces the contribution to RM from the
nearer and more distant parts of the line-of-sight. In other words,
the sections of the line-of-sight closest to the tangent point of an
arm c.q. interarm region contribute most to the integral of the
product of ![]() and
and ![]() .
This argument appears to apply equally
to EGS and PSR, in spite of the considerable uncertainties in the PSR
distances.
.
This argument appears to apply equally
to EGS and PSR, in spite of the considerable uncertainties in the PSR
distances.
A general feature of all solutions is the absence of clear systematic
trends in
![]() (the difference between data and model) and
this supports the evidence from the bootstrap errors. However, the
large values of
(the difference between data and model) and
this supports the evidence from the bootstrap errors. However, the
large values of ![]() clearly indicate that the model is
oversimplified. This is evident from
clearly indicate that the model is
oversimplified. This is evident from
![]() ,
which, for the
24 model fits, is
,
which, for the
24 model fits, is
![]() rad m-2 for the EGS and
rad m-2 for the EGS and ![]() rad m-2 for the PSR. The very small dispersions in
rad m-2 for the PSR. The very small dispersions in
![]() of
of ![]() 10 rad m-2 around their mean values imply that it
is not sensible to announce a best-fit model. The uncertainty in the
10 rad m-2 around their mean values imply that it
is not sensible to announce a best-fit model. The uncertainty in the
![]() -model and the use of two types of tracers (EGS and PSR),
combined with the very uniform fit quality, preclude the choice of a
true best-fit model for the large-scale field. We note that the
-model and the use of two types of tracers (EGS and PSR),
combined with the very uniform fit quality, preclude the choice of a
true best-fit model for the large-scale field. We note that the
![]() of the EGS is somewhat, but significantly, larger than
that of the PSR. One explanation for this could be the non-negligible
intrinsic RMs of the EGS.
of the EGS is somewhat, but significantly, larger than
that of the PSR. One explanation for this could be the non-negligible
intrinsic RMs of the EGS.
It is interesting to see how the four solutions that formally provide
the best fit to the data reproduce the character of the observed
RM(l). This is shown in Fig. 5. It is clear,
especially from the left panels, that the global trends, and in
particular the changes of sign, are reproduced quite well by
the models. At the same time, it is also clear that the limitations of the
models (with fixed pitch angle and armwidth) results in
less-than-perfect agreement. However, it is remarkable that the large
values of
![]() ,
which quantify the mismatch between data
and model, are essentially identical for all models. In
Sect. 7, we argue that this spread can (and most probably
must) be attributed primarily to small-scale structure in the magnetic
field, which acts as ``noise'' in the solutions for the large-scale
field.
,
which quantify the mismatch between data
and model, are essentially identical for all models. In
Sect. 7, we argue that this spread can (and most probably
must) be attributed primarily to small-scale structure in the magnetic
field, which acts as ``noise'' in the solutions for the large-scale
field.
![\begin{figure}
\par\includegraphics[width=8.8cm,clip]{11803fg5.ps}
\end{figure}](/articles/aa/full_html/2010/05/aa11803-09/img89.png)
|
Figure 5:
A comparison of the observed RM values (filled symbols)
used in the solutions ( left: EGS, right: PSR; top |
| Open with DEXTER | |
Although we argued that unreliable values of RM should not be used,
we did derive solutions in which we used all data, to understand how
the inclusion of unreliable RMs may have affected earlier work. For
the EGS, the significance of the field strength determinations is more
or less unchanged, but for the PSR the significance is reduced. The
inclusion of the ``rejected'' data causes the field in the Carina arm to
become moderately significant (
![]() according to the EGS and
according to the EGS and ![]()
![]() according to the PSR) with a strength of
according to the PSR) with a strength of ![]()
![]() G
and CW handedness. It is interesting that the
G
and CW handedness. It is interesting that the
![]() of the
rejected data w.r.t. the solutions based on the reliable
data are
of the
rejected data w.r.t. the solutions based on the reliable
data are
![]() (EGS) and
(EGS) and
![]() (PSR). Comparison of these
values with
(PSR). Comparison of these
values with
![]() of the reliable data indicates that we
have removed a large part of the effect of
of the reliable data indicates that we
have removed a large part of the effect of ![]() -structure by
excluding the unreliable RM-values. It is interesting that the
difference is larger for PSR than for EGS.
-structure by
excluding the unreliable RM-values. It is interesting that the
difference is larger for PSR than for EGS.
For completeness, we also fitted a ring model to the reliable
data for
EGS and PSR, even though circular fields require large-scale
electrical currents that cannot be maintained. We used 8 rings
between 4 and 12 kpc with widths of 1 kpc, so that
the number of unknown field
strengths is essentially identical to that in the solutions for the
spiral-arm-related field. This ring width is also very close to that
used by Vallée (2008a). The model fits the data with a spread
that is very comparable to that of the models with a spiral-arm
related field, as is evident from the very similar values of
![]() and bootstrap errors, at least within 9 kpc. As with the
spiral-arm models, there are no systematic trends in
and bootstrap errors, at least within 9 kpc. As with the
spiral-arm models, there are no systematic trends in
![]() .
.
The result is shown in Table 1. The agreement between
EGS and PSR is not as good as in the previous solutions (see
Fig. 4). The inner three rings show a field reversal,
which is significant in the models with constant ![]() ,
but far less
so for the CL02
,
but far less
so for the CL02 ![]() -model. In all other rings, the results are
either not significant or not concordant between EGS and PSR.
-model. In all other rings, the results are
either not significant or not concordant between EGS and PSR.
Using 554 PSR in all 4 Galactic quadrants, Vallée finds that the
Galaxy has a large-scale CW field (i.e. B>0), but the ring between
![]() 5 and
5 and ![]() 8 kpc has a CCW field. It is not clear if a
comparison between our solution and that obtained by
Vallée (2008a) is meaningful because the latitude selection of
that sample is unclear. However, if we assume this comparison to be
sensible, we must conclude that there is a disagreement between
Vallée's ring model fit and ours. Between 4 and 5 kpc, the EGS
indicate a field that is CCW, in contrast to the result of
Vallée. The PSR data in this radial range are consistent with the
EGS data, and one would expect Vallée's larger PSR sample to also
show this reversal. This disagreement, combined with the rather poor
agreement between our EGS and PSR ring model solutions, throws serious
observational doubt on the reality of the ring model.
8 kpc has a CCW field. It is not clear if a
comparison between our solution and that obtained by
Vallée (2008a) is meaningful because the latitude selection of
that sample is unclear. However, if we assume this comparison to be
sensible, we must conclude that there is a disagreement between
Vallée's ring model fit and ours. Between 4 and 5 kpc, the EGS
indicate a field that is CCW, in contrast to the result of
Vallée. The PSR data in this radial range are consistent with the
EGS data, and one would expect Vallée's larger PSR sample to also
show this reversal. This disagreement, combined with the rather poor
agreement between our EGS and PSR ring model solutions, throws serious
observational doubt on the reality of the ring model.
7 The small-scale magnetic field as the primary source of

Men et al. (2008) concluded that the three theoretical models of the
large-scale field that they used are ruled out almost equally by the
data. The reason is that, while in some regions in the disk the value
of
![]() indicates that a particular model is acceptable,
there are always several regions where
indicates that a particular model is acceptable,
there are always several regions where
![]() .
The
large spreads around our best-fit solutions are probably a
manifestation of the same problem, even though our analysis is limited
to the 4th quadrant. Yet, as we argue below, the large values of
.
The
large spreads around our best-fit solutions are probably a
manifestation of the same problem, even though our analysis is limited
to the 4th quadrant. Yet, as we argue below, the large values of
![]() and
and
![]() do not invalidate the concept of
a large-scale field.
do not invalidate the concept of
a large-scale field.
In our attempt to eliminate the influence of significant structure in
![]() ,
we used a threshold in the
,
we used a threshold in the
![]() -distribution around
the object corresponding to the 95th percentile (see
Sect. 3.1). We made this choice because the sample defined
by that threshold yields the smallest value of
-distribution around
the object corresponding to the 95th percentile (see
Sect. 3.1). We made this choice because the sample defined
by that threshold yields the smallest value of
![]() .
Although it is likely that most of the high-amplitude structure in
.
Although it is likely that most of the high-amplitude structure in
![]() has been eliminated, it is not possible to quantify the extent
to which the accepted data are still affected by low-amplitude
has been eliminated, it is not possible to quantify the extent
to which the accepted data are still affected by low-amplitude
![]() -structure. Even so, we consider it very likely that the large
values of
-structure. Even so, we consider it very likely that the large
values of
![]() for the reliable data are primarily due to
small-scale field structure superimposed on the large-scale magnetic
field.
for the reliable data are primarily due to
small-scale field structure superimposed on the large-scale magnetic
field.
The amplitude of the small-scale magnetic field can, and has been,
estimated from PSR pairs. For each PSR pair with sufficiently small
angular distance that the spatial separation is mainly in the
l.o.s.-direction, one can derive
![]() from the observed
RM and DM-values as
from the observed
RM and DM-values as
![]() .
This was
previously done by Ohno & Shibata (1993) and Rand & Kulkarni (1989), following
Ruzmaikin et al. (1988). In Fig. 6, we show the result for
our ``reliable'' PSR, for pairs in arm regions (left panel) and interarm
regions (right panel). The assignment of the PSR uses arms with a
pitch angle
.
This was
previously done by Ohno & Shibata (1993) and Rand & Kulkarni (1989), following
Ruzmaikin et al. (1988). In Fig. 6, we show the result for
our ``reliable'' PSR, for pairs in arm regions (left panel) and interarm
regions (right panel). The assignment of the PSR uses arms with a
pitch angle
![]() ,
width d = 1.0 kpc, and
,
width d = 1.0 kpc, and
![]() cm-3. We mention in passing that there may be a small difference
between arm and interarm regions in the expected sense (smaller
cm-3. We mention in passing that there may be a small difference
between arm and interarm regions in the expected sense (smaller
![]() in interarm regions). However, in view of the
distance uncertainties of the PSR and the associated uncertainty in
the assignment to arms and interarm regions, it is not possible to
estimate its significance.
in interarm regions). However, in view of the
distance uncertainties of the PSR and the associated uncertainty in
the assignment to arms and interarm regions, it is not possible to
estimate its significance.
| Figure 6:
|
|
| Open with DEXTER | |
The result in Fig. 6 is very similar to that obtained by
Ohno & Shibata (1993), who used a sample of 182 Galactic PSR in all 4 quadrants. They also found that
![]() shows a global
inverse dependence on
shows a global
inverse dependence on ![]() ,
with a maximum value of
,
with a maximum value of ![]()
![]() G for
G for
![]() cm-3 pc, while at each value of
cm-3 pc, while at each value of
![]() ,
,
![]() exhibits a range of up to 2
decades. For that reason, we refrain from a detailed analysis of the
result in Fig. 6, but instead we reiterate the main
conclusions of their analysis.
exhibits a range of up to 2
decades. For that reason, we refrain from a detailed analysis of the
result in Fig. 6, but instead we reiterate the main
conclusions of their analysis.
On the assumption that all cells have the same size, Ohno & Shibata (1993)
derive the strength of the random field, ![]() ,
that reproduces
the observed global slope of the upper envelope of
,
that reproduces
the observed global slope of the upper envelope of
![]() as a function of assumed cell size L. Although the stochastic nature
of the model produces a spread in
as a function of assumed cell size L. Although the stochastic nature
of the model produces a spread in
![]() ,
the latter is
generally smaller than observed. Therefore, they conclude that the
observed spread also implies a significant spread in
,
the latter is
generally smaller than observed. Therefore, they conclude that the
observed spread also implies a significant spread in ![]() .
It appears
that the data can be represented fairly well for a range of assumed
cell sizes and
.
It appears
that the data can be represented fairly well for a range of assumed
cell sizes and ![]() -fluctuations. They estimate
-fluctuations. They estimate ![]() to be 4-6
to be 4-6 ![]() G (which should be compared to their estimate of 1-2
G (which should be compared to their estimate of 1-2 ![]() G
for the regular field), essentially independent of assumed cell size
and spread in
G
for the regular field), essentially independent of assumed cell size
and spread in ![]() .
.
It seems plausible that the significant spread in ![]() ,
required in
the analysis of Ohno & Shibata (1993) to match the data, is partly a result
of the assumption of fixed cell size. A more realistic assumption of a
spectrum of linear scales for
,
required in
the analysis of Ohno & Shibata (1993) to match the data, is partly a result
of the assumption of fixed cell size. A more realistic assumption of a
spectrum of linear scales for ![]() will produce a spread in
will produce a spread in
![]() for fixed
for fixed ![]() ,
which reduces the spread in
,
which reduces the spread in
![]() required by the single cell size analysis. This may be the
reason why our data do not show a smaller range of
required by the single cell size analysis. This may be the
reason why our data do not show a smaller range of
![]() ,
even though we excluded lines of sight with abundant
,
even though we excluded lines of sight with abundant ![]() -structure.
However, the main conclusion remains that a
-structure.
However, the main conclusion remains that a ![]() of 4-6
of 4-6 ![]() G
is required to produce the observed maximum values of
G
is required to produce the observed maximum values of
![]() at each
at each ![]() .
.
By implication, the small-scale field is an important (if not the) contributor to the
![]() of the reliable RM-values
around the best-fit models. This means that the
of the reliable RM-values
around the best-fit models. This means that the
![]() values obtained e.g., by Men et al. (2008) will be significantly reduced
when the small-scale field is included in the prediction of the
uncertainty in the observed RM-estimates. Any model of the (spectrum
of the) small-scale field should reproduce the observed
values obtained e.g., by Men et al. (2008) will be significantly reduced
when the small-scale field is included in the prediction of the
uncertainty in the observed RM-estimates. Any model of the (spectrum
of the) small-scale field should reproduce the observed
![]() of the PSR pairs. Therefore, one would predict the
value of
of the PSR pairs. Therefore, one would predict the
value of
![]() to be very close to
to be very close to
![]() ,
especially because we
significantly suppressed the contribution to
,
especially because we
significantly suppressed the contribution to
![]() by
by
![]() -structure in our sample. The value of
-structure in our sample. The value of
![]() predicted
from the observed
predicted
from the observed
![]() values of the PSR pairs is 162 rad m-2 (the average for all 24 models), which should be compared to
the observed value of
values of the PSR pairs is 162 rad m-2 (the average for all 24 models), which should be compared to
the observed value of
![]() rad m-2. As a result, the
predicted values of
rad m-2. As a result, the
predicted values of ![]() are close to unity for all models that we
considered.
are close to unity for all models that we
considered.
Table 2: The rejected extragalactic sources.
Table 3: The rejected PSR.
Table 4: The extragalactic sources with reliable RM estimates
Table 5: The PSR with reliable RM estimates.
8 Summary and discussion
We have used published rotation-measure (RM) data for low-latitude
pulsars (PSR) and extragalactic sources (EGS) to study the large-scale
magnetic field in the fourth Galactic quadrant. Because RM is the
integral of the product of the l.o.s. component of the field and the
electron density, one must take special care to obtain a ``view'' of the
field that is as unaffected as possible by structure in the electron
density. We therefore identified and rejected RM estimates of
objects for which the emission measure (EM) indicates a high
probability of a large amount of ![]() -structure somewhere along the
line of sight.
-structure somewhere along the
line of sight.
The need for this cleaning of the data is evident from the finding
that the lines of sight with a high probability of strong
![]() -structure turn out to be preferentially those with large RMvalues. Because the average
-structure turn out to be preferentially those with large RMvalues. Because the average ![]() did not enter the selection, this
confirms our presumption that the RM values corresponding to
uncharacteristically large EM-values are indeed less reliable. Not
surprisingly, the spread of the rejected data about the model that we
fit to the accepted data appears to be about twice as large as that of
the accepted data around the solution that they define. We have also
identified and rejected RM estimates that are likely to be
unreliable because the line of sight towards the object appears to be
intercepted by a supernova remnant.
did not enter the selection, this
confirms our presumption that the RM values corresponding to
uncharacteristically large EM-values are indeed less reliable. Not
surprisingly, the spread of the rejected data about the model that we
fit to the accepted data appears to be about twice as large as that of
the accepted data around the solution that they define. We have also
identified and rejected RM estimates that are likely to be
unreliable because the line of sight towards the object appears to be
intercepted by a supernova remnant.
We have modeled the dependence of RM on Galactic longitude, RM(l),
of the objects with ``reliable'' RM values, for EGS and PSR, by making
least-squares fits to the observed RM(l). We used the
![]() -distribution from Cordes and Lazio as well as a constant
-distribution from Cordes and Lazio as well as a constant
![]() -value (of 0.04 cm-3), combined with several models of the
arm-interarm structure of the large-scale field. The arms were mostly
assumed to be logarithmic spirals, and their pitch angle and width
were varied. We also considered a model in which the field has
circular symmetry.
-value (of 0.04 cm-3), combined with several models of the
arm-interarm structure of the large-scale field. The arms were mostly
assumed to be logarithmic spirals, and their pitch angle and width
were varied. We also considered a model in which the field has
circular symmetry.
The most remarkable result for a field with logarithmic-spiral
structure is that the details of the spiral-arm model (pitch angle,
armwidth) and ![]() -distribution hardly affect the character of
the solution. The data that we used thus appear to define a generic solution, with well-defined field strengths of a few
-distribution hardly affect the character of
the solution. The data that we used thus appear to define a generic solution, with well-defined field strengths of a few ![]() G
for the Norma and Crux arms and for the Norma-Crux interarm region,
and these always show convincing evidence for reversals. For the
well-defined field strengths, there is good agreement between the
evidence from EGS and from PSR. Beyond the Crux arm, the present data
do not constrain the large-scale field, and that probably explains
previous contradictory results for, in particular, the Carina arm.
G
for the Norma and Crux arms and for the Norma-Crux interarm region,
and these always show convincing evidence for reversals. For the
well-defined field strengths, there is good agreement between the
evidence from EGS and from PSR. Beyond the Crux arm, the present data
do not constrain the large-scale field, and that probably explains
previous contradictory results for, in particular, the Carina arm.
In their modeling, Brown et al. (2007) assumed that the strength of the large-scale field decreases with Galactocentric radius, following results by Heiles (1996), Beck (2001), and Brown et al. (2003). However, we do not find strong evidence for a systematic variation with galactocentric radius of the strength of the large-scale field. This is not inconsistent with the global assertion in the literature that models of the Galactic synchrotron emission require a larger field strength in the central regions of the Galaxy because that does not specifically refer to the regular field.
We argue that the model in which the field has circular symmetry is less likely to be correct. This is because our 4th-quadrant solution for an axially symmetric field does not agree with that obtained by Vallée, who used PSR in all four quadrants. In addition, the evidence from EGS and PSR is less concordant for the circularly symmetric model than for the spiral-arm models. Incidentally, the solutions based on PSR data involve distance estimates that are mostly based on dispersion measures and that are therefore quite uncertain.
We are thus led to a picture in which the magnetic field of the Galaxy has a clear large-scale structure that is related to the spiral arms. This large-scale field, of rather modest amplitude, shows clear reversals at each arm-interarm interface where our data have sufficient weight. It has been suggested that the reversals of the Galactic magnetic field must be suspect, because only very few external galaxies show evidence for field reversals. In addition, the reversals that are observed seem to have a different character from those in the Galaxy (see, e.g., Beck 2009). However, only future studies of the distribution of rotation measures of extragalactic background sources observed through the disk of inclined nearby, well-resolved spiral galaxies, as discussed e.g., by Stepanov et al. (2008), can tell whether the Galaxy is indeed exceptional as far as the large-scale magnetic field is concerned.
Superimposed on this large-scale field is a small-scale field, which,
on the basis of evidence from PSR pairs, is estimated to be at least
as strong as the large-scale field on scales below ![]() 1 kpc. That
external galaxies have not yet shown the kind of small-scale field
that is evident in the Galaxy is probably mostly due to limited
resolution. It must be realized that the small-scale field that
produces the measured
1 kpc. That
external galaxies have not yet shown the kind of small-scale field
that is evident in the Galaxy is probably mostly due to limited
resolution. It must be realized that the small-scale field that
produces the measured
![]() shown in
Fig. 6 is, by construction, mostly directed along the
arm. Unfortunately, the present data do not allow a study of the
small-scale structure of the field perpendicular to the arms in the
Galactic plane.
shown in
Fig. 6 is, by construction, mostly directed along the
arm. Unfortunately, the present data do not allow a study of the
small-scale structure of the field perpendicular to the arms in the
Galactic plane.
Our study is restricted to the midplane in the fourth Galactic quadrant, which precludes conclusions about the overall structure of the field. Nevertheless, it is interesting to confront the observed field reversals in the fourth quadrant to models of the large-scale field discussed in the literature. Our best-fit model of the large-scale field seems to resemble most closely the quadrisymmetric (QSS) spiral model illustrated, e.g., in Fig. 2 of Stepanov et al. (2008). How a field with such a configuration, i.e., with many reversals, is formed is a question that still needs to be answered, in spite of the general opinion that a dynamo is involved. A possible clue to the source of the reversals may be the connection between the velocity profile (across pressure maxima and minima in a galactic disc) and the direction of the field, found in numerical MHD calculations by Dziourkevitch et al. (2004) and Johansen et al. (2009).
An equally interesting question is how the modest large-scale field
can coexist with the larger-amplitude small-scale field, which
dominates on scales below ![]() 1 kpc. The small-scale field is
probably generated by local injections of kinetic energy (from
supernova explosions), which produce currents that generate local
amplification of the field on the relevant scales. In dynamo theory,
the coexistence of the large- and small-scale fields is a natural
consequence of the feeding of the large-scale field from the
small-scale field (see, e.g., Arshakian et al. 2009). This phenomenon
(``inverse cascade'') is seen in direct numerical simulations, e.g., by
Brandenburg (2001), where a robust and well-defined average field
(which was not imposed) coexists with a small-scale field that has a
dispersion
1 kpc. The small-scale field is
probably generated by local injections of kinetic energy (from
supernova explosions), which produce currents that generate local
amplification of the field on the relevant scales. In dynamo theory,
the coexistence of the large- and small-scale fields is a natural
consequence of the feeding of the large-scale field from the
small-scale field (see, e.g., Arshakian et al. 2009). This phenomenon
(``inverse cascade'') is seen in direct numerical simulations, e.g., by
Brandenburg (2001), where a robust and well-defined average field
(which was not imposed) coexists with a small-scale field that has a
dispersion ![]() 3 times larger than this average field. Simulations
of the Parker instability in a strongly magnetised medium have shown
that a large-scale radial field arises, with several reversals above
and below the mid-plane of the disc (Hanasz et al. 2002; Johansen & Levin 2008).
Calculations in which supernovae provide most of the energy input show
the creation of a similar large-scale magnetic field that exhibits
reversals in time (Gressel et al. 2008).
3 times larger than this average field. Simulations
of the Parker instability in a strongly magnetised medium have shown
that a large-scale radial field arises, with several reversals above
and below the mid-plane of the disc (Hanasz et al. 2002; Johansen & Levin 2008).
Calculations in which supernovae provide most of the energy input show
the creation of a similar large-scale magnetic field that exhibits
reversals in time (Gressel et al. 2008).
We thank the referee, Rainer Beck, for probing questions that triggered a broadening of our discussion, as a result of which the conclusions have become more generic. We thank Dominic Schnitzeler for useful discussions and help with the use of the CL02 model, and Marijke Haverkorn for helpful comments. We especially appreciate discussions with Anders Johansen about possible links between the observational results and state-of-the-art MHD modeling.
References
- Arnal, E. M., May, J., & Romero, G. A. 2003, A&A, 412, 431 [NASA ADS] [CrossRef] [EDP Sciences] [Google Scholar]
- Arshakian, T. G., Beck, R., Krause, M., & Sokoloff, D. 2009, A&A, 494, 21 [NASA ADS] [CrossRef] [EDP Sciences] [Google Scholar]
- Avedisova, V. S., & Palous, J. 1989, Bull. Astron. Inst. Czechoslovakia, 40, 42 [Google Scholar]
- Beck, R. 2001, Space Sci. Rev., 99, 243 [NASA ADS] [CrossRef] [Google Scholar]
- Beck, R. 2007, in EAS Publ. Ser., 23, 19 [Google Scholar]
- Beck, R. 2009, Rev. Mex. Astron. Astrofis. Conf. Ser., 36, 1 [NASA ADS] [Google Scholar]
- Beck, R., Shukurov, A., Sokoloff, D., & Wielebinski, R. 2003, A&A, 411, 99 [NASA ADS] [CrossRef] [EDP Sciences] [Google Scholar]
- Benaglia, P., & Cappa, C. E. 1999, A&A, 346, 979 [NASA ADS] [Google Scholar]
- Berkhuijsen, E. M., & Müller, P. 2008, A&A, 490, 179 [NASA ADS] [CrossRef] [EDP Sciences] [Google Scholar]
- Berkhuijsen, E. M., Mitra, D., & Mueller, P. 2006, Astron. Nachr., 327, 82 [NASA ADS] [CrossRef] [Google Scholar]
- Blitz, L., Fich, M., & Stark, A. A. 1982, ApJS, 49, 183 [NASA ADS] [CrossRef] [Google Scholar]
- Bocchino, F., Parmar, A. N., Mereghetti, S., et al. 2001, A&A, 367, 629 [NASA ADS] [CrossRef] [EDP Sciences] [Google Scholar]
- Brandenburg, A. 2001, ApJ, 550, 824 [NASA ADS] [CrossRef] [Google Scholar]
- Broten, N. W., MacLeod, J. M., & Vallee, J. P. 1988, Ap&SS, 141, 303 [NASA ADS] [CrossRef] [Google Scholar]
- Brown, J. C., & Taylor, A. R. 2001, ApJ, 563, L31 [NASA ADS] [CrossRef] [Google Scholar]
- Brown, J. C., Taylor, A. R., Wielebinski, R., & Mueller, P. 2003, ApJ, 592, L29 [NASA ADS] [CrossRef] [Google Scholar]
- Brown, J. C., Haverkorn, M., Gaensler, B. M., et al. 2007, ApJ, 663, 258 [NASA ADS] [CrossRef] [Google Scholar]
- Caraveo, P. A., De Luca, A., Mignani, R. P., & Bignami, G. F. 2001, ApJ, 561, 930 [NASA ADS] [CrossRef] [Google Scholar]
- Caswell, J. L., McClure-Griffiths, N. M., & Cheung, M. C. M. 2004, MNRAS, 352, 1405 [NASA ADS] [CrossRef] [Google Scholar]
- Cha, A. N., Sembach, K. R., & Danks, A. C. 1999, ApJ, 515, L25 [NASA ADS] [CrossRef] [Google Scholar]
- Clegg, A. W., Cordes, J. M., Simonetti, J. M., & Kulkarni, S. R. 1992, ApJ, 386, 143 [NASA ADS] [CrossRef] [Google Scholar]
- Cordes, J. M., & Lazio, T. J. W. 2002 [arXiv:astro-ph/0207156] [Google Scholar]
- Cordes, J. M., & Lazio, T. J. W. 2003 [arXiv:astro-ph/0301598] [Google Scholar]
- Dodson, R., & Golap, K. 2002, MNRAS, 334, L1 [NASA ADS] [CrossRef] [Google Scholar]
- Duncan, A. R., Haynes, R. F., Stewart, R. T., & Jones, K. L. 1995a, MNRAS, 277, 319 [NASA ADS] [Google Scholar]
- Duncan, A. R., Stewart, R. T., Haynes, R. F., & Jones, K. L. 1995b, MNRAS, 277, 36 [NASA ADS] [Google Scholar]
- Dziourkevitch, N., Elstner, D., & Rüdiger, G. 2004, A&A, 423, L29 [NASA ADS] [CrossRef] [EDP Sciences] [Google Scholar]
- Frick, P., Stepanov, R., Shukurov, A., & Sokoloff, D. 2001, MNRAS, 325, 649 [NASA ADS] [CrossRef] [Google Scholar]
- Gaensler, B. M., Dickey, J. M., McClure-Griffiths, N. M., et al. 2001, ApJ, 549, 959 [NASA ADS] [CrossRef] [Google Scholar]
- Gaensler, B. M., Madsen, G. J., Chatterjee, S., & Mao, S. A. 2008, PASA, 25, 184 [NASA ADS] [CrossRef] [Google Scholar]
- Gaustad, J. E., McCullough, P. R., Rosing, W., & Van Buren, D. 2001, PASP, 113, 1326 [NASA ADS] [CrossRef] [Google Scholar]
- Georgelin, Y. M., Boulesteix, J., Georgelin, Y. P., Laval, A., & Marcelin, M. 1987, A&A, 174, 257 [NASA ADS] [Google Scholar]
- Georgelin, Y. M., Boulesteix, J., Georgelin, Y. P., Le Coarer, E., & Marcelin, M. 1988, A&A, 205, 95 [NASA ADS] [Google Scholar]
- Georgelin, Y. M., Russeil, D., Marcelin, M., et al. 1996, A&AS, 120, 41 [Google Scholar]
- Georgelin, Y. M., Russeil, D., Amram, P., et al. 2000, A&A, 357, 308 [NASA ADS] [Google Scholar]
- Giacani, E. B., Frail, D. A., Goss, W. M., & Vieytes, M. 2001, AJ, 121, 3133 [NASA ADS] [CrossRef] [Google Scholar]
- Green, D. A. 2004, Bull. Astron. Soc. India, 32, 335 [NASA ADS] [Google Scholar]
- Gressel, O., Elstner, D., Ziegler, U., & Rüdiger, G. 2008, A&A, 486, L35 [NASA ADS] [CrossRef] [EDP Sciences] [Google Scholar]
- Grewing, M., & Walmsley, M. 1971, A&A, 11, 65 [NASA ADS] [Google Scholar]
- Han, J. L., Manchester, R. N., & Qiao, G. J. 1999, MNRAS, 306, 371 [NASA ADS] [CrossRef] [Google Scholar]
- Han, J. L., Manchester, R. N., Lyne, A. G., Qiao, G. J., & van Straten, W. 2006, ApJ, 642, 868 [NASA ADS] [CrossRef] [Google Scholar]
- Hanasz, M., Otmianowska-Mazur, K., & Lesch, H. 2002, A&A, 386, 347 [NASA ADS] [CrossRef] [EDP Sciences] [Google Scholar]
- Haverkorn, M., Brown, J. C., Gaensler, B. M., & McClure-Griffiths, N. M. 2008, ApJ, 680, 362 [NASA ADS] [CrossRef] [Google Scholar]
- Heiles, C. 1996, in Polarimetry of the Interstellar Medium, ed. W. G. Roberge, & D. C. B. Whittet, ASP Conf. Ser., 97, 457 [Google Scholar]
- Indrani, C., & Deshpande, A. A. 1999, New Astron., 4, 33 [NASA ADS] [CrossRef] [Google Scholar]
- Johansen, A., & Levin, Y. 2008, A&A, 490, 501 [NASA ADS] [CrossRef] [EDP Sciences] [Google Scholar]
- Johansen, A., Youdin, A., & Klahr, H. 2009, ApJ, 697, 1269 [NASA ADS] [CrossRef] [Google Scholar]
- Kaspi, V. M., Manchester, R. N., Johnston, S., Lyne, A. G., & D'Amico, N. 1992, ApJ, 399, L155 [NASA ADS] [CrossRef] [Google Scholar]
- Men, H., Ferrière, K., & Han, J. L. 2008, A&A, 486, 819 [NASA ADS] [CrossRef] [EDP Sciences] [Google Scholar]
- Mitra, D., & Ramachandran, R. 2001, A&A, 370, 586 [NASA ADS] [CrossRef] [EDP Sciences] [Google Scholar]
- Mitra, D., Wielebinski, R., Kramer, M., & Jessner, A. 2003, A&A, 398, 993 [NASA ADS] [CrossRef] [EDP Sciences] [Google Scholar]
- Noutsos, A., Johnston, S., Kramer, M., & Karastergiou, A. 2008, MNRAS, 386, 1881 [NASA ADS] [CrossRef] [Google Scholar]
- Ohno, H., & Shibata, S. 1993, MNRAS, 262, 953 [NASA ADS] [Google Scholar]
- Prentice, A. J. R., & Ter Haar, D. 1969, MNRAS, 146, 423 [NASA ADS] [CrossRef] [Google Scholar]
- Rand, R. J., & Kulkarni, S. R. 1989, ApJ, 343, 760 [NASA ADS] [CrossRef] [Google Scholar]
- Rand, R. J., & Lyne, A. G. 1994, MNRAS, 268, 497 [NASA ADS] [CrossRef] [Google Scholar]
- Rizzo, J. R., & Arnal, E. M. 1998, A&A, 332, 1025 [Google Scholar]
- Rodgers, A. W., Campbell, C. T., & Whiteoak, J. B. 1960, MNRAS, 121, 103 [NASA ADS] [CrossRef] [Google Scholar]
- Russeil, D. 2003, A&A, 397, 133 [NASA ADS] [CrossRef] [EDP Sciences] [Google Scholar]
- Ruzmaikin, A. A., Sokolov, D. D., & Shukurov, A. M., 1988, in Magnetic fields of galaxies, Ap&SS Library, 133 [Google Scholar]
- Sahu, M. S. 1992, Ph.D. Thesis, AA (Kapteyn Institute, Groningen, The Netherlands) [Google Scholar]
- Stepanov, R., Arshakian, T. G., Beck, R., Frick, P., & Krause, M. 2008, A&A, 480, 45 [NASA ADS] [CrossRef] [EDP Sciences] [Google Scholar]
- Tapia, M., Roth, M., Vázquez, R. A., & Persi, P. 2004, in Rev. Mex. Astron. Astrofis. Conf. Ser. 22, ed. G. Garcia-Segura, G. Tenorio-Tagle, J. Franco, & H. W. Yorke, 73 [Google Scholar]
- Taylor, J. H., Manchester, R. N., & Lyne, A. G. 2000, VizieR Online Data Catalog, 7189, 0 [Google Scholar]
- Vallée, J. P. 2005a, ApJ, 619, 297 [NASA ADS] [CrossRef] [Google Scholar]
- Vallée, J. P. 2005b, AJ, 130, 569 [NASA ADS] [CrossRef] [Google Scholar]
- Vallée, J. P. 2008a, ApJ, 681, 303 [NASA ADS] [CrossRef] [Google Scholar]
- Vallée, J. P. 2008b, AJ, 135, 1301 [NASA ADS] [CrossRef] [Google Scholar]
- Vazquez, R. A., & Baume, G. 2001, VizieR Online Data Catalog, 337, 10908 [NASA ADS] [Google Scholar]
- Weisberg, J. M., Cordes, J. M., Kuan, B., et al. 2004, ApJS, 150, 317 [NASA ADS] [CrossRef] [Google Scholar]
- Whiteoak, J. B. Z., & Green, A. J. 1996, A&AS, 118, 329 [NASA ADS] [CrossRef] [EDP Sciences] [Google Scholar]
- Whiting, C. A., Spangler, S. R., Ingleby, L. D., & Haffner, L. M. 2009, ApJ, 694, 1452 [NASA ADS] [CrossRef] [Google Scholar]
Footnotes
- ...
catalogue
![[*]](/icons/foot_motif.png)
- http://www.atnf.csiro.au/research/pulsar/psrcat
- ... available
- http://www.astro.cornell.edu/ cordes/CL02/
All Tables
Table 1: The field strengths in the best-fit model in which the field has circular symmetry.
Table 2: The rejected extragalactic sources.
Table 3: The rejected PSR.
Table 4: The extragalactic sources with reliable RM estimates
Table 5: The PSR with reliable RM estimates.
All Figures
|
|
Figure 1:
The RM estimates from the literature for EGS ( upper
panel) and PSR ( lower panel), versus Galactic longitude; there are
162 EGS and 180 PSR with
|
| Open with DEXTER | |
| In the text | |
|
|
Figure 2:
The dependence on Galactic longitude l of the reliable
RM values. In the upper panel, the PSR are shown, coded according
to distance (open symbols: PSR within 5 kpc; filled symbols: PSR
beyond 5 kpc). In the lower panel, the distant PSR (filled squares)
and extragalactic sources (open circles) are shown together; in this
panel, the lower limit to PSR distance is 6 kpc for
|
| Open with DEXTER | |
| In the text | |
|
|
Figure 3:
The regions with constant-amplitude field in our modeling
of the large-scale magnetic field in the fourth Galactic quadrant.
The definition of these regions is superimposed on a logarithmic
greyscale representation of CL02 for z = 0. The Sun is at x = 0,
y = 8.5. In the left panel, we show the definition for
|
| Open with DEXTER | |
| In the text | |
|
|
Figure 4:
The results of the model fits of RM(l) for the spiral-arm
related large-scale field, for EGS and PSR with CL02 |
| Open with DEXTER | |
| In the text | |
|
|
Figure 5:
A comparison of the observed RM values (filled symbols)
used in the solutions ( left: EGS, right: PSR; top |
| Open with DEXTER | |
| In the text | |
| |
Figure 6:
|
| Open with DEXTER | |
| In the text | |
Copyright ESO 2010
Current usage metrics show cumulative count of Article Views (full-text article views including HTML views, PDF and ePub downloads, according to the available data) and Abstracts Views on Vision4Press platform.
Data correspond to usage on the plateform after 2015. The current usage metrics is available 48-96 hours after online publication and is updated daily on week days.
Initial download of the metrics may take a while.