| Issue |
A&A
Volume 511, February 2010
|
|
|---|---|---|
| Article Number | A48 | |
| Number of page(s) | 9 | |
| Section | Stellar structure and evolution | |
| DOI | https://doi.org/10.1051/0004-6361/200913404 | |
| Published online | 05 March 2010 | |
The peculiar high-mass X-ray binary 1ES 1210-646![[*]](/icons/foot_motif.png)
N. Masetti1, R. Landi1, V. Sguera1, F. Capitanio2, L. Bassani1, A. Bazzano2, A. J. Bird3, A. Malizia1, and E. Palazzi1
1 - INAF - Istituto di Astrofisica Spaziale e Fisica Cosmica di
Bologna, via Gobetti 101, 40129 Bologna, Italy
2 -
INAF - Istituto di Astrofisica Spaziale e Fisica Cosmica di
Roma, via Fosso del Cavaliere 100, 00133 Rome, Italy
3 -
School of Physics & Astronomy, University of Southampton, Southampton,
Hampshire, SO17 1BJ, UK
Received 5 October 2009 / Accepted 7 December 2009
Abstract
Using data collected with the BeppoSAX, INTEGRAL
and Swift satellites, we report and discuss the results of a study
on the X-ray emission properties of the X-ray source 1ES 1210-646,
recently classified as a high-mass X-ray binary through optical
spectroscopy. This is the first in-depth analysis of the X-ray spectral
characteristics of this source. We found that the flux of 1ES 1210-646
varies by a factor of ![]() 3 on a timescale of hundreds of seconds
and by a factor of at least 10 among observations acquired over a time
span of several months. The X-ray spectrum of 1ES 1210-646 is described
using a simple powerlaw shape or, in the case of INTEGRAL data,
with a blackbody plus powerlaw model. Spectral variability is found in
connection with different flux levels of the source. A strong and
transient iron emission line with an energy of
3 on a timescale of hundreds of seconds
and by a factor of at least 10 among observations acquired over a time
span of several months. The X-ray spectrum of 1ES 1210-646 is described
using a simple powerlaw shape or, in the case of INTEGRAL data,
with a blackbody plus powerlaw model. Spectral variability is found in
connection with different flux levels of the source. A strong and
transient iron emission line with an energy of ![]() 6.7 keV and an
equivalent width of
6.7 keV and an
equivalent width of ![]() 1.6 keV is detected when the source is found at an
intermediate flux level. The line strength seems to be tied to the orbital
motion of the accreting object, as this feature is only apparent at the
periastron. Although the X-ray spectral description we find for the 1ES
1210-646 emission is quite atypical for a high-mass X-ray binary, the
multiwavelegth information available for this object leads us to confirm
this classification. The results presented here allow us instead to
definitely rule out the possibility that 1ES 1210-646 is a (magnetic)
cataclysmic variable as proposed previously and, in a broader sense, a
white dwarf nature for the accretor is disfavoured. X-ray spectroscopic
data actually suggest a neutron star with a low magnetic field as the
accreting object in this system.
1.6 keV is detected when the source is found at an
intermediate flux level. The line strength seems to be tied to the orbital
motion of the accreting object, as this feature is only apparent at the
periastron. Although the X-ray spectral description we find for the 1ES
1210-646 emission is quite atypical for a high-mass X-ray binary, the
multiwavelegth information available for this object leads us to confirm
this classification. The results presented here allow us instead to
definitely rule out the possibility that 1ES 1210-646 is a (magnetic)
cataclysmic variable as proposed previously and, in a broader sense, a
white dwarf nature for the accretor is disfavoured. X-ray spectroscopic
data actually suggest a neutron star with a low magnetic field as the
accreting object in this system.
Key words: binaries: general - X-rays: binaries - stars: neutron - techniques: spectroscopic - X-rays: individuals: 1ES 1210-646
1 Introduction
X-ray binaries are interacting systems in which a compact object, neutron
star (NS) or black hole (BH) is accreting matter from a companion star.
Depending on the mass of the latter, these systems are broadly divided
into high-mass X-ray binaries (HMXBs; if the companion is a massive early
type star) and low mass X-ray binaries (LMXBs; in the cases in which the
secondary star is of late spectral type, in general with mass ![]() 1
1 ![]() ).
).
Several X-ray binaries relatively bright in X-rays could not be properly identified and classified until recently due to the lack of a precise (arcsecond-sized) X-ray position: indeed, the X-ray characteristics may not provide enough elements for the correct classification of an X-ray binary as a HMXB or as a LMXB. This can therefore only be achieved through a multiwavelength approach, mostly with the synergic use of information acquired in X-ray and optical bands (although X-ray timing properties, such as bursts or pulsations, can give precise indications on the nature of the accretor). The subject of this paper, 1ES 1210-646, is indeed an object which fits the above description.
The X-ray source 1ES 1210-646 was first detected by the Uhuru
satellite and reported (as 4U 1210-64) in the 4![]() Uhuru
Catalogue (Forman et al. 1978) as a relatively bright and variable source
with a 2-6 keV flux of
Uhuru
Catalogue (Forman et al. 1978) as a relatively bright and variable source
with a 2-6 keV flux of
![]() erg cm-2 s-1,
assuming a Crab-like spectrum (below we will always assume this spectral
shape for our X-ray flux estimates unless explicitly stated otherwise).
It was also detected in the slew surveys performed with the Einstein
(Elvis et al. 1992) and EXOSAT (Reynolds et al. 1999) satellites, at
fluxes
erg cm-2 s-1,
assuming a Crab-like spectrum (below we will always assume this spectral
shape for our X-ray flux estimates unless explicitly stated otherwise).
It was also detected in the slew surveys performed with the Einstein
(Elvis et al. 1992) and EXOSAT (Reynolds et al. 1999) satellites, at
fluxes
![]() erg cm-2 s-1 (0.16-3.5 keV) and
erg cm-2 s-1 (0.16-3.5 keV) and
![]()
![]() erg cm-2 s-1 (1-8 keV), respectively.
More recently, this source was detected by the wide-field cameras (WFCs;
Jager et al. 1997) onboard BeppoSAX (Boella et al. 1997) at an
average flux of
erg cm-2 s-1 (1-8 keV), respectively.
More recently, this source was detected by the wide-field cameras (WFCs;
Jager et al. 1997) onboard BeppoSAX (Boella et al. 1997) at an
average flux of
![]() erg cm-2 s-1 in the 2-10 keV (Verrecchia et al. 2007), and at hard X-rays above 20 keV in the
surveys (Bird et al. 2007; Krivonos et al. 2007) obtained with the IBIS
instrument (Ubertini et al. 2003) onboard the INTEGRAL satellite
(Winkler et al. 2003), at a flux of
erg cm-2 s-1 in the 2-10 keV (Verrecchia et al. 2007), and at hard X-rays above 20 keV in the
surveys (Bird et al. 2007; Krivonos et al. 2007) obtained with the IBIS
instrument (Ubertini et al. 2003) onboard the INTEGRAL satellite
(Winkler et al. 2003), at a flux of
![]() erg cm-2 s-1 in the 20-100 keV band (Bird et al. 2007).
High-energy emission from 1ES 1210-646 was also detected
by Swift/BAT in the 14-195 keV band with a flux
erg cm-2 s-1 in the 20-100 keV band (Bird et al. 2007).
High-energy emission from 1ES 1210-646 was also detected
by Swift/BAT in the 14-195 keV band with a flux
![]()
![]() erg cm-2 s-1 (Tueller et al. 2010;
Cusumano et al. 2009).
erg cm-2 s-1 (Tueller et al. 2010;
Cusumano et al. 2009).
Unfortunately, the above X-ray detections had positional errors of the order of several arcminutes or worse, which severely hampered the search for longer-wavelength counterparts and in turn the determination of the nature of this source.
Things changed thanks to a pointed observation performed with the X-ray
telescope (XRT, Burrows et al. 2005) onboard the Swift satellite
(Gehrels et al. 2004): according to Revnivtsev et al. (2007), these data
revealed a clear counterpart of 1ES 1210-646 at coordinates (J2000) RA =
12![]() 13
13![]() 14
14
![]() 702, Dec = -64
702, Dec = -64![]() 52'30
52'30
![]() 89, with a position uncertainty of
89, with a position uncertainty of ![]() 4''.
Revnivtsev et al. (2007) also stated that this source may be an
intermediate polar (i.e. magnetic) cataclysmic variable (CV) on the basis
of its X-ray spectral appearance, in particular because of the presence
of a strong iron emission line at
4''.
Revnivtsev et al. (2007) also stated that this source may be an
intermediate polar (i.e. magnetic) cataclysmic variable (CV) on the basis
of its X-ray spectral appearance, in particular because of the presence
of a strong iron emission line at ![]() 6.7 keV.
6.7 keV.
To firmly identify the nature of this source, Masetti et al. (2009) included the single optical object consistent with the XRT position of 1ES 1210-646 in their spectroscopic follow-up of INTEGRAL sources: from its spectrum they concluded that it is more likely a HMXB rather than a CV. This was corroborated by the discovery of a periodicity of 6.7 d (Corbet & Mukai 2008) from the analysis of the long-term X-ray light curve of the source as seen by the All-Sky Monitor (ASM) onboard the RXTE satellite: if this modulation is interpreted as the orbital period of 1ES 1210-646, as Corbet & Mukai (2008) did, it would strengthen the HMXB nature for this source. These authors also reported that the 2.5-20 keV X-ray spectrum of the source acquired close to the orbital maximum is typical of a HMXB; they also confirmed the presence of the iron emission line.
Despite the number of multiwavelength information gathered in the past few
years on 1ES 1210-646, a deeper study of this source in X-rays is still
lacking. In order to fill this gap and better constrain and define the
observational X-ray properties of 1ES 1210-646, we collected and
analysed the three available Swift/XRT observations of this source,
along with the INTEGRAL/IBIS data from the 3![]() IBIS survey
(Bird et al. 2007) and the publicly available data collected with the
two-unit coded-mask X-ray monitor JEM-X (Lund et al. 2003), also
onboard INTEGRAL; we also performed a deeper analysis of the
archival BeppoSAX/WFC data.
IBIS survey
(Bird et al. 2007) and the publicly available data collected with the
two-unit coded-mask X-ray monitor JEM-X (Lund et al. 2003), also
onboard INTEGRAL; we also performed a deeper analysis of the
archival BeppoSAX/WFC data.
The paper is structured as follows. Section 2 will present the X-ray observations of 1ES 1210-646 considered in this work; in Sect. 3 the results of this multi-observatory X-ray campaign will be given, and in Sect. 4 a discussion on the source will be presented. Finally, in Sect. 5 we will outline the conclusions. Throughout the paper, if not indicated otherwise, uncertainties and limits are given at a 90% confidence level.
![\begin{figure}
\par\includegraphics[width=12cm,angle=-90]{13404f1.ps}\vspace*{-2.5mm}
\end{figure}](/articles/aa/full_html/2010/03/aa13404-09/img18.png)
|
Figure 1: Background-subtracted 2-10 keV X-ray light curves of 1ES 1210-646 as observed with XRT during observations #1 ( upper panel), #2 ( central panel) and #3 ( lower panel). All curves are rebinned at 300 s. Times are expressed in seconds from the start time of each observation (see Table 1 for details). Marked variability on timescales of the order of hundreds of seconds can be seen, especially during observation #1. |
| Open with DEXTER | |
2 Observations and data analysis
2.1 Swift: XRT data
The field of 1ES 1210-646 was observed three times with XRT. All pointings were performed in photon counting mode (see Burrows et al. 2005, for details on this observing mode). The log of these observations is reported in Table 1.
Table 1: Log of the Swift/XRT observations used in this paper.
The data reduction was performed using the XRTDAS v2.0.1 standard data
pipeline package (xrtpipeline v0.10.6) to produce the
final cleaned event files. As in observations #1 and #3 the XRT count
rate of the source was high enough
to produce data pile-up, we extracted the events in an annulus centred on
the source and with an external radius of 57'' and 68'', respectively.
The size of the inner circle was determined following the procedure described
in Romano et al. (2006) and was 9'' for observation 1 and 21'' for
observation 3. In observation #2 the pile-up was not an issue, so the
data were extracted from a circle of a radius of 47''.
The source background was measured within a circular region with a radius
of 95'' located far from the source. The ancillary response file was
generated with the task xrtmkarf (v0.5.2) within
FTOOLS![]() (Blackburn 1995), and
accounts for both extraction region and PSF pile-up correction. We used
the latest spectral redistribution matrices in the calibration
database
(Blackburn 1995), and
accounts for both extraction region and PSF pile-up correction. We used
the latest spectral redistribution matrices in the calibration
database![]() (CALDB 2.3) maintained by HEASARC.
(CALDB 2.3) maintained by HEASARC.
2.2 INTEGRAL: IBIS and JEM-X data
We extracted the spectral and time-series data of this source collected
with ISGRI (Lebrun et al. 2003), which is the low-energy coded-mask
detector of the IBIS instrument onboard INTEGRAL. The ISGRI data set
considered in this analysis consists of events in the 17-300 keV band
coming from both fully-coded and partially-coded observations of the field
of view of 1ES 1210-646. The time resolution for these data was that
typical of the IBIS science windows (ScWs; ![]() 2 ks). Details on the whole
procedure can be found in Bird et al. (2007). Hard X-ray long-term light
curves and a time-averaged spectrum were then obtained from the available
data and by the method described in Bird et al. (2006, 2007), for a
total of 1168 ks on-source collected in the time interval between
October 2002 and April 2006.
2 ks). Details on the whole
procedure can be found in Bird et al. (2007). Hard X-ray long-term light
curves and a time-averaged spectrum were then obtained from the available
data and by the method described in Bird et al. (2006, 2007), for a
total of 1168 ks on-source collected in the time interval between
October 2002 and April 2006.
Publicly-available 3-35 keV band JEM-X data of 1ES 1210-646 were also
collected. They were reduced and analysed as well with the OSA v7.0
software (for details about the JEM-X data analysis see Westergaard
et al. 2003). We searched the entire JEM-X public data archive (from
revolution 46 to 574) for pointings where 1ES 1210-646 was within the
JEM-X fully coded field of view (![]() 2
2
![]() 4 radius). As a result, a
total of 70 ScWs were selected, spanning the period from 28 May 2003 (Rev. 76) to 26 Jun. 2007 (Rev. 574).
4 radius). As a result, a
total of 70 ScWs were selected, spanning the period from 28 May 2003 (Rev. 76) to 26 Jun. 2007 (Rev. 574).
It was found specifically that 1ES 1210-646 entered the fully-coded field
of view of Unit 2 of JEM-X for 18 ks between 28 May 2003 and 3 Jun. 2003,
and for 116 ks in the one of Unit 1 between 20 Dec. 2004 and 26 Jun. 2007.
In the first case, the source was not detected,
whereas in the second instance it was in the 3-10 keV range; a more
in-depth inspection of the latter JEM-X data set revealed that the source
displayed two different states: a high flux state
from Rev. 322 (2 Jun. 2005) to Rev. 324 (8 Jun. 2005) for a total exposure
of ![]() 22 ks (26-
22 ks (26-![]() detection) and a low flux state, fainter by a
factor of
detection) and a low flux state, fainter by a
factor of ![]() 4,
in the remaining part of the data set, for a total exposure of
4,
in the remaining part of the data set, for a total exposure of ![]() 94
ks (8-
94
ks (8-![]() detection). The statistics were sufficient to extract a
meaningful JEM-X spectrum in the 3-10 keV band only during the high state
of the source. Information on the source fluxes as detected with JEM-X are
reported in Sect. 3.2.2.
detection). The statistics were sufficient to extract a
meaningful JEM-X spectrum in the 3-10 keV band only during the high state
of the source. Information on the source fluxes as detected with JEM-X are
reported in Sect. 3.2.2.
2.3 BeppoSAX: WFCs data
The two WFCs on board BeppoSAX were sensitive in the 2-28 keV range
and were mounted 180![]() apart and perpendicular
to the pointing direction of the satellite, thus looking at two different
sky zones during any pointing. In this way the WFCs secondary mode
observations covered almost all of the sky with at least one of their
serendipity pointings (typically with 100 ks duration) during the six
years of the BeppoSAX operational life.
apart and perpendicular
to the pointing direction of the satellite, thus looking at two different
sky zones during any pointing. In this way the WFCs secondary mode
observations covered almost all of the sky with at least one of their
serendipity pointings (typically with 100 ks duration) during the six
years of the BeppoSAX operational life.
We searched for 1ES 1210-64 detections in the archive![]() of all available BeppoSAX WFC pointings. The source has
been observed for a total of 1.5 Ms between April 1996 and April 2002,
although it was detected in single pointing observations only between
July 1996 and December 1997, in agreement with the highest source flux
detections of the RXTE/ASM
monitor
of all available BeppoSAX WFC pointings. The source has
been observed for a total of 1.5 Ms between April 1996 and April 2002,
although it was detected in single pointing observations only between
July 1996 and December 1997, in agreement with the highest source flux
detections of the RXTE/ASM
monitor![]() (see also Corbet &
Mukai 2008).
(see also Corbet &
Mukai 2008).
Unfortunately, the WFCs were not sensitive enough in terms of spectral capability, and 1ES 1210-646 was too faint in each single pointing and also in the sum of the observations to permit the extraction of meaningful spectra. Thus, only information on the source flux could be extracted from the WFC data (see Sect. 3.2.3 for the results).
3 Results
3.1 Light curves
Figure 1 reports the 2-10 keV light curves of 1ES 1210-646 acquired
during the three XRT pointings on this source. The data are
background-subtracted and rebinned at 300 s. Variability (up to a factor
of ![]() 3 in flux) of the order of hundreds of seconds can be noticed.
Apart form this, one can see that the average 2-10 keV source countrate
varies notably among the observations, going from
3 in flux) of the order of hundreds of seconds can be noticed.
Apart form this, one can see that the average 2-10 keV source countrate
varies notably among the observations, going from ![]() 0.15 cts s-1
of XRT pointing #2 to
0.15 cts s-1
of XRT pointing #2 to ![]() 1 cts s-1 in XRT pointing #3.
1 cts s-1 in XRT pointing #3.
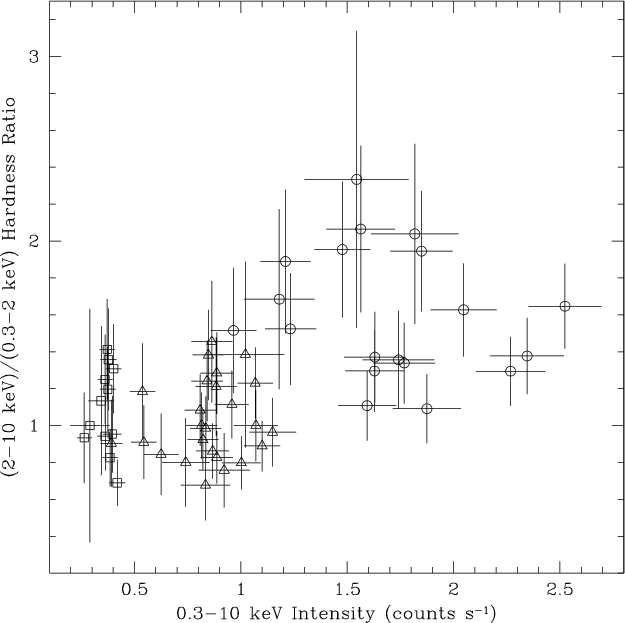
In order to see if these erratic behaviours implied spectral changes as a
function of the source intensity within each XRT observation, we
constructed an X-ray ``colour-intensity diagram'' (see Fig. 2) using the
total 0.3-10 keV intensity and the hardness ratio between the 2-10 keV
and the 0.3-2 keV count rates. In the figure, points from different
observations are indicated with different symbols. From the diagram, it
appears that the source gets slightly harder as its intensity rises,
although it seems that within the same XRT observation 1ES 1210-646
shows a fairly constant hardness ratio: ![]() 1 for XRT pointing #1 and
#2, and
1 for XRT pointing #1 and
#2, and ![]() 1.6 for XRT pointing #3.
1.6 for XRT pointing #3.
|
Figure 2:
X-ray colour-intensity diagram for 1ES 1210-646 constructed
using the three XRT observations of the source. Points are obtained from
the source X-ray light curves, subtracted of the background and rebinned
at 300 s. Triangles, squares and circles refer to XRT pointings #1, #2
and #3, respectively. Error bars show 1- |
| Open with DEXTER | |
Unfortunately, the wide gaps in the temporal coverage do not allow us to perform a meaningful timing analysis on any of the XRT pointings. For the same reason and because of sensitivity limits, no long-term periodicity analysis on the WFC, IBIS and JEM-X light curves of 1ES 1210-646 could reasonably be performed to confirm the modulation found by Corbet & Mukai (2008). We note however that the source variability appears to be stronger at lower energies (<20 keV), given that in the IBIS data it is continuously detected as a weak persistent object.
3.2 Spectra
In order to perform the spectral analysis on the X-ray data collected for
1ES 1210-646, the spectra from the detectors of all spacecraft but IBIS
were rebinned to oversample by a factor of 3 the full width at half
maximum of the energy resolution and to have a minimum of 20 counts per
bin to reliably use the ![]() statistics; for IBIS, the rebinning was
chosen to maximise the signal-to-noise ratio (S/N) for each bin.
Data were then selected for all detectors when a sufficient number of
counts were obtained in the energy ranges where the instrument responses
are well determined. For the
Swift/XRT observations, we considered the spectra averaged over each
pointing given that no substantial variations in the spectral shape
during each pointed observation were suggested by the inspection of the
colour-intensity diagram of the source (see Sect. 3.1).
For INTEGRAL the data were accumulated over the periods in which
each instrument could secure spectra with acceptable S/N, that is,
between 2 and 8 Jun. 2005 for JEM-X and the whole interval of the third
survey for IBIS.
Due to the tradeoff between spectral coverage and S/N, the spectral
analysis was performed over the 0.3-9 keV, 3-10 keV and 20-100 bands
for the XRT, JEM-X and IBIS data, respectively.
statistics; for IBIS, the rebinning was
chosen to maximise the signal-to-noise ratio (S/N) for each bin.
Data were then selected for all detectors when a sufficient number of
counts were obtained in the energy ranges where the instrument responses
are well determined. For the
Swift/XRT observations, we considered the spectra averaged over each
pointing given that no substantial variations in the spectral shape
during each pointed observation were suggested by the inspection of the
colour-intensity diagram of the source (see Sect. 3.1).
For INTEGRAL the data were accumulated over the periods in which
each instrument could secure spectra with acceptable S/N, that is,
between 2 and 8 Jun. 2005 for JEM-X and the whole interval of the third
survey for IBIS.
Due to the tradeoff between spectral coverage and S/N, the spectral
analysis was performed over the 0.3-9 keV, 3-10 keV and 20-100 bands
for the XRT, JEM-X and IBIS data, respectively.
To analyse the X-ray spectra we used the package XSPEC (Dorman & Arnaud 2001) v12.4.0ad. Several simple models like blackbody (BB), powerlaw, thermal bremsstrahlung, and hot diffuse gas emission ( MEKAL in XSPEC; Mewe et al. 1985), were tested for the description of the spectral data. Spectral fitting which used more complex models like a powerlaw modified with a cutoff did not improve the results over those obtained with the aforementioned simpler desciptions because of the relatively low S/N of the X-ray spectra presented here.
To all models tested in this paper (the best-fit models for each satellite pointing are reported in Table 2) we applied a photoelectric absorption column, modelled with the cross sections of Morrison & McCammon (1983; wabs in XSPEC notation) and with solar abundances as given by Anders & Grevesse (1989), to describe the line-of-sight Galactic neutral hydrogen absorption towards 1ES 1210-646. For clarity, the luminosities listed in Table 2 refer to only one of the reported models (see Note in Table 2); it can however be said that they are basically independent of the considered best-fit model. Below, the acronym ``d.o.f.'' means ``degrees of freedom''.
3.2.1 XRT data
The spectral analysis of the three XRT observations (see Table 2)
indicates that the models which best describe the data are those with the
powerlaw and the thermal bremsstrahlung, absorbed by a neutral hydrogen
column with density
![]() -
-
![]() atoms cm-2.
This value is comparable to the optical reddening along the line of sight
as derived by Schlegel et al. (1998), once the empirical formula of
Predehl & Schmitt (1995) is applied; this indicates that the measured
absorption is most likely of interstellar origin and none is locally present
in 1ES 1210-646. The same conclusion was reached by Masetti et al.
(2009) on the basis of the properties of the optical counterpart of this
source.
atoms cm-2.
This value is comparable to the optical reddening along the line of sight
as derived by Schlegel et al. (1998), once the empirical formula of
Predehl & Schmitt (1995) is applied; this indicates that the measured
absorption is most likely of interstellar origin and none is locally present
in 1ES 1210-646. The same conclusion was reached by Masetti et al.
(2009) on the basis of the properties of the optical counterpart of this
source.
Looking at Table 2 one also notes that with the powerlaw description
the spectrum is relatively hard at the lowest X-ray fluxes (XRT pointing
#2), gets softer at an intermediate flux level (XRT pointing #1) and
eventually turns harder when the source is brightest (XRT pointing #3);
similarly the temperature steadily rises in the case of bremsstrahlung fits
from ![]() 7.3 to
7.3 to ![]() 22 keV from XRT pointing #1 to XRT pointing #3.
22 keV from XRT pointing #1 to XRT pointing #3.
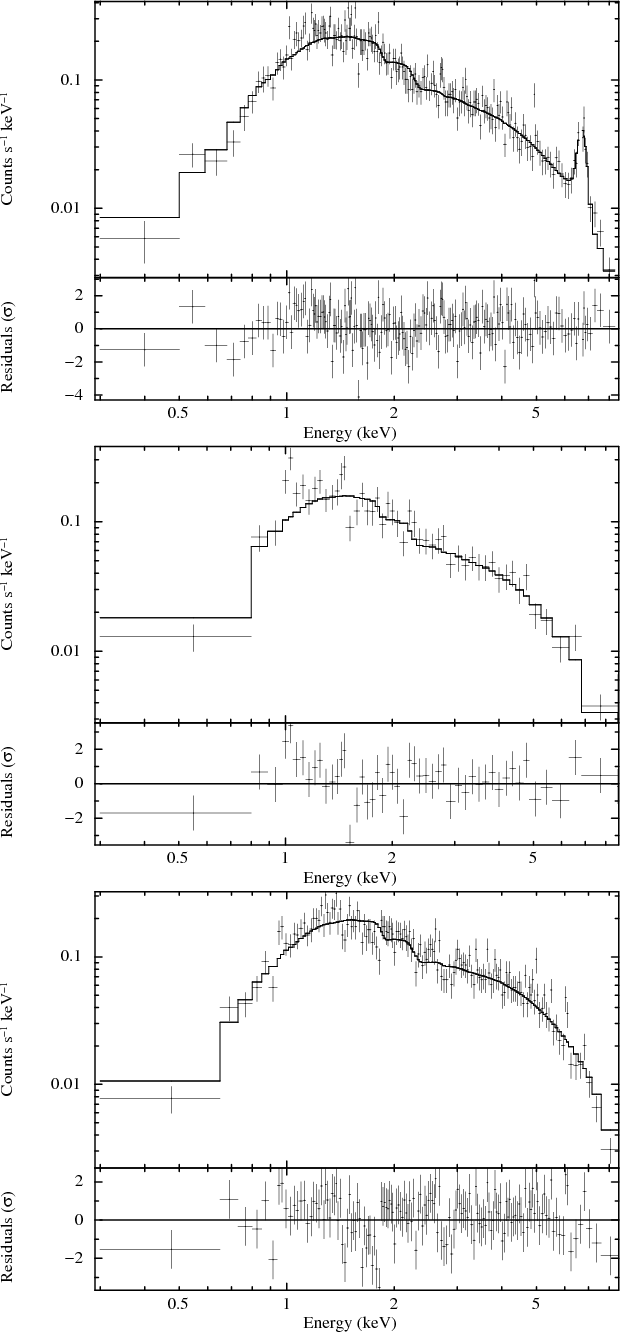
|
Figure 3: X-ray spectra of 1ES 1210-646 acquired during XRT observations #1 ( upper panel), #2 ( central panel) and #3 ( lower panel), together with one of the best-fit models (an absorbed powerlaw in all cases; see Table 2 for details) and the corresponding fit residuals. |
| Open with DEXTER | |
Table 2: Best-fit parameters for the X-ray spectra of 1ES 1210-646 from the observations described in this paper.
The most fascinating spectral feature is the presence of a strong and
variable iron emission line around 6.7 keV which is evidently
present only on XRT observation #1 (as already noted by Revnivtsev et al.
2007) at an intermediate source flux and which is not detected at low
and high flux levels (see Fig. 3). Assuming a Gaussian shape for the iron
emission, the probability of a chance improvement of the fit over a simple
powerlaw description in the spectrum of XRT pointing #1 is
![]() according to the F-test distribution
(Press et al. 1992). Although we are aware of the caveats and limitations
of the F-test application in astrophysical context (e.g., Protassov et al. 2002), the above value for the chance improvement probability
leaves little doubt that the detection of this emission line is quite
robust. However, no emission is present in the X-ray spectra extracted
from XRT observations #2 and #3 (see central and lower panels of Fig. 3).
according to the F-test distribution
(Press et al. 1992). Although we are aware of the caveats and limitations
of the F-test application in astrophysical context (e.g., Protassov et al. 2002), the above value for the chance improvement probability
leaves little doubt that the detection of this emission line is quite
robust. However, no emission is present in the X-ray spectra extracted
from XRT observations #2 and #3 (see central and lower panels of Fig. 3).
Table 2 also presents the best-fit parameters describing this emission
line. As one can see, they are largely independent of the model assumed
for the description of the X-ray spectral continuum. Table 3 reports
values or upper limits for the equivalent width (EW) of any iron emission
line at ![]() 6.7 keV in the spectrum of each pointed observation. As is
evident, the line EW has a variability of at least a factor of 8.
6.7 keV in the spectrum of each pointed observation. As is
evident, the line EW has a variability of at least a factor of 8.
For the sake of completeness, we report that the BB emission does not provide a satisfactory description of the spectral data; the MEKAL model is not a viable option either, as it implies a variation of the plasma metal abundances of a factor of 100 among the three XRT observations due to the presence of the highly variable iron line described above. Likewise, any combination of two simple models (e.g., BB plus powerlaw) does not produce significant improvements of the spectral fitting in any of the three XRT pointings.
3.2.2 JEM-X and IBIS data
Next, we consider the combined JEM-X and IBIS spectra between 3 and 100
keV (Fig. 4). We introduced a constant (
![]() )
to allow
for intercalibration differences between the two instruments; this
constant was left free to vary in the fits.
We are aware that since the IBIS spectrum is accumulated over a
much longer time span with respect to the JEM-X one (see Sect. 2.2),
the flux variations seen from 1ES 1210-646 in particular below 10 keV
may produce different normalisations for the spectra acquired by the two
instruments.
)
to allow
for intercalibration differences between the two instruments; this
constant was left free to vary in the fits.
We are aware that since the IBIS spectrum is accumulated over a
much longer time span with respect to the JEM-X one (see Sect. 2.2),
the flux variations seen from 1ES 1210-646 in particular below 10 keV
may produce different normalisations for the spectra acquired by the two
instruments.
Given that our past experience tells us that the intercalibration
constant between these two instruments is ![]() 1, we suggest that
different values for this constant are likely to be due to the flux
variability mentioned above. In any case, given that 1ES 1210-646 is
more likely to be detected by IBIS during its high state, we consider that
the JEM-X and IBIS spectra are representative of the same (high-intensity)
state for the source and that it is therefore meaningful to combine them.
1, we suggest that
different values for this constant are likely to be due to the flux
variability mentioned above. In any case, given that 1ES 1210-646 is
more likely to be detected by IBIS during its high state, we consider that
the JEM-X and IBIS spectra are representative of the same (high-intensity)
state for the source and that it is therefore meaningful to combine them.
In the fits we fixed the neutral hydrogen column density to
![]() atoms m-2, given that the lack of spectral
coverage below 3 keV (that is, the spectral range which is most
sensitive to the
atoms m-2, given that the lack of spectral
coverage below 3 keV (that is, the spectral range which is most
sensitive to the ![]() absorption effects) does not allow us to
determine this parameter through the spectral fits.
absorption effects) does not allow us to
determine this parameter through the spectral fits.
![\begin{figure}
\par\includegraphics[width=9cm,clip]{13404f4.eps}
\end{figure}](/articles/aa/full_html/2010/03/aa13404-09/img63.png)
|
Figure 4: Combined averaged JEM-X+IBIS X-ray spectrum of 1ES 1210-646, plotted together with one of the best-fit models (absorbed BB plus powerlaw; see Table 2 for details) and the corresponding fit residuals. |
| Open with DEXTER | |
Table 3: Values and upper limits to the EW of the iron emission line in 1ES 1210-646.
The first remarkable issue of the JEM-X+IBIS spectral analysis
is that no simple spectral model is able to fit the whole spectrum
simultaneously, as none of them produces fits with reduced ![]() 2.
We thus tried combinations of two models; the best descriptions are
obtained with BB+powerlaw and bremsstrahlung+powerlaw models (see Table 2).
2.
We thus tried combinations of two models; the best descriptions are
obtained with BB+powerlaw and bremsstrahlung+powerlaw models (see Table 2).
Moreover, no iron emission line is apparent in the combined spectrum, with an upper limit on the EW as reported in Table 3. This is actually not surprising, given that the source emission level during which the considered JEM-X spectrum was accumulated was similar to the one of XRT observation #3, in which no iron emission line was detected either.
Concerning instead the JEM-X observations for which no spectral
information could be obtained, we found that Unit 1 of JEM-X detected the
source at a flux of 4.7![]() 10-11 erg cm-2 s-1
in the 3-10 keV band, while Unit 2 could only provide a loose upper limit
of 5.6
10-11 erg cm-2 s-1
in the 3-10 keV band, while Unit 2 could only provide a loose upper limit
of 5.6![]() 10-11 erg cm-2 s-1 to the source flux, again
in the 3-10 keV band.
10-11 erg cm-2 s-1 to the source flux, again
in the 3-10 keV band.
3.2.3 WFC data
As reported Sect. 2.3, no spectrum of 1ES 1210-646 could be extracted
from the WFC data. The source was clearly detected however, as
Fig. 5 shows, in the mosaic maps of the summed WFCs data (for
details on the mosaic production see Capitanio et al. 2008). The source is
present in both the 3-17 keV and the 17-28 keV mosaics maps at 50 and 20
![]() confidence levels, respectively. 1ES 1210-646 is detected by
the WFC at a flux of
confidence levels, respectively. 1ES 1210-646 is detected by
the WFC at a flux of ![]() 2 mCrab in the 3-28 keV band, corresponding to
2 mCrab in the 3-28 keV band, corresponding to
![]()
![]() erg cm-2 s-1; this value is
compatible with the low-state JEM-X and the XRT pointing #1 detections.
Outside the period in which it was detected, following Verrecchia et al.
(2007) we can assume a 3-28 keV detection limit of <
erg cm-2 s-1; this value is
compatible with the low-state JEM-X and the XRT pointing #1 detections.
Outside the period in which it was detected, following Verrecchia et al.
(2007) we can assume a 3-28 keV detection limit of <
![]() erg cm-2 s-1 for 1ES 1210-646.
erg cm-2 s-1 for 1ES 1210-646.
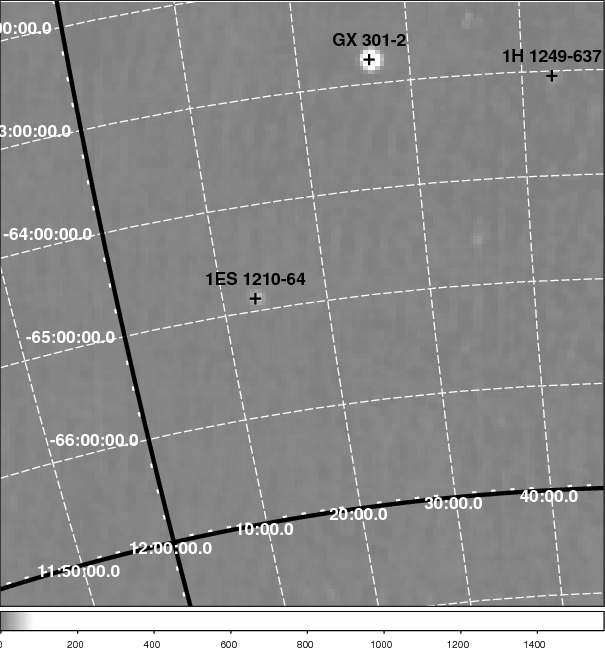
|
Figure 5: WFCs mosaic image in the 3-17 keV band of the 1ES 1210-646 sky region. |
| Open with DEXTER | |
4 Discussion
We here performed and presented, to the best of our knowledge, the first detailed spectral analysis of the X-ray emission from the X-ray binary 1ES 1210-646. We found that the source shows marked variability (of a factor of at least 10) on several timescales, from hundreds of seconds to months. Moreover, a strong transient iron emission line at 6.7 keV is detected at intermediate X-ray fluxes only, and disappears when 1ES 1210-646 is at low and high intensity levels. Below we will discuss the characteristics of this X-ray system, the nature of its accretor, and the origin of its large and variable iron emission line in the light of the results shown in this paper.
4.1 1ES 1210-646: a peculiar HMXB
Our results indicate that the 0.3-9 keV X-ray spectrum of 1ES 1210-646
is described with a simple powerlaw, or a bremsstrahlung, while the INTEGRAL broadband data (3-100 keV) are best fit with a combination of
BB plus powerlaw or bremsstrahlung plus powerlaw (see Table 2). Because of
the relatively low S/N of the data we prefer the powerlaw (and the
BB+powerlaw) description because i) the latter generally shows lower
reduced ![]() values and ii) the JEM-X/IBIS intercalibration constant
for the bremsstrahlung+powerlaw model is quite small (
values and ii) the JEM-X/IBIS intercalibration constant
for the bremsstrahlung+powerlaw model is quite small (![]() 0.1).
0.1).
All the considered spectral models appear to be absorbed by the neutral interstellar hydrogen along the source line of sight only, indicating that the accreting material is likely not dense and/or neutral enough to contribute to the measured absorption acting on the X-ray emitted by the source.
As recalled in Sect. 1, Revnivtsev et al. (2007) put forward the
identification of this X-ray source as a CV due to the presence of a
large iron emission line at 6.7 keV in the X-ray spectrum. However, as
already remarked in Masetti et al. (2009), a number of HMXBs also show
iron emission lines at this energy. Besides, the very large EW of the line
(![]() 1.6 keV, possibly due to the blend of iron lines, combined with the
relatively low XRT spectral resolution) and its strong variability
disfavour the CV interpretation for 1ES 1210-646 (for a comparison, see
Landi et al. 2009, for a study of a sample of hard X-ray emitting CVs
using XRT and IBIS). Also the high-state X-ray luminosity of 1ES
1210-646 is
1.6 keV, possibly due to the blend of iron lines, combined with the
relatively low XRT spectral resolution) and its strong variability
disfavour the CV interpretation for 1ES 1210-646 (for a comparison, see
Landi et al. 2009, for a study of a sample of hard X-ray emitting CVs
using XRT and IBIS). Also the high-state X-ray luminosity of 1ES
1210-646 is ![]() 1-2 orders of magnitude larger than those typical of
X-ray emitting CVs (see e.g. Barlow et al. 2006; Revnivtsev et al. 2008;
Brunschweiger et al. 2009). Therefore we confidently rule out a CV
interpretation for this system.
1-2 orders of magnitude larger than those typical of
X-ray emitting CVs (see e.g. Barlow et al. 2006; Revnivtsev et al. 2008;
Brunschweiger et al. 2009). Therefore we confidently rule out a CV
interpretation for this system.
The possibility (see Masetti et al. 2009) that 1ES 1210-646 might be
similar to the peculiar transient X-ray binary CI Cam (=XTE J0421+560),
thought to host a white dwarf (e.g., Orlandini et al. 2000) can be ruled
out as well: the X-ray variability of the latter source and its optical
spectrum (see Orlandini et al. 2000, and references therein) are indeed
markedly different with respect to those of 1ES 1210-646. Moreover, the
presence of a BB emission with a temperature of ![]() 1.5 keV in the
X-ray spectrum of 1ES 1210-646 when the source shows high flux levels
suggests that the accretor is more compact than a white dwarf.
1.5 keV in the
X-ray spectrum of 1ES 1210-646 when the source shows high flux levels
suggests that the accretor is more compact than a white dwarf.
We are also inclined to rule out a LMXB nature because these systems have quite different optical (and, to a lesser extent, X-ray) spectra with respect to that of 1ES 1210-646. The huge variability of the iron emission line found in 1ES 1210-646 is never seen, as far as we know, in persistent LMXBs.
Besides, the length of the orbital period also disfavours the LMXB interpretation. While searching in the LMXB catalogues of Liu et al. (2007) and Ritter & Kolb (2003), we found that very few systems have orbital periods of the order of days; and those that do actually show very different emission properties with respect to 1ES 1210-646. For instance, V395 Car (=2S 0921-630) with a period of 9.0 d (Branduardi-Raymont et al. 1983) has optical (e.g., Shahbaz et al. 1999) and X-ray (e.g., Kallman et al. 2003) spectra quite at variance with those of 1ES 1210-646. The same holds for Cyg X-2 (see Elebert et al. 2009; Di Salvo et al. 2002, and references therein), which has a period of 9.8 d (Casares et al. 1998). Likewise, LMXBs V404 Cyg (=GS 2023+338), with an orbital period of 6.4 d (Casares et al. 1992), is completely different from 1ES 1210-646 in the sense that the latter is a persistent although variable source, while the former is one of the best-known X-ray transient LMXBs hosting a dynamically-confirmed BH (cf. Kitamoto et al. 1989; Casares & Charles 1994).
The binary 1ES 1210-646 might actually be more similar to the fast HMXB transient SAX J1819.3-2525, at least in terms of optical spectroscopic characteristics (Orosz et al. 2001; Maitra & Bailyn 2006); however this system also displays a transient X-ray behaviour which is not seen in 1ES 1210-646 and moreover it too hosts a dinamically-confirmed BH (Orosz et al. 2001). Possibly 1ES 1210-646 will eventually evolve into a LMXB as Cyg X-2, as suggested for the HMXB Cir X-1 by Tauris & Savonije (1999) and by Podsiadlowski et al. (2002).
All things considered, the HMXB interpretation for 1ES 1210-646 is the one best suited to explain the multiwavelength properties of this source. Nevertheless, the optical and X-ray spectra of 1ES 1210-646 are also anomalous for a persistent (albeit variable) HMXB. Indeed, the X-ray spectrum is atypical for an HMXB in the sense that we do not detect any break in its powerlaw shape below 10 keV and below 100 keV in the XRT and IBIS spectra, respectively, whereas HMXBs generally show spectral breaks in the 5-20 keV range (e.g., White et al. 1983). Actually, Corbet & Mukai (2008) found a break around 6 keV in the source X-ray spectrum: if our different description can be explained for XRT data as due to their narrower spectral coverage with respect to that of Corbet & Mukai (2008), the INTEGRAL spectrum is possibly representative of a spectral state which is different from that reported by the above authors.
4.2 The nature of the accretor
The analysis presented here also indicates that a BB emission appears in the X-ray spectrum of 1ES 1210-646 when the source is at its high state. This latter fact is however not surprising because according to Hickox et al. (2004) soft excesses are quite ubiquitous in HMXB spectra. The BB component detected in the X-ray spectrum of 1ES 1210-646 is consistent with an emission from an accreting NS surface, both in terms of the emitting area and temperature. This agrees with the conclusions of Hickox et al. (2004), according to which a soft excess in HMXBs with X-ray luminosities of less than 1036 erg s-1 can be produced by thermal emission from the surface of the accreting NS (as in the case of the low-luminosity HMXB X Per; Coburn et al. 2001). That we see this BB component only at the highest emission levels for this source is likely a selection effect in the sense that it is more apparent when the NS accretion rate is highest, whereas during lower flux levels the non-thermal (i.e., powerlaw) component dominates.
Moreover, as we detect a BB component with an emitting area comparable to the surface of a NS (or at least a large fraction of it; see Table 2) in 1ES 1210-646, the accreting object is probably an NS with a relatively low magnetic field; in this case, no accretion column would form, and the detection of pulsed X-ray emission would be rather difficult. Consequently the accretor in 1ES 1210-646 would be an analogue of the one in the HMXB Cir X-1 (see Jonker et al. 2007, and references therein), which is believed to be a low magnetic field NS.
It is also worth pointing out that this source is interesting from a
further point of view, as it seems to be one of the very rare
Be/X-ray binaries in the Galaxy with spectral type beyond B2 (Negueruela
1998). Actually, according to the Corbet diagram (Corbet 1986), a 6.7 day
orbital period is quite short for a Be/X-ray binary and would be better
suited to a supergiant system (which is ruled out by Masetti et al. 2009),
unless the hosted NS is rapidly spinning (
![]() s).
Otherwise, the NS could be rotating substantially slower, with
s).
Otherwise, the NS could be rotating substantially slower, with
![]() s, and accretes from the stellar wind of the companion
star.
s, and accretes from the stellar wind of the companion
star.
4.3 Origin of the iron emission line
The possible origin of the 6.7 keV emission line generally observed
in the X-ray binaries is the K![]() transition of highly ionised
He-like iron. This can be produced either in a thin hot plasma region with
an electron temperature of several keV (as usually observed in
disc-accreting X-ray binaries; cf. White et al. 1995), or by radiative
recombination followed by electron cascade transition in a photoionised
plasma with a relatively low temperature (see Liedahl & Paerels 1996, and
references therein).
transition of highly ionised
He-like iron. This can be produced either in a thin hot plasma region with
an electron temperature of several keV (as usually observed in
disc-accreting X-ray binaries; cf. White et al. 1995), or by radiative
recombination followed by electron cascade transition in a photoionised
plasma with a relatively low temperature (see Liedahl & Paerels 1996, and
references therein).
The latter mechanism is at work in HMXBs like SMC X-1 (Vrtilek et al. 2001), Vela X-1 (Goldstein et al. 2004) and 4U 1700-37 (van der Meer et al. 2005): it makes the emission lines more easily detectable during eclipses, when the X-ray beam irradiating the stellar wind is not directly visible but the reprocessed emission from the photoionised stellar wind is. However, this effect does not explain the iron line variability that we detect in 1ES 1210-646, as in this case the line is apparent far from the possible eclipses of the system (see below), assuming the ephemeris of Corbet & Mukai (2008).
The X-ray binary Cyg X-3 also shows an iron emission line at 6.7 keV, likely emitted from the accreted stellar wind surrounding the accretor and strongly photoionised by its high-energy radiation (see e.g. Szostek et al. 2008, and references therein); but in this object the intensity of the 6.7 keV iron line as a function of the source flux (Hjalmarsdotter et al. 2009) reaches its lowest levels when Cyg X-3 is at intermediate flux levels, thus at variance with respect to the behaviour shown by 1ES 1210-646.
This accordingly suggests that the iron emission detected in this latter source is produced in a highly ionised, hot and thin accretion stream rather than by a relatively cold photoionised plasma.
In addition, the line variability behaviour of 1ES 1210-646 is
reminiscent of that displayed by GX 301-2, an HMXB showing an iron
emission at 6.4 keV with EW varying by a factor of ![]() 6 depending on
the orbital phase of the NS (Nagase 1989; Endo et al. 2002). In
particular, in this source the iron emission line is stronger when the
accreting NS is close to the periastron (Endo et al. 2002). Can this
effect be present in 1ES 1210-646 as well? Indeed, according to the
orbital ephemeris of Corbet & Mukai (2008), we find that XRT observation
#1 falls at orbital phase
6 depending on
the orbital phase of the NS (Nagase 1989; Endo et al. 2002). In
particular, in this source the iron emission line is stronger when the
accreting NS is close to the periastron (Endo et al. 2002). Can this
effect be present in 1ES 1210-646 as well? Indeed, according to the
orbital ephemeris of Corbet & Mukai (2008), we find that XRT observation
#1 falls at orbital phase ![]() 0 (when the orbital modulation
of the source flux reaches its maximum, that is, at or near the periastron),
while the other XRT pointings and our JEM-X spectrum were acquired at
orbital phases of
0 (when the orbital modulation
of the source flux reaches its maximum, that is, at or near the periastron),
while the other XRT pointings and our JEM-X spectrum were acquired at
orbital phases of ![]() 0.3,
0.3, ![]() 0.8 and
0.8 and ![]() 0.3, respectively.
Likewise, Corbet & Mukai (2008) also find an iron emission in an X-ray
spectrum acquired near an orbital phase of 0.
0.3, respectively.
Likewise, Corbet & Mukai (2008) also find an iron emission in an X-ray
spectrum acquired near an orbital phase of 0.
We note however that the line energy in GX 301-2 indicates that the emission in this source is due to fluorescence of neutral iron irradiated by the accreting NS, whereas (as already remarked) in 1ES 1210-646 the line at 6.7 keV comes from a highly ionised medium. Nevertheless, the line intensity behaviour in these two sources as a function of the orbital phase is apparently very similar.
Therefore, the presence of a variable emission line in 1ES 1210-646 as a function of its orbital period with a detectable intensity as the accretor approaches periastron suggests that this feature is tied to the increase of the accretion rate from the secondary star (likely from its wind) onto the NS due to its orbital motion. The line thus possibly forms in a small, transient and highly ionised accretion figure around the NS itself.
5 Conclusions
From our X-ray data analysis carried out with several instruments
on board of different spacecraft, we conclude that the best interpretation
for the nature of the X-ray source 1ES 1210-646 is that it is an HMXB
hosting a low magnetic field NS, although it is a system with several
peculiarities like its optical and X-ray spectra and the large
variability of the iron emission line at ![]() 6.7 keV.
This variable line is apparently produced in a highly ionised and
transient accretion figure around the accreting NS during the periastron
passage. In order to further explore the peculiar nature of
1ES 1210-646 and its behaviour as a function of the orbital phase,
higher S/N optical and X-ray spectra of the source along with
multiwavelength monitoring and a deeper timing analysis to search for
short-term modulations (from milliseconds to hours), are definitely
needed.
6.7 keV.
This variable line is apparently produced in a highly ionised and
transient accretion figure around the accreting NS during the periastron
passage. In order to further explore the peculiar nature of
1ES 1210-646 and its behaviour as a function of the orbital phase,
higher S/N optical and X-ray spectra of the source along with
multiwavelength monitoring and a deeper timing analysis to search for
short-term modulations (from milliseconds to hours), are definitely
needed.
We thank Domitilla de Martino and Margaretha Pretorius for preliminar comments and discussions on the nature of this source, Mauro Orlandini for discussions on HMXB systems and X-ray data analysis, and Vanessa McBride for comments and suggestions. We also thank the anonymous referee for useful remarks which helped us to improve the paper. This research has made use of the ASI Science Data Center Multimission Archive, of the WFC archive at INAF/IASF di Roma, of the SIMBAD database operated at CDS, Strasbourg, France, and of the NASA Astrophysics Data System Abstract Service. Some of the authors acknowledge the ASI and INAF financial support via grant No. I/008/07.
References
- Anders, E., & Grevesse, N. 1989, Geochim. Cosmochim. Acta, 53, 197 [Google Scholar]
- Barlow, E. J., Knigge, C., Bird, A. J., et al. 2006, MNRAS, 372, 224 [NASA ADS] [CrossRef] [Google Scholar]
- Bird, A. J., Barlow, E. J., Bassani, L., et al. 2006, ApJ, 636, 765 [NASA ADS] [CrossRef] [EDP Sciences] [Google Scholar]
- Bird, A. J., Malizia, A., Bazzano, A., et al. 2007, ApJS, 170, 175 [NASA ADS] [CrossRef] [Google Scholar]
- Boella, G., Butler R. C., Perola, C., et al. 1997, A&AS, 122, 299 [NASA ADS] [CrossRef] [EDP Sciences] [Google Scholar]
- Blackburn, J. K. 1995, FTOOLS: A FITS Data Processing and Analysis Software Package, in Astronomical Data Analysis Software and Systems IV, ed. R. A. Shaw, H. E. Payne, & J. J. E. Hayes, ASP Conf. Ser., 77, 367 [Google Scholar]
- Branduardi-Raymont, G., Corbet, R. H. D., Mason, K. O., et al. 1983, MNRAS, 205, 403 [NASA ADS] [CrossRef] [Google Scholar]
- Brunschweiger, J., Greiner, J., Ajello, M., & Osborne, J. 2009, A&A, 496, 121 [NASA ADS] [CrossRef] [EDP Sciences] [Google Scholar]
- Burrows, D. N., Hill, J. E., Nousek, J. A., et al. 2005, Space Sci. Rev., 120, 165 [NASA ADS] [CrossRef] [Google Scholar]
- Capitanio, F., Bird, A. J., Federici, M., Bazzano, A., & Ubertini, P. 2008, Correlating the WFC and the IBIS hard X-ray surveys, in A Population Explosion: The Nature & Evolution of X-ray Binaries in Diverse Environments, ed. R. M. Bandyopadhyay, S. Wachter, D. Gelino, & C. R. Gelino, AIP Conf. Proc., 1010, 257 [Google Scholar]
- Casares, J., & Charles, P. A. 1994, MNRAS, 271, L5 [NASA ADS] [CrossRef] [Google Scholar]
- Casares, J., Charles, P. A., & Naylor, T. 1992, Nature, 355, 614 [NASA ADS] [CrossRef] [Google Scholar]
- Casares, J., Charles, P. A., & Kuulkers, E. 1998, ApJ, 493, L39 [NASA ADS] [CrossRef] [Google Scholar]
- Coburn, W., Heindl, W. A., Gruber, D. E., et al. 2001, ApJ, 552, 738 [NASA ADS] [CrossRef] [Google Scholar]
- Corbet, R. H. D. 1986, MNRAS, 220, 1047 [NASA ADS] [CrossRef] [Google Scholar]
- Corbet, R. H. D., & Mukai, K. 2008, ATel, 1861 [Google Scholar]
- Cusumano, G., La Parola, V., Segreto, A., et al. 2009, A&A, 510, A48 [Google Scholar]
- Di Salvo, T., Farinelli, R., Burderi, L., et al. 2002, A&A, 386, 535 [NASA ADS] [CrossRef] [EDP Sciences] [Google Scholar]
- Dorman, B., & Arnaud, K. A. 2001, Redesign and reimplementation of XSPEC, in Astronomical Data Analysis Software and Systems X, ed. F. R. Harnden Jr., F. A. Primini, & H. E. Payne (San Francisco: ASP), ASP Conf. Ser., 238, 415 [Google Scholar]
- Elebert, P., Callanan, P. J., Torres, M. A. P., & Garcia, M. R. 2009, MNRAS, 395, 2029 [NASA ADS] [CrossRef] [Google Scholar]
- Elvis, M., Plummer, D., Schachter, J., & Fabbiano, G. 1992, ApJS, 80, 257 [NASA ADS] [CrossRef] [Google Scholar]
- Endo, T., Ishida, M., Kuniaki, M., et al. 2002, ApJ, 574, 879 [NASA ADS] [CrossRef] [Google Scholar]
- Forman, W., Jones, C., Cominsky, L., et al. 1978, ApJS, 38, 357 [NASA ADS] [CrossRef] [Google Scholar]
- Gehrels, N., Chincarini, G., Giommi, P., et al. 2004, ApJ, 611, 1005 [NASA ADS] [CrossRef] [Google Scholar]
- Goldstein, G., Huenemoerder, D. P., & Blank, D. 2004, AJ, 127, 2310 [NASA ADS] [CrossRef] [Google Scholar]
- Hickox, R. C., Narayan, R., & Kallman, T. R. 2004, ApJ, 614, 881 [NASA ADS] [CrossRef] [Google Scholar]
- Hjalsmarsdotter, L., Zdziarski, A. A., Szostek, A., & Hannikainen, D. 2009, MNRAS, 392, 251 [NASA ADS] [CrossRef] [Google Scholar]
- Jager, R., Mels, W. A., Brinkman, A. C., et al. 1997, A&AS, 125, 557 [Google Scholar]
- Jonker, P. G., Nelemans, G., & Bassa, C. G. 2007, MNRAS, 374, 999 [NASA ADS] [CrossRef] [Google Scholar]
- Kallman, T. R., Angelini, L., Boroson, B., & Cottam, J. 2003, ApJ, 583, 861 [NASA ADS] [CrossRef] [Google Scholar]
- Kitamoto, S., Tsunemi, H., Miyamoto, S., et al. 1989, Nature, 342, 518 [NASA ADS] [CrossRef] [Google Scholar]
- Krivonos, R., Revnivtsev, M., Lutovinov, A., et al. 2007, A&A, 475, 775 [NASA ADS] [CrossRef] [EDP Sciences] [Google Scholar]
- Landi, R., Bassani, L., Dean, A. J., et al. 2009, MNRAS, 392, 630 [Google Scholar]
- Lebrun, F., Leray, J. P., Lavocat, P., et al. 2003, A&A, 411, L141 [NASA ADS] [CrossRef] [EDP Sciences] [Google Scholar]
- Liedahl, D. A., & Paerels, F. 1996, ApJ, 468, L33 [NASA ADS] [CrossRef] [Google Scholar]
- Liu, Q. Z., van Paradijs, J., & van den Heuvel, E. P. J. 2007, A&A, 469, 807 [NASA ADS] [CrossRef] [EDP Sciences] [Google Scholar]
- Lund, N., Budtz-Jørgensen, C., Westergaard, N. J., et al. 2003, A&A, 411, L231 [NASA ADS] [CrossRef] [EDP Sciences] [Google Scholar]
- Maitra, D., & Bailyn, C. D. 2006, ApJ, 637, 992 [NASA ADS] [CrossRef] [Google Scholar]
- Masetti, N., Parisi, P., Palazzi, E., et al. 2009, A&A, 495, 121 [NASA ADS] [CrossRef] [EDP Sciences] [Google Scholar]
- Mewe, R., Groenschild, E. H. B. M., & van den Oord, G. H. J. 1985, A&AS, 62, 197 [Google Scholar]
- Morrison, R., & McCammon, D. 1983, ApJ, 270, 119 [NASA ADS] [CrossRef] [Google Scholar]
- Nagase, F. 1989, PASJ, 41, 1 [NASA ADS] [Google Scholar]
- Negueruela, I. 1998, A&A, 338, 505 [NASA ADS] [Google Scholar]
- Orlandini, M., Parmar, A. N., Frontera, F., et al. 2000, A&A, 356, 163 [NASA ADS] [Google Scholar]
- Orosz, J. A., Kuulkers, E., van der Klis, M., et al. 2001, ApJ, 555, 489 [NASA ADS] [CrossRef] [Google Scholar]
- Podsiadlowski, P., Rappaport, S., & Pfahl E. D. 2002, ApJ, 565, 1107 [NASA ADS] [CrossRef] [Google Scholar]
- Predehl, P., & Schmitt, J. H. M. M. 1995, A&A, 293, 889 [NASA ADS] [Google Scholar]
- Press, W. H., Teukolsky, S. A., Vetterling, W. T., & Flannery, B. P. 1992, Numerical Recipes (Cambridge: Cambridge Univ. Press) [Google Scholar]
- Protassov, R., Van Dyk, D. A., Connors, A., Kashyap, V. L., & Siemiginowska, A. 2002, ApJ, 571, 545 [NASA ADS] [CrossRef] [Google Scholar]
- Revnivtsev, M., Sunyaev, R., Lutovinov, A., & Sazonov, S. 2007, ATel, 1253 [Google Scholar]
- Revnivtsev, M., Sazonov, S., Krivonos, R., Ritter, H., & Sunyaev, R. 2008, A&A, 489, 1121 [NASA ADS] [CrossRef] [EDP Sciences] [Google Scholar]
- Reynolds, A. P., Parmar, A. N., Hakala, P. J., et al. 1999, A&AS, 134, 287 [Google Scholar]
- Ritter, H., & Kolb, U. 2003, A&A, 404, 301 [NASA ADS] [CrossRef] [EDP Sciences] [Google Scholar]
- Romano, P., Campana, S., Chincarini, G., et al. 2006, A&A, 456, 917 [NASA ADS] [CrossRef] [EDP Sciences] [Google Scholar]
- Schlegel, D. J., Finkbeiner, D. P., & Davis, M. 1998, ApJ, 500, 525 [NASA ADS] [CrossRef] [Google Scholar]
- Shahbaz, T., Kuulkers, E., Charles, P. A., et al. 1999, A&A, 344, 101 [NASA ADS] [Google Scholar]
- Szostek, A., Zdziarski, A. A., & McCollough, M. L. 2008, MNRAS, 388, 1001 [NASA ADS] [Google Scholar]
- Tauris T. M., & Savonije, G. J. 1999, A&A, 350, 928 [NASA ADS] [Google Scholar]
- Tueller, J., Baumgartner, W. H., Markwardt, C. B., et al. 2010, ApJS, 186, 378 [NASA ADS] [CrossRef] [Google Scholar]
- Ubertini, P., Lebrun, F., Di Cocco, G., et al. 2003, A&A, 411, L131 [NASA ADS] [CrossRef] [EDP Sciences] [Google Scholar]
- van der Meer, A., Kaper, L., Di Salvo, T., et al. 2005, A&A, 432, 999 [NASA ADS] [CrossRef] [EDP Sciences] [Google Scholar]
- Verrecchia, F., in 't Zand, J. J. M., Giommi, P., et al. 2007, A&A, 472, 705 [NASA ADS] [CrossRef] [EDP Sciences] [Google Scholar]
- Vrtilek, S. D., Raymond, J. C., Boroson, B., et al. 2001, ApJ, 563, L139 [NASA ADS] [CrossRef] [Google Scholar]
- Westergaard, N. J., Kretschmar, P., Oxborrow, C. A., et al. 2003, A&A, 411, L257 [NASA ADS] [CrossRef] [EDP Sciences] [Google Scholar]
- White, N. E., Swank, J. H., & Holt, S. S. 1983, ApJ, 270, 711 [NASA ADS] [CrossRef] [Google Scholar]
- White, N. E., Nagase, F., & Parmar, A. N. 1995, The properties of X-ray binaries, in X-ray binaries, ed. W. H. G. Lewin, J. van Paradijs, & E. P. J. van den Heuvel (Cambridge: Cambridge Univ. Press), 1 [Google Scholar]
- Winkler, C., Courvoisier, T. J.-L., Di Cocco, G., et al. 2003, A&A, 411, L1 [NASA ADS] [CrossRef] [EDP Sciences] [Google Scholar]
Footnotes
- ... 1210-646
- Partly based on X-ray observations with INTEGRAL, an ESA project with instruments and science data centre funded by ESA member states (especially the PI countries: Denmark, France, Germany, Italy, Switzerland, Spain), Czech Republic and Poland, and with the participation of Russia and the USA.
- ...
FTOOLS
- Available at: http://heasarc.gsfc.nasa.gov/ftools/
- ...
database
- Available at: http://heasarc.gsfc.nasa.gov/docs/heasarc/caldb/caldb_intro.html
- ... archive
- The WFCs data archive collected by the INAF-IASF of Rome (Italy) has been used for this analysis
- ...
monitor
- http://xte.mit.edu/ASM_lc.html
All Tables
Table 1: Log of the Swift/XRT observations used in this paper.
Table 2: Best-fit parameters for the X-ray spectra of 1ES 1210-646 from the observations described in this paper.
Table 3: Values and upper limits to the EW of the iron emission line in 1ES 1210-646.
All Figures
|
|
Figure 1: Background-subtracted 2-10 keV X-ray light curves of 1ES 1210-646 as observed with XRT during observations #1 ( upper panel), #2 ( central panel) and #3 ( lower panel). All curves are rebinned at 300 s. Times are expressed in seconds from the start time of each observation (see Table 1 for details). Marked variability on timescales of the order of hundreds of seconds can be seen, especially during observation #1. |
| Open with DEXTER | |
| In the text | |
|
|
Figure 2:
X-ray colour-intensity diagram for 1ES 1210-646 constructed
using the three XRT observations of the source. Points are obtained from
the source X-ray light curves, subtracted of the background and rebinned
at 300 s. Triangles, squares and circles refer to XRT pointings #1, #2
and #3, respectively. Error bars show 1- |
| Open with DEXTER | |
| In the text | |
|
|
Figure 3: X-ray spectra of 1ES 1210-646 acquired during XRT observations #1 ( upper panel), #2 ( central panel) and #3 ( lower panel), together with one of the best-fit models (an absorbed powerlaw in all cases; see Table 2 for details) and the corresponding fit residuals. |
| Open with DEXTER | |
| In the text | |
|
|
Figure 4: Combined averaged JEM-X+IBIS X-ray spectrum of 1ES 1210-646, plotted together with one of the best-fit models (absorbed BB plus powerlaw; see Table 2 for details) and the corresponding fit residuals. |
| Open with DEXTER | |
| In the text | |
|
|
Figure 5: WFCs mosaic image in the 3-17 keV band of the 1ES 1210-646 sky region. |
| Open with DEXTER | |
| In the text | |
Copyright ESO 2010
Current usage metrics show cumulative count of Article Views (full-text article views including HTML views, PDF and ePub downloads, according to the available data) and Abstracts Views on Vision4Press platform.
Data correspond to usage on the plateform after 2015. The current usage metrics is available 48-96 hours after online publication and is updated daily on week days.
Initial download of the metrics may take a while.