| Issue |
A&A
Volume 510, February 2010
|
|
|---|---|---|
| Article Number | A108 | |
| Number of page(s) | 14 | |
| Section | Extragalactic astronomy | |
| DOI | https://doi.org/10.1051/0004-6361/200913083 | |
| Published online | 18 February 2010 | |
VLT spectropolarimetry of the optical transient in NGC 300
Evidence of asymmetry in the
circumstellar dust![[*]](/icons/foot_motif.png)
F. Patat1 - J. R. Maund2 - S. Benetti3 - M. T. Botticella4 - E. Cappellaro3 - A. Harutyunyan3,5 - M. Turatto6
1 - European Organization for Astronomical Research in the Southern
Hemisphere (ESO), K. Schwarzschild-str. 2, 85748 Garching b.
München, Germany
2 - Dark Cosmology Centre, Niels Bohr Institute, University
of Copenhagen, Juliane Maries Vej, 2100 Copenhagen, Denmark
3 - Istituto Nazionale di Astrofisica, Osservatorio Astronomico di
Padova, v. Osservatorio n.5, 35122 Padua, Italy
4 - Queen's University - Belfast, BT7 1NN, Northern Ireland, UK
5 - Fundación Galileo Galilei - INAF, Telescopio Nazionale Galileo,
38700 Santa Cruz de la Palma, Tenerife, Spain
6 - Istituto Nazionale di Astrofisica, Osservatorio Astronomico
di Catania, v. S. Sofia 78, 95123 Catania, Italy
Received 7 August 2009 / Accepted 2 October 2009
Abstract
Aims. We study possible signs of asymmetry in the
bright optical transient in NGC 300, to obtain independent
information about the explosion mechanism, the progenitor star and its
circumstellar environment.
Methods. Using VLT-FORS1, we obtained low-resolution
optical linear spectropolarimetry of NGC 300 OT2008-1
on two epochs, 48 and 55 days after the discovery, covering
the spectral range 3600-9330 Å.
Results. The data exhibit a continuum polarization
at a very significant level. At least two separate components are
identified. The first is characterized by both a strong wavelength
dependency and a constant position angle (
![]() degrees), which is
parallel to the local spiral arm of the host galaxy. The latter is
aligned along a completely different position angle (
degrees), which is
parallel to the local spiral arm of the host galaxy. The latter is
aligned along a completely different position angle (
![]() ). While the former is
identified as arising in the interstellar dust associated with
NGC 300, the latter is most likely caused by continuum
polarization by dust scattering in the circumstellar environment. No
line depolarization is detected in correspondence to the most intense
emission lines, disfavoring electron scattering as the source of
intrinsic polarization. This implies that there is a very small
deviation from symmetry in the continuum-forming region. Given the
observed level of intrinsic polarization, the transient must be
surrounded by a significant amount of dust (
). While the former is
identified as arising in the interstellar dust associated with
NGC 300, the latter is most likely caused by continuum
polarization by dust scattering in the circumstellar environment. No
line depolarization is detected in correspondence to the most intense
emission lines, disfavoring electron scattering as the source of
intrinsic polarization. This implies that there is a very small
deviation from symmetry in the continuum-forming region. Given the
observed level of intrinsic polarization, the transient must be
surrounded by a significant amount of dust (![]()
![]() ),
asymmetrically distributed within a few thousand AU. This
probably implies that one or more asymmetric outflow episodes took
place during the past history of the progenitor.
),
asymmetrically distributed within a few thousand AU. This
probably implies that one or more asymmetric outflow episodes took
place during the past history of the progenitor.
Key words: supernovae: general - ISM: general - dust, extinction - globular clusters: individual: NGC 300 - techniques: spectroscopic - techniques: polarimetric
1 Introduction
Many surveys have focused their interest on poorly known objects lying
in the gap in the absolute magnitude distribution that separates
luminous novae (
![]() )
and faint supernovae (
)
and faint supernovae (
![]() )
(e.g., Rau et al. 2008).
Although this gap had been
understood to be populated mostly by eruptions of luminous blue
variables (LBVs, see Maund et al. 2006), it is now
evident
that new types of explosions may be responsible for the transient
events occurring in this luminosity range, from exotic (LBV-like)
outbursts of Wolf-Rayet stars (Pastorello et al. 2007a) to
other long duration transients, such as M85 OT2006-1 (Kulkarni
et al. 2007;
Rau et al. 2008;
Ofek et al. 2008;
Pastorello et al. 2007b),
whose nature remains debated. In
this context, a significant impulse to the study of objects in this
gap was brought about by the discoveries of two nearby objects, namely
SN 2008S in NGC 6946 and the 2008 luminous optical
transient in
NGC 300 (hereafter NGC 300 OT2008-1).
)
(e.g., Rau et al. 2008).
Although this gap had been
understood to be populated mostly by eruptions of luminous blue
variables (LBVs, see Maund et al. 2006), it is now
evident
that new types of explosions may be responsible for the transient
events occurring in this luminosity range, from exotic (LBV-like)
outbursts of Wolf-Rayet stars (Pastorello et al. 2007a) to
other long duration transients, such as M85 OT2006-1 (Kulkarni
et al. 2007;
Rau et al. 2008;
Ofek et al. 2008;
Pastorello et al. 2007b),
whose nature remains debated. In
this context, a significant impulse to the study of objects in this
gap was brought about by the discoveries of two nearby objects, namely
SN 2008S in NGC 6946 and the 2008 luminous optical
transient in
NGC 300 (hereafter NGC 300 OT2008-1).
NGC 300 OT2008-1 was discovered on
May 14, 2008 (Monard
2008). A
spectrum obtained the day after, revealing
H![]() ,
H
,
H![]() ,
Ca II near-IR triplet, forbidden [Ca II] doublet
in emission, and Ca II H&K absorptions (Bond
et al. 2008),
shared striking similarities with that of SN 2008S
(Prieto 2008).
The photometric and spectroscopic
properties of the transient in NGC 300 led to the conclusion
that this
was not a classical nova, an LBV, or a supernova (Bond et al. 2009). According to
Bond et al. (2008,
2009), the
spectrum was reminiscent of that of V838 Mon
during the early phases of its outburst (Wisniewski et al. 2003). Broad-band
optical and near-IR photometric, plus
low and intermediate resolution spectroscopic follow-up observations
were presented by Bond et al. (2009), while Berger
et al. (2009)
reported on UV, radio, and X-ray imaging and
high resolution spectroscopy. Remarkably, no source was detected at
the position of NGC 300 OT2008-1 in the radio and
X-ray observations,
which indicates that the transient was at least one order of magnitude
(in the radio domain) and two orders of magnitudes (in the X-rays
region) fainter than any SN discovered to date. In addition,
high-resolution spectroscopy suggests the presence of a complex
circumstellar environment resulting either from previous asymmetric
ejections from the progenitor or from a companion wind (Bond
et al. 2009;
Berger et al. 2009).
,
Ca II near-IR triplet, forbidden [Ca II] doublet
in emission, and Ca II H&K absorptions (Bond
et al. 2008),
shared striking similarities with that of SN 2008S
(Prieto 2008).
The photometric and spectroscopic
properties of the transient in NGC 300 led to the conclusion
that this
was not a classical nova, an LBV, or a supernova (Bond et al. 2009). According to
Bond et al. (2008,
2009), the
spectrum was reminiscent of that of V838 Mon
during the early phases of its outburst (Wisniewski et al. 2003). Broad-band
optical and near-IR photometric, plus
low and intermediate resolution spectroscopic follow-up observations
were presented by Bond et al. (2009), while Berger
et al. (2009)
reported on UV, radio, and X-ray imaging and
high resolution spectroscopy. Remarkably, no source was detected at
the position of NGC 300 OT2008-1 in the radio and
X-ray observations,
which indicates that the transient was at least one order of magnitude
(in the radio domain) and two orders of magnitudes (in the X-rays
region) fainter than any SN discovered to date. In addition,
high-resolution spectroscopy suggests the presence of a complex
circumstellar environment resulting either from previous asymmetric
ejections from the progenitor or from a companion wind (Bond
et al. 2009;
Berger et al. 2009).
An inspection of pre-explosion, archival HST images revealed
that no
star was detectable at the outburst position placing stringent upper
limits on the progenitor's luminosity, which was interpreted as an
additional argument in favor of a non-supernova origin (Berger
&
Soderberg 2008).
However, a progenitor candidate was
detected in pre-outburst Spitzer images (Prieto 2008;
Berger et al. 2009),
and it was identified as a massive
star (15-20 ![]() ),
with a spectral energy distribution very
similar to that exhibited by the progenitor of SN 2008S
(Prieto et al. 2008;
Botticella et al. 2009).
By means of an
independent method based on the study of the surrounding stellar
population, a similar range for the progenitor mass (12-17
),
with a spectral energy distribution very
similar to that exhibited by the progenitor of SN 2008S
(Prieto et al. 2008;
Botticella et al. 2009).
By means of an
independent method based on the study of the surrounding stellar
population, a similar range for the progenitor mass (12-17 ![]() )
was found by Gogarten et al. (2009), while Bond
et al. (2009)
gave a slightly lower mass range (10-15
)
was found by Gogarten et al. (2009), while Bond
et al. (2009)
gave a slightly lower mass range (10-15 ![]() ). An analysis of the
Spitzer/IRS mid-IR spectrum of
NGC 300 OT2008-1 obtained three months after the
outburst led Prieto
et al. (2009)
to conclude that, although the presence of a
massive star cannot be definitely excluded, a lower mass (6-10
). An analysis of the
Spitzer/IRS mid-IR spectrum of
NGC 300 OT2008-1 obtained three months after the
outburst led Prieto
et al. (2009)
to conclude that, although the presence of a
massive star cannot be definitely excluded, a lower mass (6-10 ![]() ,
carbon-rich AGB/super-AGB, or a post-AGB) precursor would
provide a better match to their mid-IR observations.
,
carbon-rich AGB/super-AGB, or a post-AGB) precursor would
provide a better match to their mid-IR observations.
Albeit with some scatter in the estimate of the progenitor's mass, most studies favor an exotic eruption of a moderate-to-massive star for NGC 300 OT2008-1 (and SN 2008S). However, Botticella et al. (2009) emphasized the overall similarity between the light curves of these transients and those of type II-L SNe. The main argument was the late-time flattening, which is consistent with the slope expected from the radioactive decay of 56Co into 56Fe. If this mechanism plays a role in powering the light curve of these transients, then a SN explosion is the most likely engine (electron-capture SNe, see Botticella et al. 2009; Pumo et al. 2009).
Soon after the discovery, we started an optical/near-IR follow-up using a number of ground-based facilities. The results will be presented and discussed in a forthcoming paper (Pastorello et al. 2009, in prep.). In this paper we focus on the spectropolarimetry of NGC 300 OT2008-1 that we obtained in July 2008 with VLT-FORS1 on two epochs separated by a week, with the aim of detecting possible signs of asymmetries in the ejecta and/or in the circumstellar environment that could provide additional constraints on the progenitor's nature.
The paper is organized as follows. In Sect. 2 we discuss the observations and the data reduction techniques. In Sect. 3 we present the flux spectra, while Sect. 4 deals with the spectropolarimetric data sets. In Sect. 5, we discuss the results, and we summarize our conclusions in Sect. 6. Appendix A contains an analysis of the effects of second order contamination on spectropolarimetry and its application to the data presented in this work, while Appendix B describes the effect of multiple weak polarizers on the resulting polarization signal.
2 Observations and data reduction
We observed the OT in NGC 300 on 2 different epochs,
48 and 55 days
after its discovery (Monard 2008),
using the FOcal
Reducer/low-dispersion Spectrograph (hereafter FORS1), mounted at the
Cassegrain focus of the ESO-Kueyen 8.2 m telescope
(Appenzeller et al. 1998).
In this multi-mode instrument, equipped with
a mosaic of two ![]() pixel
(px) E2V CCDs, polarimetry is
performed by introducing into the optical path a Wollaston prism
(19
pixel
(px) E2V CCDs, polarimetry is
performed by introducing into the optical path a Wollaston prism
(19
![]() throw) and a super-achromatic half-wave plate
(HWP). To reduce some known instrumental problems (see Patat &
Romaniello 2006),
we always used 4 half-wave plate angles
(
throw) and a super-achromatic half-wave plate
(HWP). To reduce some known instrumental problems (see Patat &
Romaniello 2006),
we always used 4 half-wave plate angles
(
![]() ,
22.5, 45 and 67.5 degrees). All spectra were obtained
with the low-resolution G300V grism coupled with a
1.0 arcsec slit,
giving a spectral range 3200-9330 Å, a dispersion of
,
22.5, 45 and 67.5 degrees). All spectra were obtained
with the low-resolution G300V grism coupled with a
1.0 arcsec slit,
giving a spectral range 3200-9330 Å, a dispersion of ![]() 3.2 Å
px-1, and a resolution of 11.6 Å (FWHM)
at 5800 Å. To cover
the blue part of the optical spectrum (
3.2 Å
px-1, and a resolution of 11.6 Å (FWHM)
at 5800 Å. To cover
the blue part of the optical spectrum (![]() 4350 Å), where
significant Ca II H&K absorption is clearly evident,
we have not used
an order sorting filter. Since the object is rather red (
4350 Å), where
significant Ca II H&K absorption is clearly evident,
we have not used
an order sorting filter. Since the object is rather red (
![]() ,
see Sect. 3),
the second order contamination, which for
this grism starts at about 6600 Å (O'Brien 2008), is
expected to be small and its effects on the spectropolarimetry of
NGC 300 OT2008-1 negligible. This is discussed more
quantitatively in
Appendix A.
,
see Sect. 3),
the second order contamination, which for
this grism starts at about 6600 Å (O'Brien 2008), is
expected to be small and its effects on the spectropolarimetry of
NGC 300 OT2008-1 negligible. This is discussed more
quantitatively in
Appendix A.
Data were bias and flat-field corrected, and wavelength
calibrated
using standard tasks within IRAF![]() .
The rms error in
the wavelength calibration is about 0.7 Å. The ordinary
(upper) and
extraordinary (lower) beams were processed separately. Stokes
parameters, linear polarization degree, and position angle were
computed by means of specific routines written by us. Finally,
polarization bias correction and error estimates were performed
following the prescriptions described by Patat & Romaniello
(2006), while
the HWP zeropoint angle chromatism was
corrected using tabulated data (O'Brien 2008). To increase the
signal-to-noise ratio, the final Stokes parameters were binned in
.
The rms error in
the wavelength calibration is about 0.7 Å. The ordinary
(upper) and
extraordinary (lower) beams were processed separately. Stokes
parameters, linear polarization degree, and position angle were
computed by means of specific routines written by us. Finally,
polarization bias correction and error estimates were performed
following the prescriptions described by Patat & Romaniello
(2006), while
the HWP zeropoint angle chromatism was
corrected using tabulated data (O'Brien 2008). To increase the
signal-to-noise ratio, the final Stokes parameters were binned in
![]() 25.8 Å
wide bins (8 pixels). This turns into an rms error in
the polarization of 0.1% at 6000 Å, where the continuum
signal-to-noise ratio per resolution element reaches its maximum (720
and 530 on the first and the second epoch, respectively). The spectra
are severely affected by fringing above
25.8 Å
wide bins (8 pixels). This turns into an rms error in
the polarization of 0.1% at 6000 Å, where the continuum
signal-to-noise ratio per resolution element reaches its maximum (720
and 530 on the first and the second epoch, respectively). The spectra
are severely affected by fringing above ![]() 8000 Å, so that the
observed noise at the red edge of the wavelength range is
significantly greater than the statistical formal errors. The
instrument stability (including evolution of the fringing pattern) was
checked by comparing
8000 Å, so that the
observed noise at the red edge of the wavelength range is
significantly greater than the statistical formal errors. The
instrument stability (including evolution of the fringing pattern) was
checked by comparing ![]() ,
,
![]() pairs (Maund
2008) at the
two epochs. Their average differences
pairs (Maund
2008) at the
two epochs. Their average differences ![]() were
found to be
were
found to be ![]() and
and ![]() on the first and the
second epoch, respectively. These values are within the measurement
errors per resolution element (typically
on the first and the
second epoch, respectively. These values are within the measurement
errors per resolution element (typically ![]() 0.1%), thus confirming
the stability of the instrument in the relevant time interval. However,
they also imply possible systematic errors of up to about 0.1%, which
can be considered as the maximum accuracy one can reach with FORS1
using 4 HWP positions (see also Patat & Romaniello 2006).
0.1%), thus confirming
the stability of the instrument in the relevant time interval. However,
they also imply possible systematic errors of up to about 0.1%, which
can be considered as the maximum accuracy one can reach with FORS1
using 4 HWP positions (see also Patat & Romaniello 2006).
Flux calibration was achieved by observing a spectrophotometric standard star and inserting full polarimetric optics (HWP angle set to 0). A log of the observations is given in Table 1.
Table 1: Log of the VLT-FORS1 observations of NGC 300 OT2008-1.
3 Flux spectra
NGC 300 OT2008-1 was followed up in great detail by Bond et al. (2009) and Berger et al. (2009), to which we refer the reader for a comprehensive account of the spectroscopic properties of this object and its evolution. In the following, we provide a brief description of the flux spectra, while they will be discussed in more detail in the analysis of the whole spectroscopic data set of NGC 300 OT2008-1 (Pastorello et al., in prep.).
The spectra, obtained by coadding for each epoch the ordinary
and
extraordinary beams for all the four HWP angles, are presented in
Fig. 1.
Between the two epochs, which are separated
by seven days, no evolution is evident and the spectrum consists of a
red continuum with a number of superimposed narrow emission lines. As
Bond et al. (2008)
pointed out, the most prominent spectral
lines can be identified with the Balmer series of Hydrogen,
Ca II
8498 Å, 8542 Å, 8662 Å, and [Ca II]
7291, 7324 Å. The H lines can
be identified to wavelength as sort as H![]() and the Balmer jump
at
and the Balmer jump
at ![]() 3650 Å
is clearly detected
(Fig. 1).
Additionally, our spectra appear to contain
He I 3888 Å, 4571 Å, 5015 Å,
5876 Å, 6678 Å, 7065 Å absorption
lines, which are clearly seen in the higher resolution spectra
presented and discussed by Berger et al. (2009). Finally,
Ca II H&K and Na ID are visible in absorption
and are contaminated by
unresolved features arising in the ISM (see also Berger et al.
2009).
3650 Å
is clearly detected
(Fig. 1).
Additionally, our spectra appear to contain
He I 3888 Å, 4571 Å, 5015 Å,
5876 Å, 6678 Å, 7065 Å absorption
lines, which are clearly seen in the higher resolution spectra
presented and discussed by Berger et al. (2009). Finally,
Ca II H&K and Na ID are visible in absorption
and are contaminated by
unresolved features arising in the ISM (see also Berger et al.
2009).
![\begin{figure}
\par\includegraphics[width=9cm,clip]{13083f01.eps}
\end{figure}](/articles/aa/full_html/2010/02/aa13083-09/img46.png)
|
Figure 1: Flux spectra of NGC 300 OT2008-1 on 2008 July 1 ( upper) and 2008 July 8 ( lower). For presentation, the spectrum of the second epoch was shifted by -0.4. The main spectral features are identified. |
| Open with DEXTER | |
While the absolute flux scales should be compared to broadband
photometry when this becomes available, the overall shape of the
spectra is expected to be accurate to within 10-15%. The colors
deduced from synthetic photometry are B-V
= + 1.1, V-R =+0.6, and
V-I
= + 1.1 for both epochs, with rms uncertainties of about
0.15 mag.
These values are fully compatible (within the quoted errors) with the
broadband photometry reported by Berger et al. (2009) for
June 19 (
![]() ;
see their Table 2).
Because of the
relatively high value of B-V,
the flux contamination by the second
order above 6500 Å is expected to be less than a few percent
(see
Appendix A).
;
see their Table 2).
Because of the
relatively high value of B-V,
the flux contamination by the second
order above 6500 Å is expected to be less than a few percent
(see
Appendix A).
The measured FWHMs of H![]() ,
H
,
H![]() ,
and Ca II 8662 Å are
,
and Ca II 8662 Å are
![]() Å,
Å, ![]() Å
and
Å
and ![]() Å, respectively.
Once corrected for the instrumental resolution (11.6 Å), these
values
correspond to expansion velocities of 660, 460, and
720 km s-1. In general, the
spectrum of NGC 300 OT2008-1 is very similar
to those reported for SN 2008S by Smith et al. (2009). Based
on the very low luminosity and expansion velocities, these authors
concluded that the object previously designated as SN 2008S is
actually a SN impostor (Van Dyk et al. 2000), similar to
the
giant eruption of a luminous blue variable, and shares the spectral
properties of the Galactic hypergiant IRC+10420 (Jones et al. 1993). Here we note
that, in general, SN 2008S differs
from a classical impostor, in that SN 2008S has a linear and
slow
evolving luminosity decline, and a spectrum that matches those of LBV
eruptions well, excluding its very strong [Ca II] doublet.
Based
on similar considerations, both Bond et al. (2009) and Berger
et al. (2009)
concluded that NGC 300 OT2008-1 was the
eruption of a dust-enshrouded, massive star. An alternative scenario
was proposed by Prieto et al. (2008), Thompson
et al. (2009),
and Botticella et al. (2009),
who argued
that SN 2008S and NGC 300 OT2008-1 were
generated by the explosion of an
electron-capture SN.
Å, respectively.
Once corrected for the instrumental resolution (11.6 Å), these
values
correspond to expansion velocities of 660, 460, and
720 km s-1. In general, the
spectrum of NGC 300 OT2008-1 is very similar
to those reported for SN 2008S by Smith et al. (2009). Based
on the very low luminosity and expansion velocities, these authors
concluded that the object previously designated as SN 2008S is
actually a SN impostor (Van Dyk et al. 2000), similar to
the
giant eruption of a luminous blue variable, and shares the spectral
properties of the Galactic hypergiant IRC+10420 (Jones et al. 1993). Here we note
that, in general, SN 2008S differs
from a classical impostor, in that SN 2008S has a linear and
slow
evolving luminosity decline, and a spectrum that matches those of LBV
eruptions well, excluding its very strong [Ca II] doublet.
Based
on similar considerations, both Bond et al. (2009) and Berger
et al. (2009)
concluded that NGC 300 OT2008-1 was the
eruption of a dust-enshrouded, massive star. An alternative scenario
was proposed by Prieto et al. (2008), Thompson
et al. (2009),
and Botticella et al. (2009),
who argued
that SN 2008S and NGC 300 OT2008-1 were
generated by the explosion of an
electron-capture SN.
4 Spectropolarimetry
The spectropolarimetric data for NGC 300 OT2008-1 are presented in the Q-U plane in Fig. 2. The object exhibits a significant polarization, which reaches a maximum level of about 1.4%. During both epochs, the data cover a range of polarization values which are definitely much higher than expected for a typical Serkowski law (Serkowski et al. 1975, see also next section) with a similar maximum polarization (see Fig. 2 and its caption). No obvious change in polarization is seen across the most prominent emission lines (Sect. 4.2).
![\begin{figure}
\par\includegraphics[width=100mm,angle=-90]{13083f02.eps}
\end{figure}](/articles/aa/full_html/2010/02/aa13083-09/img53.png)
|
Figure 2:
Observed spectropolarimetry of NGC 300 OT2008-1 at
the two epochs on the Stokes Q-U
plane. For presentation, the data were binned to 16 pixels
(57 Å). The dotted circles are placed at constant polarization
levels (0.5, 1.0, 1.5, and 2.0%). The dashed line is a weighted least
squares fit to the data in the displayed wavelength range. For
comparison, the colored line sequence of dots in the upper left
quadrant traces a Serkowski law (Serkowski et al. 1975) for |
| Open with DEXTER | |
4.1 Continuum polarization
The most remarkable aspect of the Q-U
plot is the alignment of the
data points along a straight line, which is indicative of a
polarization component with a clearly defined dominant axis. This does
not pass through the origin of the Q-U
plane, implying that there
must be an additional component with a polarization wavelength
dependence which differs from that along the dominant axis (see
Appendix B).
We also note that the two data sets span
similar ranges of values along the dominant direction, but that a
rigid shift is present between the two epochs. This is more clearly
illustrated in Fig. 3,
where we plot the differences
![]() and
and ![]() between the two epochs. The clipped average
differences (computed in the wavelength range 3900-9300 Å) are
between the two epochs. The clipped average
differences (computed in the wavelength range 3900-9300 Å) are
![]() (191 spectral bins) and
(191 spectral bins) and
![]() (193 spectral bins), and
the rms deviation from the average is 0.23 and 0.21% for the
two
Stokes parameters, respectively. Given that the observed grey
variation is very small and comparable to the instrument stability
between the two epochs (
(193 spectral bins), and
the rms deviation from the average is 0.23 and 0.21% for the
two
Stokes parameters, respectively. Given that the observed grey
variation is very small and comparable to the instrument stability
between the two epochs (![]() 0.1%,
see Sect. 2),
it is
unclear whether this is real or caused by an incompletely removed
instrumental effect.
0.1%,
see Sect. 2),
it is
unclear whether this is real or caused by an incompletely removed
instrumental effect.
![\begin{figure}
\par\includegraphics[width=80mm,clip]{13083f03.eps}
\end{figure}](/articles/aa/full_html/2010/02/aa13083-09/img58.png)
|
Figure 3:
Differences in Q ( upper panel)
and U ( lower panel) Stokes
parameters between the two epochs (second minus
first). Empty symbols indicate the data points rejected by the
k- |
| Open with DEXTER | |
Table 2: Dominant axis least squares fit parameters.
To characterize the dominant axis, we fitted the data with a
linear relation
The results of the least squares fitting for the two epochs in the wavelength range 4000-9000 Å are reported in Table 2 (upper part), which includes the rms deviation from the best-fit relation (
![\begin{figure}
\par\includegraphics[width=8cm,clip]{13083f04.eps}
\end{figure}](/articles/aa/full_html/2010/02/aa13083-09/img62.png)
|
Figure 4:
A DSS image of NGC 300. The location of the optical transient
is marked by a cross. The arrow indicates the polarization position
angle of the dominant axis (the average of the values measured during
the two epochs was used: |
| Open with DEXTER | |
The estimated position angles at the two epochs differ by ![]() degrees.
Since this variation is only marginally significant, we adopt
the average of the two values (
degrees.
Since this variation is only marginally significant, we adopt
the average of the two values (
![]() degrees) as the
representative value. For consistency, we rotated the two data sets by
-1.0 and +1.0 degrees, respectively. The results of the least
squares fitting after this operation are shown in
Table 2
(lower part). The recomputed average
differences in Q and U
are
degrees) as the
representative value. For consistency, we rotated the two data sets by
-1.0 and +1.0 degrees, respectively. The results of the least
squares fitting after this operation are shown in
Table 2
(lower part). The recomputed average
differences in Q and U
are ![]() %
and
%
and ![]() %.
This means that the systematic,
wavelength-independent shift observed between the two epochs is not
related to this small rotation.
%.
This means that the systematic,
wavelength-independent shift observed between the two epochs is not
related to this small rotation.
As we said, the position of the points on the Q-U
plane requires an
additional polarization component. The simplest solution is given by a
wavelength-independent polarization, represented by one single point
(Q1,U1)
on the Q-U plane. In these
circumstances, the total,
observed Stokes parameters Q and U
are given by ![]() and
and ![]() ,
where Q2 and U2
are
the Stokes parameters that characterize the polarization aligned along
the dominant axis
,
where Q2 and U2
are
the Stokes parameters that characterize the polarization aligned along
the dominant axis![]() .
Of course, if the ratio of Q2
to U2must remain constant
(as required by the wavelength-independent
position angle), Q1 and U1
must obey Eq. (1),
i.e. (Q1,U1)
must be aligned along the observed dominant
axis. One additional constraint related to the definitions of Q
and
U is that all the (Q2,U2)
points have to be confined to one
single quadrant of the Q-U plane
(Wang et al. 2003),
which,
in our case, is that with Q<0 and U>0.
This imposes that Q1 is
higher than a certain value
.
Of course, if the ratio of Q2
to U2must remain constant
(as required by the wavelength-independent
position angle), Q1 and U1
must obey Eq. (1),
i.e. (Q1,U1)
must be aligned along the observed dominant
axis. One additional constraint related to the definitions of Q
and
U is that all the (Q2,U2)
points have to be confined to one
single quadrant of the Q-U plane
(Wang et al. 2003),
which,
in our case, is that with Q<0 and U>0.
This imposes that Q1 is
higher than a certain value ![]() ,
but does not prevent Q1being
any higher arbitrary value (see the arrow in
Fig. 2).
For this reason, although constrained, the
solution is not unique. As a consequence, while the position angle of
the dominant axis (
,
but does not prevent Q1being
any higher arbitrary value (see the arrow in
Fig. 2).
For this reason, although constrained, the
solution is not unique. As a consequence, while the position angle of
the dominant axis (![]() )
is fixed, the corresponding
polarization
)
is fixed, the corresponding
polarization ![]() is
undefined up to an additive constant, which depends on the particular
choice of the wavelength-independent polarization
is
undefined up to an additive constant, which depends on the particular
choice of the wavelength-independent polarization
![]() .
Since (Q1,U1)
must lie along the
dominant axis, the corresponding value of
.
Since (Q1,U1)
must lie along the
dominant axis, the corresponding value of ![]() is
allowed to vary only within a rather limited range (smaller than 10
degrees), regardless how large the value of Q1 is.
is
allowed to vary only within a rather limited range (smaller than 10
degrees), regardless how large the value of Q1 is.
4.1.1 Minimum polarization solution
Table 3: Minimum polarization solutions for the two epochs.
In the following, we consider what we will indicate as minimum
polarization solution (MPS), i.e., the solution one obtains
for
![]() ,
and that leads to the minimum possible values of the
polarization degree for both components. Given the wavelength
dependency shown by the data (Fig. 2), this means
that
the MPS corresponds to the case where the polarization is close to
zero at the red edge of the observed wavelength range (
,
and that leads to the minimum possible values of the
polarization degree for both components. Given the wavelength
dependency shown by the data (Fig. 2), this means
that
the MPS corresponds to the case where the polarization is close to
zero at the red edge of the observed wavelength range (![]() 9300 Å).
The solution was found as the value of Q1
that produces the minimum
constant value of
9300 Å).
The solution was found as the value of Q1
that produces the minimum
constant value of ![]() at any given wavelength, while
fulfilling the constraints described above. Since we had shown that
the two data-sets differ by a wavelength-independent quantity
(cf. Fig. 3),
we computed Q1 for the
second
epoch and set the value for the first epoch such that
at any given wavelength, while
fulfilling the constraints described above. Since we had shown that
the two data-sets differ by a wavelength-independent quantity
(cf. Fig. 3),
we computed Q1 for the
second
epoch and set the value for the first epoch such that ![]() (see above). Within the errors, this ensures that
(see above). Within the errors, this ensures that
![]() does not change between the two dates. The results of
this procedure are presented in Table 3 and illustrated
in
Fig. 5
for the second epoch. What emerges from this
analysis is that the additive, wavelength-independent component is
polarized at a highly significant level, which reaches at
least 1.2%. Its position angle (
does not change between the two dates. The results of
this procedure are presented in Table 3 and illustrated
in
Fig. 5
for the second epoch. What emerges from this
analysis is that the additive, wavelength-independent component is
polarized at a highly significant level, which reaches at
least 1.2%. Its position angle (
![]() degrees, averaged
over the two
epochs) is very different from that of the dominant component,
indicating that they must arise from dissimilar sources
(see the discussion in Sect. 5).
degrees, averaged
over the two
epochs) is very different from that of the dominant component,
indicating that they must arise from dissimilar sources
(see the discussion in Sect. 5).
![\begin{figure}
\par\includegraphics[width=8cm,clip]{13083f05.eps}
\end{figure}](/articles/aa/full_html/2010/02/aa13083-09/img78.png)
|
Figure 5: Minimum polarization solution for 2008 July 8. The dashed line traces the observed dominant axis, while the point (Q1,U1) indicates the wavelength-independent component. The empty circles mark the rejected data points. |
| Open with DEXTER | |
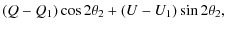
When, as in this case, there is a marked dominant direction, it is
useful to compute the components parallel (![]() )
and orthogonal (
)
and orthogonal (
![]() )
to this axis, as suggested by Wang et al. (2003). This is
achieved by the following roto-translation in the Q-U
plane:
)
to this axis, as suggested by Wang et al. (2003). This is
achieved by the following roto-translation in the Q-U
plane:
| |
= | 
|
|
| = |
While
![\begin{figure}
\par\includegraphics[width=8cm,clip]{13083f06.eps}
\end{figure}](/articles/aa/full_html/2010/02/aa13083-09/img90.png)
|
Figure 6:
Dominant ( upper panel) and orthogonal (
lower panel) polarization on 2008 July 1 after
subtracting the
wavelength-independent component |
| Open with DEXTER | |
![\begin{figure}
\par\includegraphics[width=8cm,clip]{13083f07.eps}
\end{figure}](/articles/aa/full_html/2010/02/aa13083-09/img91.png)
|
Figure 7: Same as Fig. 6 for 2008 July 8. |
| Open with DEXTER | |
For highly reddened Galactic stars, Serkowski et al. (1975) showed that
the linear polarization degree changes with wavelength according to the
empirical law
where
This marked deviation indicates that the dust mixture
responsible for
the polarization most likely differs from a typical Galactic
mixture. Therefore, Serkowski's Galactic relation between color excess
and maximum polarization (
![]() )
probably does
not hold for NGC 300 OT2008-1. In this respect, we
note that the ISP
wavelength dependency observed in several supernovae also clearly
deviates from the Galactic Serkowski law (Leonard & Filippenko
2001; Leonard
et al. 2002;
Maund et al.
2007; Patat
et al. 2009).
For the hypothesis that
the dominant polarization detected in
NGC 300 OT2008-1 is produced by
dust extinction, as all elements seem to indicate, one can attempt to
estimate reddening from the observed level of polarization. Blindly
using
)
probably does
not hold for NGC 300 OT2008-1. In this respect, we
note that the ISP
wavelength dependency observed in several supernovae also clearly
deviates from the Galactic Serkowski law (Leonard & Filippenko
2001; Leonard
et al. 2002;
Maund et al.
2007; Patat
et al. 2009).
For the hypothesis that
the dominant polarization detected in
NGC 300 OT2008-1 is produced by
dust extinction, as all elements seem to indicate, one can attempt to
estimate reddening from the observed level of polarization. Blindly
using ![]() in the quoted relation, one obtains an upper
limit to the color excess given by
in the quoted relation, one obtains an upper
limit to the color excess given by ![]() .
The observed
deviation from a Galactic Serkowski law casts serious doubts on the
reliability of this estimate, and what we quote here is just for the
sake of completeness. To our knowledge no polarimetric study on
NGC 300 exists in the literature. Therefore, it is not
possible to
tell whether the observed wavelength dependency is typical of the host
galaxy or is a peculiarity of the line of sight to
NGC 300 OT2008-1.
However, we note that the extinction law along the line of sight to
young clusters in NGC 300 was reported to be highly variable
(Roussel
et al. 2005).
.
The observed
deviation from a Galactic Serkowski law casts serious doubts on the
reliability of this estimate, and what we quote here is just for the
sake of completeness. To our knowledge no polarimetric study on
NGC 300 exists in the literature. Therefore, it is not
possible to
tell whether the observed wavelength dependency is typical of the host
galaxy or is a peculiarity of the line of sight to
NGC 300 OT2008-1.
However, we note that the extinction law along the line of sight to
young clusters in NGC 300 was reported to be highly variable
(Roussel
et al. 2005).
Based on photometric considerations, Bond et al. (2009)
report EB-V
= 0.4, while Berger et al. (2009) derive
![]() from the equivalent width of the Na I D
lines. They conclude that this low value for the reddening is
consistent with the lack of obvious evidence of extinction in their
optical and UV spectra, and point out that this is in line with
evidence of dust destruction in the immediate surroundings of the
outbursting star. The extinction arising within the Milky Way is very
small (
EB-V
= 0.013, Schlegel et al. 1998)
and the bulk of reddening has to occur within the host galaxy, and so
is most likely the case for interstellar polarization. The compilation
of Heiles (1999)
contains a few stars close in galactic
coordinates to
NGC 300
from the equivalent width of the Na I D
lines. They conclude that this low value for the reddening is
consistent with the lack of obvious evidence of extinction in their
optical and UV spectra, and point out that this is in line with
evidence of dust destruction in the immediate surroundings of the
outbursting star. The extinction arising within the Milky Way is very
small (
EB-V
= 0.013, Schlegel et al. 1998)
and the bulk of reddening has to occur within the host galaxy, and so
is most likely the case for interstellar polarization. The compilation
of Heiles (1999)
contains a few stars close in galactic
coordinates to
NGC 300![]() .
All of them have linear polarizations
.
All of them have linear polarizations ![]() 0.1%, in close agreement
with the low Galactic extinction along this line of sight.
0.1%, in close agreement
with the low Galactic extinction along this line of sight.
The best-fit global solution is compared to the observed
Stokes
parameters and position angle in Fig. 8 for the data
acquired on 2008 July 8. The fit is fairly good for this epoch
(
![]() ,
rms = 0.20%), while for the first epoch the observed
data points show higher scatter redwards of
,
rms = 0.20%), while for the first epoch the observed
data points show higher scatter redwards of ![]() 7000 Å
(
7000 Å
(
![]() ,
rms = 0.28%).
,
rms = 0.28%).
![\begin{figure}
\par\includegraphics[width=8cm,clip]{13083f08.eps}
\end{figure}](/articles/aa/full_html/2010/02/aa13083-09/img106.png)
|
Figure 8:
Best fit solution for 2008 July 8 compared to the observed
Stokes parameters ( lower panel), position
angle ( upper panel) and polarization level (upper
panel). The curves trace the wavelength-independent component |
| Open with DEXTER | |
The synthetic B,V,R,
and I broad-band polarizations are reported
in Table 4.
As we have shown for the spectra, the
observed variations (all highly significant) can be explained in terms
of evolution in the wavelength-independent component. After applying
the systematic differences ![]() and
and ![]() to the second epoch and re-computing the synthetic
broad-band polarimetry, both the polarization angle and degree are
consistent (within the errors) with those derived for the first epoch
(Table 4,
last row). Interestingly, the variation in
Q1 and U1
takes place along a direction (PA =
to the second epoch and re-computing the synthetic
broad-band polarimetry, both the polarization angle and degree are
consistent (within the errors) with those derived for the first epoch
(Table 4,
last row). Interestingly, the variation in
Q1 and U1
takes place along a direction (PA =
![]() )
consistent with the average position angle of
)
consistent with the average position angle of ![]() (
(
![]() ). If this variation were
real, this would imply that
the wavelength-independent component evolves just within its
polarization level, while the position angle remains practically
unchanged. This change in the polarization level is indicative of an
intrinsic origin. However, since the observed variation is within the
typical instrumental stability limits (
). If this variation were
real, this would imply that
the wavelength-independent component evolves just within its
polarization level, while the position angle remains practically
unchanged. This change in the polarization level is indicative of an
intrinsic origin. However, since the observed variation is within the
typical instrumental stability limits (![]() 0.1%, see
Sect. 2),
no solid conclusion about its nature can be
reached.
0.1%, see
Sect. 2),
no solid conclusion about its nature can be
reached.
Table 4: Synthetic broadband polarimetry of NGC 300 OT2008-1.
4.2 Line polarization
Although the resolution of our spectra is rather low (![]() 12 Å
FWHM), we inspected the data searching for possible
line effects
corresponding to the most prominent emission lines. In doing this,
we first vectorially subtracted the contribution of the component
12 Å
FWHM), we inspected the data searching for possible
line effects
corresponding to the most prominent emission lines. In doing this,
we first vectorially subtracted the contribution of the component
![]() (which we
assumed to be of interstellar origin and to be
constant across the line profile) directly estimated fitting the
adjacent
(which we
assumed to be of interstellar origin and to be
constant across the line profile) directly estimated fitting the
adjacent ![]() and
and ![]() data points and
interpolating to the line wavelength
data points and
interpolating to the line wavelength![]() .
The case of
H
.
The case of
H![]() ,
the most intense feature (see Fig. 1), is
presented in Fig. 9
for the first epoch. Across the line
profile there is no evidence of the polarization changes that were
previously detected, for instance, in Nova Cygni 1992
(Bjorkman et al. 1994),
Nova Scuti 2003 (Kawabata et al. 2006),
and V838 Mon (Wisniewski et al. 2003). A similar
behavior is
observed during the second epoch and for all other prominent emission
lines (H
,
the most intense feature (see Fig. 1), is
presented in Fig. 9
for the first epoch. Across the line
profile there is no evidence of the polarization changes that were
previously detected, for instance, in Nova Cygni 1992
(Bjorkman et al. 1994),
Nova Scuti 2003 (Kawabata et al. 2006),
and V838 Mon (Wisniewski et al. 2003). A similar
behavior is
observed during the second epoch and for all other prominent emission
lines (H![]() and Ca II NIR triplet), in the sense that the observed
polarization remains at the wavelength-independent level of
and Ca II NIR triplet), in the sense that the observed
polarization remains at the wavelength-independent level of
![]() .
If the emission line is essentially unpolarized
(Harrington & Collins 1968),
the ratio of line to
continuum polarization is given by the following semi-empirical
relation (McLean & Clarke 1979):
.
If the emission line is essentially unpolarized
(Harrington & Collins 1968),
the ratio of line to
continuum polarization is given by the following semi-empirical
relation (McLean & Clarke 1979):
where
![\begin{figure}
\par\includegraphics[width=8cm,clip]{13083f09.eps}
\end{figure}](/articles/aa/full_html/2010/02/aa13083-09/img118.png)
|
Figure 9:
Spectropolarimetry of the H |
| Open with DEXTER | |
Finally, we searched for a polarization signal associated with the
pronounced Ca II H&K absorption, after vectorially
subtracting the
adjacent continuum polarization. Although we achieved a marginal
detection during the first epoch (
![]() ), this signal is not
present during the second and, therefore, we do not attach great
significance to this finding.
), this signal is not
present during the second and, therefore, we do not attach great
significance to this finding.
5 Discussion
The data presented in this paper show that the polarization observed
in NGC 300 OT2008-1 is generated by at least two,
almost
perpendicular, components ![]() and
and ![]() .
Because of the
constant polarization angle (rather precisely aligned along the local
spiral arm of NGC 300), and the wavelength dependence
(reminiscent of
a Serkowski law), we have interpreted
.
Because of the
constant polarization angle (rather precisely aligned along the local
spiral arm of NGC 300), and the wavelength dependence
(reminiscent of
a Serkowski law), we have interpreted ![]() as being caused by
ISP. The unusual shape of
as being caused by
ISP. The unusual shape of ![]() ,
with its large slope
parameter K, might be indicative of a dust mixture
that differs
in both chemical composition and grain size from that typical of the
Milky Way. As of today, there is no consistent model that explains the
empirical Serkowski law (Draine 2003a),
and it is therefore
impossible to derive the dust properties from the observed
wavelength dependence.
,
with its large slope
parameter K, might be indicative of a dust mixture
that differs
in both chemical composition and grain size from that typical of the
Milky Way. As of today, there is no consistent model that explains the
empirical Serkowski law (Draine 2003a),
and it is therefore
impossible to derive the dust properties from the observed
wavelength dependence.
After reasonably constraining the origin of ![]() ,
what remains
to be clarified is the nature of
,
what remains
to be clarified is the nature of ![]() .
.
5.1 Electron scattering
The most natural source of wavelength-independent linear polarization
in a stellar envelope is Thomson scattering by free electrons (van den
Hulst 1957).
This is, for instance, the source of continuum
polarization in supernovae (Höflich 1991). More
generally, polarization by electron scattering is supposed to
originate in stars with ionized and spatially extended atmospheres,
such as Be and shell stars, Of and Wolf-Rayet stars, and early-type
supergiants (Brown & McLean 1977).
A non-null net
polarization is indicative of an asymmetry in the continuum emitting
region, and can be understood in terms of partial cancellation of the
intrinsic polarization generated by the Thomson scattering. In the
case of NGC 300 OT2008-1, and based on the assumption
of a spheroidal
photosphere, the measured level of polarization (
![]() )
would
indicate a substantial asphericity, of axial ratio
)
would
indicate a substantial asphericity, of axial ratio ![]() 0.8
(Höflich 1991).
This geometry would produce a
wavelength-independent polarization, characterized by a constant
polarization angle (perpendicular to the major axis), similar to what
is observed.
0.8
(Höflich 1991).
This geometry would produce a
wavelength-independent polarization, characterized by a constant
polarization angle (perpendicular to the major axis), similar to what
is observed.
Evidences of electron scattering polarization (at a level of about 0.5%) were found in the early phases of Nova Cygni 1992 (Bjorkman et al. 1994) and V838 Mon (Wisniewski et al. 2003). In both cases this was interpreted in terms of asymmetry in the continuum-forming region, identified with a flattened, spheroidal shell ejected during the outburst. Since in the optically thin case the polarization level is proportional to the electron-scattering optical depth (Brown & McLean 1977), the observed decrease in the polarization level is produced by the expansion of the shell. The systematic, gray-decline that we observe between our two epochs (see Sect. 4.1) might be interpreted along the same lines.
An important problem with the electron scattering scenario in NGC 300 OT2008-1 is the absence of line depolarization (Sect. 4.2). This effect is expected when the emission lines arise in an outer ionized region, where Thomson scattering has a lower optical depth (Harrington & Collins 1968; Clarke & McLean 1974). It is observed in a variety of objects, including Be stars (McLean & Clarke 1979), novae (Bjorkman et al. 1994; Kawabata et al. 2006), supernovae (SN 1987A, Cropper et al. 1988), eruptive events such as V838 Mon (Wisniewski et al. 2003), and the post-red supergiant IRC+10420 (Patel et al. 2008). However, we note that there are exceptions, in which continuum polarization is observed but no line effect is detected, both in Be stars (McLean & Clarke 1979; Quirrenbach et al. 1997) and in Nova Sagittarii 1999 (Kawabata et al. 2000).
The narrow absorption profile detected on top of the emission
lines
(Bond et al. 2009;
Berger et al. 2009.
For the
case of H![]() see also Fig. 9
here, upper panel)
might enhance the polarization within the overall line profile. A
similar phenomenon has been proposed to explain the absence of line
depolarization in the shell star
see also Fig. 9
here, upper panel)
might enhance the polarization within the overall line profile. A
similar phenomenon has been proposed to explain the absence of line
depolarization in the shell star ![]() Cen (McLean & Clarke
1979). Given
the modest depth of the narrow absorption, we
however propose this is not sufficient to explain the absence of
depolarization. Insufficient resolution can also be the responsible
for the lack of detection of line effects. However, we tend to exclude
this for our data, since the lines are partially resolved.
Cen (McLean & Clarke
1979). Given
the modest depth of the narrow absorption, we
however propose this is not sufficient to explain the absence of
depolarization. Insufficient resolution can also be the responsible
for the lack of detection of line effects. However, we tend to exclude
this for our data, since the lines are partially resolved.
Another possibility is that the continuum and the emission lines in NGC 300 OT2008-1 arise in similar regions, i.e., that the lines do not form very far above the pseudo-photosphere, so that both the continuum and the lines are subject to roughly the same amount of electron scattering. Although this scenario can only be verified through NLTE calculations, we note that this is quite unlikely. There is indeed strong evidence that in both SN 2008S and in NGC 300 OT2008-1 lines and continuum originate in very different regions. While the photospheric temperature and radius decrease with time, the emission lines evolve very slowly (Berger et al. 2009; Botticella et al. 2009). This and the very high Balmer decrement lead to the conclusion that the emission lines are generated by the interaction between the ejected shell and the pre-existing circumstellar material, while the continuum forms in an inner region (Berger et al. 2009).
Finally, there is a third possibility, i.e., that the polarization source is located outside both the photosphere and the line-forming region. This would probably exclude Thomson scattering by free electrons as the source of the observed polarization and requires an alternative explanation (see next section).
The absence of electron scattering in NGC 300 OT2008-1 can be explained in terms of a spherically symmetric photosphere. Although NGC 300 OT2008-1 and IRC+10420 have similar spectroscopic properties (Smith et al. 2009), the post-red hypergiant has a continuum polarization that is higher than 2%, which is indicative of a significative asymmetry in the continuum-forming region (Patel et al. 2008). Whatever the reason for the lack of line-depolarization in NGC 300 OT2008-1, it definitely indicates a radical difference between the physical conditions in the continuum/line-forming regions of the two objects.
5.2 Dust scattering
To explain the absence of line effects in Nova Sagittarii 1999, Kawabata et al. (2000) proposed that continuum polarization originates in a circumstellar dust cloud. The observed wavelength dependence (a power law with polarization significantly increasing towards the blue) was interpreted as being produced by small dust grains. In the case of SN 2008S, Botticella et al. (2009) found evidence of an extended dust shell, which is understood to be responsible for the large mid-infrared excess observed in the early phases. This was confirmed by radiative transfer calculations applied to mid-IR spectra, showing that a substantial amount of dust must have survived the outburst (Wesson et al. 2009). The existence of a conspicuous dust shell around NGC 300 OT2008-1, pre-dating the outburst, was demonstrated by Prieto et al. (2009) based on a mid-IR Spitzer spectrum obtained three months after the discovery. All of these results infer that dust scattering is a perfectly plausible source of continuum polarization in NGC 300 OT2008-1.
One important problem with the application of the
dust-scattering
scenario is the pronounced wavelength dependence this is expected to
produce. This can be easily understood as follows. If there is dust
surrounding the object, part of the light emitted outside the line of
sight would be scattered into the observer's direction and add to the
radiation traveling directly to her. Since the scattering by dust
produces a high degree of linear polarization (see for instance White
1979), depending
on the dust geometrical distribution this can
turn into a significant non null net polarization. If we consider an
infinitesimal dust volume element placed at some distance from the
central source and an incoming unpolarized packet of photons at a
given wavelength, to a first approximation![]() the fraction of photons scattered into the line of sight (polarized
perpendicularly to the plane of scattering) is proportional to
the fraction of photons scattered into the line of sight (polarized
perpendicularly to the plane of scattering) is proportional to
![]() (White
1979), where
(White
1979), where ![]() is the dust extinction
cross-section,
is the dust extinction
cross-section, ![]() is the dust albedo, and
is the dust albedo, and
![]() is the scattering phase function. This in turn
depends on the scattering angle
is the scattering phase function. This in turn
depends on the scattering angle ![]() and the degree of forward
scattering
and the degree of forward
scattering ![]() .
Since the albedo is roughly constant in the
optical domain and both
.
Since the albedo is roughly constant in the
optical domain and both ![]() and
and ![]() tend to increase
significantly in the blue, this implies that the polarization is
higher at shorter wavelengths. Using the carbonaceous-silicate grain
model by Li & Draine (2001)
and Draine (2003b)
and
adopting the usual parametrization by Henyey & Greenstein (1941)
for the scattering phase function, one can estimate this effect more
quantitatively. The result is shown in Fig. 10 for two
different scattering angles (30 and 70 degrees) and two
different
Milky Way dust mixtures
tend to increase
significantly in the blue, this implies that the polarization is
higher at shorter wavelengths. Using the carbonaceous-silicate grain
model by Li & Draine (2001)
and Draine (2003b)
and
adopting the usual parametrization by Henyey & Greenstein (1941)
for the scattering phase function, one can estimate this effect more
quantitatively. The result is shown in Fig. 10 for two
different scattering angles (30 and 70 degrees) and two
different
Milky Way dust mixtures![]() (RV = 3.1,
5.5). As anticipated, the polarization
significantly increases at shorter wavelengths, especially in the case
of lower RV,
and can be fairly well reproduced by an exponential
law
(RV = 3.1,
5.5). As anticipated, the polarization
significantly increases at shorter wavelengths, especially in the case
of lower RV,
and can be fairly well reproduced by an exponential
law ![]() .
For
.
For
![]() Å,
Å, ![]() for an average scattering angle of
for an average scattering angle of
![]() degrees
(corresponding to the typical value of the forward
scattering degree in the optical domain, i.e.,
degrees
(corresponding to the typical value of the forward
scattering degree in the optical domain, i.e., ![]() ).
).
![\begin{figure}
\par\includegraphics[width=8cm,clip]{13083f10.eps}
\end{figure}](/articles/aa/full_html/2010/02/aa13083-09/img134.png)
|
Figure 10: Expected polarization wavelength dependence of a Milky Way carbonaceous-silicate dust mixture in a single-scattering approximation for RV = 5.5 ( upper panel) and RV = 3.1 ( lower panel) and two different scattering angles. Dust model is from Li & Draine (2001) and Draine (2003b). |
| Open with DEXTER | |
With this result in hand, one can reverse the procedure and, using the
observed data, deduce the implied component ![]() .
This is shown
in Fig. 11,
where we have vectorially subtracted from
the data the exponential component
.
This is shown
in Fig. 11,
where we have vectorially subtracted from
the data the exponential component ![]() (
(
![]() ,
,
![]() and
and ![]() degrees).
As in the
wavelength-independent case, we have considered the minimum
polarization solution (see Sect. 4.1). As
illustrated by
Fig. 11,
the resulting
degrees).
As in the
wavelength-independent case, we have considered the minimum
polarization solution (see Sect. 4.1). As
illustrated by
Fig. 11,
the resulting ![]() is still well
aligned with a dominant axis (
rxy
= -0.96): the position angle is
is still well
aligned with a dominant axis (
rxy
= -0.96): the position angle is
![]() degrees and the rms
deviation is 0.31%, i.e., slightly
higher than for the wavelength-independent solution (cf. Table 2). This is
fully consistent with an
alignment along the local spiral arm of NGC 300, which is
indicative
of the interstellar nature of this component.
degrees and the rms
deviation is 0.31%, i.e., slightly
higher than for the wavelength-independent solution (cf. Table 2). This is
fully consistent with an
alignment along the local spiral arm of NGC 300, which is
indicative
of the interstellar nature of this component.
![\begin{figure}
\par\includegraphics[width=8cm,clip]{13083f11.eps}
\end{figure}](/articles/aa/full_html/2010/02/aa13083-09/img138.png)
|
Figure 11:
Minimum polarization solution with an
exponential polarization |
| Open with DEXTER | |
The position angle ![]() was fixed by constraining the dominant
axis to pass through the origin of the Q-U
plane (Wang et al. 2003).
As done in the wavelength-independent case
(Sect. 4.1),
we decomposed
was fixed by constraining the dominant
axis to pass through the origin of the Q-U
plane (Wang et al. 2003).
As done in the wavelength-independent case
(Sect. 4.1),
we decomposed ![]() along the directions
parallel and perpendicular to the dominant axis, as shown in
Fig. 12
for the second epoch. The rms deviation of the
orthogonal component
along the directions
parallel and perpendicular to the dominant axis, as shown in
Fig. 12
for the second epoch. The rms deviation of the
orthogonal component ![]() is 0.15%, which is consistent with the
typical measurement errors and indicates that there are no
statistically significant wavelength dependencies in the residual
polarization. As for
is 0.15%, which is consistent with the
typical measurement errors and indicates that there are no
statistically significant wavelength dependencies in the residual
polarization. As for ![]() ,
this shows a smooth behavior, and can be
reasonably well fitted by a Serkowski law with
,
this shows a smooth behavior, and can be
reasonably well fitted by a Serkowski law with ![]() ,
,
![]() Å,
and K = 3.0. This value of K is
still
large compared to what is typical of the Milky Way, but it is
significantly smaller than that required by the wavelength-independent
component (Sect. 4.1).
Å,
and K = 3.0. This value of K is
still
large compared to what is typical of the Milky Way, but it is
significantly smaller than that required by the wavelength-independent
component (Sect. 4.1).
![\begin{figure}
\par\includegraphics[width=8cm,clip]{13083f12.eps}
\end{figure}](/articles/aa/full_html/2010/02/aa13083-09/img140.png)
|
Figure 12:
Dominant ( upper panel) and orthogonal (
lower panel) polarization on 2008 July 8 after
subtracting the
exponential component |
| Open with DEXTER | |
The global solution is compared to the data in Fig. 13
for the second epoch. The fit is reasonably good, even though ![]() (2.5) and
the rms deviation (0.3%) are greater than in the
wavelength-independent solution (Sect. 4.1). Of course,
there is absolutely no reason why the wavelength dependency of dust
scattering in the circumstellar environment of
NGC 300 OT2008-1 should
be similar to that of the Milky Way. However, this illustrates that
the wavelength-independent solution, although giving the most accurate
reproduction of the data with the minimum number of free parameters,
is not unique. One possible argument against a strong wavelength
dependence of
(2.5) and
the rms deviation (0.3%) are greater than in the
wavelength-independent solution (Sect. 4.1). Of course,
there is absolutely no reason why the wavelength dependency of dust
scattering in the circumstellar environment of
NGC 300 OT2008-1 should
be similar to that of the Milky Way. However, this illustrates that
the wavelength-independent solution, although giving the most accurate
reproduction of the data with the minimum number of free parameters,
is not unique. One possible argument against a strong wavelength
dependence of ![]() is that this would imply higher polarization
values in both components. In the example that we have just discussed,
P2 reaches a maximum
polarization of about 5% and P1
is
is that this would imply higher polarization
values in both components. In the example that we have just discussed,
P2 reaches a maximum
polarization of about 5% and P1
is
![]() 4% at
4000 Å. These values are quite high, especially
considering that the solutions are undefined up to an additive
constant and so the derived polarization levels are only lower limits.
4% at
4000 Å. These values are quite high, especially
considering that the solutions are undefined up to an additive
constant and so the derived polarization levels are only lower limits.
![\begin{figure}
\par\includegraphics[width=8cm,clip]{13083f13.eps}
\end{figure}](/articles/aa/full_html/2010/02/aa13083-09/img141.png)
|
Figure 13:
Best-fit solution for 2008 July 8 compared to the observed
Stokes parameters ( lower panel), position
angle ( upper panel), and polarization level (upper
panel). The curves indicate the exponential component |
| Open with DEXTER | |
A detailed treatment of the radiation transfer, including light-travel
effects, multiple scattering, dust properties, and geometrical
distribution (see Patat 2005)
would be required for a
realistic modeling. However, a lower limit to the amount of dust
required to account for the observed level of polarization can be
obtained as follows. We assume that the dust is placed at a distance
r from the supposedly unpolarized source and is
distributed in such
a way that all scattered radiation becomes polarized to the maximum
possible level ![]() (attained for
(attained for ![]() /2 and
/2 and
![]() ;
see White 1979).
Based on this
assumption, if
;
see White 1979).
Based on this
assumption, if ![]() is the flux scattered into the line of
sight and
is the flux scattered into the line of
sight and ![]() is the flux isotropically emitted by the
source, then the observed degree of polarization is given by
is the flux isotropically emitted by the
source, then the observed degree of polarization is given by
where
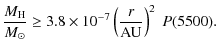
|
For instance, if the scattering material is placed at r = 1000 AU, one needs
The fiducial date of the outburst is assumed to be
April 17, 2008
(Berger et al. 2009),
i.e., 75 days before our first
epoch. This implies that, at the time of our observations, the
expanding radiation front is illuminating dust placed at ![]() 104 AU
perpendicular to the line of sight. The light curve peak has a
width of about 100 days (Bond et al. 2009), so that the
polarized photons that we have detected were scattered in a region
that extends between the dust evaporation boundary and about 104 AU.
Given that at this large distance the incoming flux is a factor of
100 lower than at 1000 AU, the bulk of the polarization
probably comes
from material located closer to the source, between the dust
evaporation radius and a few thousand AU. In this scenario, the
observed decrease in polarization can be understood as being caused by
the expansion of the radiation flash, coupled to the confinement of
dust close to the object and possible inhomogeneities in its
distribution.
104 AU
perpendicular to the line of sight. The light curve peak has a
width of about 100 days (Bond et al. 2009), so that the
polarized photons that we have detected were scattered in a region
that extends between the dust evaporation boundary and about 104 AU.
Given that at this large distance the incoming flux is a factor of
100 lower than at 1000 AU, the bulk of the polarization
probably comes
from material located closer to the source, between the dust
evaporation radius and a few thousand AU. In this scenario, the
observed decrease in polarization can be understood as being caused by
the expansion of the radiation flash, coupled to the confinement of
dust close to the object and possible inhomogeneities in its
distribution.
If the dust is distributed across a sufficiently large
distance from
the outbursting object perpendicular to the line of sight, so that the
scattering material produces a long integration time, then a case B
light echo (Patat et al. 2006)
might become observable as
the transient fades out. Its evolution with time could help us to
better characterize the dust distribution. Unfortunately, the lack of
a scattered light echo detection in the HST images obtained more than
4 months after the outburst (Bond et al. 2009) does not allow
us to place stringent limits on the circumstellar dust distance. The
HST-ACS spatial resolution (50 mas) corresponds to ![]() 105 AU
at
the distance of NGC 300 (1.88 Mpc; Gieren
et al. 2005;
Rizzi
et al. 2006).
Future HST observations might clarify whether
there is circumstellar dust at distances greater than
105 AU
at
the distance of NGC 300 (1.88 Mpc; Gieren
et al. 2005;
Rizzi
et al. 2006).
Future HST observations might clarify whether
there is circumstellar dust at distances greater than ![]() 105 AU
from the outburst site. Incidentally, the absence of a resolved light
echo indicates that the transient must be placed at a significant
distance behind the interstellar dust associated with the local spiral
arm of NGC 300.
105 AU
from the outburst site. Incidentally, the absence of a resolved light
echo indicates that the transient must be placed at a significant
distance behind the interstellar dust associated with the local spiral
arm of NGC 300.
6 Conclusions
We have presented VLT-spectropolarimetry of NGC 300 OT2008-1 obtained 48 and 55 days after its discovery. The continuum polarization is dominated by a component very well aligned along the local spiral arm of NGC 300, which we have interpreted as originating in interstellar dust. The wavelength dependency of the ISP differs substantially from what is typical of the Milky Way. Once the ISP is subtracted, a substantial signal, reaching about 1.2%, is detected. This polarization component is aligned along a completely different position angle.
The simplest explanation of this continuum polarization is electron scattering coupled with a significantly asymmetric photosphere. Nevertheless, the absence of any line depolarization (very common in sources displaying similar levels of polarization) disfavors this scenario and calls for an alternative origin.
Although we have investigated different possible reasons for
the lack
of depolarization, the most viable physical mechanism is scattering by
a circumstellar, asymmetric dust cloud. If this is the correct picture
(also implying that the emitting photosphere does not deviate
significantly from spherical symmetry), this means that a significant
amount of dust (![]() 10
10
![]() )
must be present during the
epochs covered by our observations, either because it has re-condensed
or because it has survived the radiation flash produced by the
outburst.
)
must be present during the
epochs covered by our observations, either because it has re-condensed
or because it has survived the radiation flash produced by the
outburst.
Besides adding to the growing evidence of substantial amounts of circumstellar dust in a completely independent way, our observations provide direct proof that dust is not only present, but that a significant fraction must have an asymmetric geometry. This implies that one or more asymmetric outflow episodes from the progenitor star must have occurred during its past history.
AcknowledgementsThis paper is based on observations made with ESO Telescopes at Paranal Observatory under program ID 281.D-5016. The authors wish to thank ESO's Director General for granting his Discretionary Time to this project. They are also grateful to A. Pastorello and P. Höflich for their kind and competent help, and to H.M. Schmid for the very useful comments provided during the refereeing process.
Appendix A: Effects of second order contamination on spectropolarimetry
The purpose of this Appendix is to evaluate the effect of the second order on spectropolarimetry when no order-sorting filter (hereafter OSF) is used, and to propose a simple technique for its correction.
A.1 Second-order contamination
In general, diffraction-based dispersive elements (such as gratings and
grisms) produce replicas of the first-order (FO) spectrum with
dispersions that increase proportionally to the order number. While
higher orders can usually be neglected, the second-order (SO) spectrum
appears as an additive component superimposed on the red part of the
first order (FO) spectrum, with a dispersion that is ![]() 2 times
that of the first order. In practice, the flux detected at a given
wavelength
2 times
that of the first order. In practice, the flux detected at a given
wavelength ![]() is the sum of the clean spectrum at
is the sum of the clean spectrum at
![]() and a
fraction of the spectrum detected at a bluer
wavelength, which we indicate as
and a
fraction of the spectrum detected at a bluer
wavelength, which we indicate as ![]() .
If
.
If
![]() is the spectrum one would record on the detector in the
absence of SO contamination, the spectrum which is actually observed
is the spectrum one would record on the detector in the
absence of SO contamination, the spectrum which is actually observed
![]() can be modeled as
can be modeled as
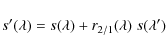
where
where
| |
= | ||
| = |
Since r2/1, as defined in Eq. (A.1), is the ratio of the pure SO flux at
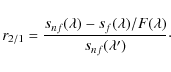
The advantages of this formulation are that it is based on measurable or known quantities and is independent of the detector sensitivity function. It can indeed be easily shown that
In principle, any bright astronomical target with a continuum
spectrum
observed with and without the OSF can be used to derive
![]() .
Nevertheless, because of the lower sensitivity of
detectors in the blue and since the effect that we wish to measure is
produced by blue photons, the most suitable choice is a hot star. For
this reason, and because it is included in the FORS1 calibration plan
(O'Brien 2008),
we selected the D0p spectrophotometric standard
star Feige 110 (
.
Nevertheless, because of the lower sensitivity of
detectors in the blue and since the effect that we wish to measure is
produced by blue photons, the most suitable choice is a hot star. For
this reason, and because it is included in the FORS1 calibration plan
(O'Brien 2008),
we selected the D0p spectrophotometric standard
star Feige 110 (
![]() :19:58.4,
:19:58.4,
![]() :09:55.8),
which has a very blue (
B-V
= - 0.30)
and featureless spectrum (Hamuy et al. 1992,
1994). The
FORS1 archival data that we selected were
obtained on 2008 October 12 with the grism
300 V, with and without the
OSF GG435, which has a cutoff wavelength
:09:55.8),
which has a very blue (
B-V
= - 0.30)
and featureless spectrum (Hamuy et al. 1992,
1994). The
FORS1 archival data that we selected were
obtained on 2008 October 12 with the grism
300 V, with and without the
OSF GG435, which has a cutoff wavelength ![]() Å.
As
for the filter transmission curve, we used the tabulated data provided
by the Observatory
Å.
As
for the filter transmission curve, we used the tabulated data provided
by the Observatory![]() .
One needs to mention that the GG435 OSF does not prevent a
small portion of the SO being produced in the red edge of the spectrum.
Its blue cut-off corresponds to a SO wavelength of
.
One needs to mention that the GG435 OSF does not prevent a
small portion of the SO being produced in the red edge of the spectrum.
Its blue cut-off corresponds to a SO wavelength of ![]() 8500 Å,
so that redward of this value a contribution from photons bluer than
4350 Å is still present. This makes the derivation of
8500 Å,
so that redward of this value a contribution from photons bluer than
4350 Å is still present. This makes the derivation of ![]() uncertain between 8500 Å and the red edge of the
spectral range covered by the detector.
uncertain between 8500 Å and the red edge of the
spectral range covered by the detector.
![\begin{figure}
\par\includegraphics[width=8.4cm,clip]{13083f14.eps}
\end{figure}](/articles/aa/full_html/2010/02/aa13083-09/img180.png)
|
Figure A.1:
Ratio between observed SO and FO as a function of wavelength derived
for the 300V grism mounted in FORS1. The upper
scale indicates the corresponding FO wavelength
|
| Open with DEXTER | |
![\begin{figure}
\par\includegraphics[width=90mm,clip]{13083f15.eps}
\end{figure}](/articles/aa/full_html/2010/02/aa13083-09/img181.png)
|
Figure A.2:
Lower panel: comparison between the observed
spectrum of the OT in NGC 300 (dotted line) and the corrected
spectrum
(solid line). The dashed line traces the |
| Open with DEXTER | |
After wavelength calibration, we extracted the two spectra and
applied Eq. (A.3)
to derive ![]() .
The
result is presented in Fig. A.1. This figure
shows that the
second-order contamination can be significant for very blue targets:
for instance, the SO contamination at 6500 Å is
about 35% of the
flux detected at 3380 Å. Clearly, the exact amount of
contamination
depends on the input spectrum, which is in principle
unknown. Nevertheless, one must notice that for the SO contamination
only the knowledge of the blue part of the spectrum is needed, where
the observed and the uncontaminated spectrum are identical
(
.
The
result is presented in Fig. A.1. This figure
shows that the
second-order contamination can be significant for very blue targets:
for instance, the SO contamination at 6500 Å is
about 35% of the
flux detected at 3380 Å. Clearly, the exact amount of
contamination
depends on the input spectrum, which is in principle
unknown. Nevertheless, one must notice that for the SO contamination
only the knowledge of the blue part of the spectrum is needed, where
the observed and the uncontaminated spectrum are identical
(
![]() ).
The SO begins to contaminate
the spectrum at a wavelength
).
The SO begins to contaminate
the spectrum at a wavelength ![]() which corresponds to the
detector blue cut-off wavelength
which corresponds to the
detector blue cut-off wavelength ![]() .
For FORS1, it is
.
For FORS1, it is
![]() Å, which, according
to Eq. (A.2),
corresponds to
Å, which, according
to Eq. (A.2),
corresponds to ![]() Å.
Below this wavelength, the SO can
be considered negligible and so one can set
Å.
Below this wavelength, the SO can
be considered negligible and so one can set ![]() for
for
![]() .
.
Therefore, knowing ![]() one can recover the uncontaminated
spectrum by simply inverting Eq. (A.1) and using
Eq. (A.2),
e.g.,
one can recover the uncontaminated
spectrum by simply inverting Eq. (A.1) and using
Eq. (A.2),
e.g.,
A way of expressing the severity of the SO contamination is to normalize its absolute amount to the flux at any given wavelength, by introducing the quantity
which is the fraction of the observed flux produced by the SO.
The application of this method to the data discussed in this
paper is
illustrated in Fig. A.2.
To avoid introducing additional
noise, we replaced the computed ![]() with a fifth
order polynomial fit to the data (solid curve in
Fig. A.1).
For our object, the contamination reaches a
maximum relative value of about
with a fifth
order polynomial fit to the data (solid curve in
Fig. A.1).
For our object, the contamination reaches a
maximum relative value of about ![]() at about 8000 Å which,
for most purposes is negligible, being smaller than the typical
accuracy one can achieve in the flux calibration.
at about 8000 Å which,
for most purposes is negligible, being smaller than the typical
accuracy one can achieve in the flux calibration.
Nevertheless, since polarimetry is in most cases dealing with flux differences of a few percent, the impact of SO contamination needs to be evaluated.
A.2 Effects on spectropolarimetry
In dual-beam instruments such as FORS1, spectropolarimetry is performed
by evaluating the so-called normalized flux ratios ![]() ,
derived
from the ordinary and extraordinary beams produced in the same frame
by the Wollaston prism (see Patat & Romaniello 2006, for a
general introduction). For the canonical HWP position angles
,
derived
from the ordinary and extraordinary beams produced in the same frame
by the Wollaston prism (see Patat & Romaniello 2006, for a
general introduction). For the canonical HWP position angles
![]() (where i = 0, 1, 2, 3) and for an ideal
polarimeter, these ratios are directly related to the Stokes
parameters: F0 = Q,
F1 = U, F2
= - Q, and F3=-U.
Since the
observed fluxes in the ordinary (
(where i = 0, 1, 2, 3) and for an ideal
polarimeter, these ratios are directly related to the Stokes
parameters: F0 = Q,
F1 = U, F2
= - Q, and F3=-U.
Since the
observed fluxes in the ordinary (
![]() )
and extraordinary
(
)
and extraordinary
(
![]() )
beams can be modeled with Eq. (A.1), the
observed normalized ratios
)
beams can be modeled with Eq. (A.1), the
observed normalized ratios
|
after some manipulation can be expressed as
where we have defined
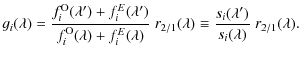
|
Equation (A.6) shows that, in general, the effect of SO contamination on the final polarization is not obvious, since it depends on the exact spectral energy distribution and polarization of the source. However, when the SO contamination is moderate (
In our case, where
Appendix B: The effect of multiple weak polarizers
In general, if ![]() is the Stokes vector that
defines the polarization status of an incoming beam, its passage
through an optical system can be described by
is the Stokes vector that
defines the polarization status of an incoming beam, its passage
through an optical system can be described by ![]() ,
where
,
where ![]() is the emerging Stokes vector and
is the emerging Stokes vector and
![]() is the
Mueller matrix that characterizes the system
(Chandrasekhar 1950).
To a first approximation, a dust cloud
can be treated as a partial polarizer. The Mueller matrix for a
non-birefringent, non-scattering, partial polarizer with horizontal
transmission axis (
is the
Mueller matrix that characterizes the system
(Chandrasekhar 1950).
To a first approximation, a dust cloud
can be treated as a partial polarizer. The Mueller matrix for a
non-birefringent, non-scattering, partial polarizer with horizontal
transmission axis (
![]() )
is given by the expression
)
is given by the expression
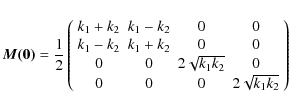
where k1 and k2 (
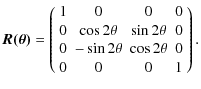
After defining
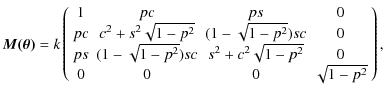
where
Using the above matrix, one can compute the resulting Stokes
vector to be
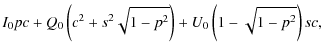
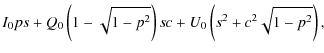
If the incoming beam is unpolarized, the resulting Stokes vector is
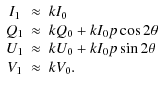
Therefore, in the case of weak linear polarization, the output normalized Stokes parameters are simply given by
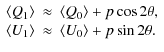
This implies that the effect of multiple weak polarizers (such as several dust clouds) can be described as a sum of terms, each characterized by a polarization pi and a position angle
An interesting consequence follows from this conclusion. If we
express
the polarization wavelength dependency as ![]() and we imagine a beam of unpolarized light passing through
a system of interstellar clouds of various
and we imagine a beam of unpolarized light passing through
a system of interstellar clouds of various ![]() and
and ![]() (with
(with ![]() ),
then the resulting normalized Stokes
parameters are
),
then the resulting normalized Stokes
parameters are
| |
= | ||
| = |
Therefore, if the dust in the various clouds produces linear polarization with the same wavelength dependency (i.e., dust properties are common to all clouds), then the resulting polarization position angle
On the other hand, if the different clouds produce
polarizations that
do not obey the same law
![]() ,
then the resulting
polarization position angle
,
then the resulting
polarization position angle ![]() will be wavelength-dependent. Once plotted on the Q,U
plane, the polarization data will not lie on a straight line passing
through the origin and will possibly extend over different quadrants.
will be wavelength-dependent. Once plotted on the Q,U
plane, the polarization data will not lie on a straight line passing
through the origin and will possibly extend over different quadrants.
An example of a system consisting of two clouds both obeying
the
empirical Serkowski law (Serkowski et al. 1975), with
two different values of the polarization peak wavelength
![]() is shown in Fig. B.1.
is shown in Fig. B.1.
![\begin{figure}
\par\includegraphics[width=9cm,clip]{13083f16.eps}
\end{figure}](/articles/aa/full_html/2010/02/aa13083-09/img239.png)
|
Figure B.1:
Example composition of two Serkowski laws:
|
| Open with DEXTER | |
References
- Appenzeller, I., Fricke, K., Fürtig, W., et al. 1998, The Messenger, 94, 1 [NASA ADS] [Google Scholar]
- Berger, E., & Sodergerg, A., 2008, A.Tel., 1544 [Google Scholar]
- Berger, E., Soderberg, A. M., Chevalier, R. A., et al. 2009, ApJ, 699, 1850 [NASA ADS] [CrossRef] [Google Scholar]
- Bjorkman, K. S., Johansen, K. A., Nordsieck, K. H., Gallager, J. S., & Barger, A. J. 1994, ApJ, 425, 247 [NASA ADS] [CrossRef] [Google Scholar]
- Bond, H. E., Walter, F. M., & Velasquez, J., 2008, IAU Circ. n. 8946 [Google Scholar]
- Bond, H. E., Bedin, L. R., Bonanos, A. Z., et al. 2009, ApJ, 695, L154 [NASA ADS] [CrossRef] [Google Scholar]
- Botticella, M. T., Pastorello, A., Smartt, S. J., et al. 2009, MNRAS, 398, 1041 [NASA ADS] [CrossRef] [Google Scholar]
- Brown, J. C., & McLean, I. S. 1977, A&A, 57, 141 [Google Scholar]
- Chandrasekhar, S. 1950, Radiative Transfer (Oxford: Oxford University Press) [Google Scholar]
- Clarke, D., & McLean, I. S. 1974, MNRAS, 167, 27 [Google Scholar]
- Cropper, M., Bailey, J., McCowage, J., Cannon, R. D., & Couch, W. J. 1988, MNRAS, 231, 695 [NASA ADS] [Google Scholar]
- Draine, B. T. 2003a, ARA&A, 41, 241 [Google Scholar]
- Draine, B. T. 2003b, ApJ, 598, 1017 [NASA ADS] [CrossRef] [Google Scholar]
- Gieren, W., Pietrzynski, G., Soszynski, I., et al. 2005, ApJ, 628, 695 [NASA ADS] [CrossRef] [Google Scholar]
- Gogarten, S. M., Dalcanton, J. J., Murphy, J. W. 2009, ApJ, 703, 300 [NASA ADS] [CrossRef] [Google Scholar]
- Hamuy, M., Walker, A. R., & Suntzeff, N. B. 1992, PASP, 104, 533 [NASA ADS] [CrossRef] [Google Scholar]
- Hamuy, M., Suntzeff, N. B., Heathcote, S. R., et al. 1994, PASP, 106, 566 [NASA ADS] [CrossRef] [Google Scholar]
- Harrington, J. P., & Collins, G. Q. 1968, ApJ, 151, 1051 [NASA ADS] [CrossRef] [Google Scholar]
- Heiles, C. 1999, AJ, 119, 923 [Google Scholar]
- Henyey, L. C., & Greenstein, J. L. 1941, AJ, 93, 70 [Google Scholar]
- Höflich, P. 1991, A&A, 246, 481 [Google Scholar]
- Hoffman, J. L., Leonard, D. C., Chornock, R., et al. 2008, ApJ, 688, 1186 [NASA ADS] [CrossRef] [Google Scholar]
- Jones, T. J., Humphreys, R. M., Gehrz, R. D., et al. 1993, ApJ, 411, 323 [NASA ADS] [CrossRef] [Google Scholar]
- Kawabata, K. S., Hirata, R., Ikeda, Y., et al. 2000, ApJ, 540, 429 [NASA ADS] [CrossRef] [Google Scholar]
- Kawabata, K. S., Ohyama, Y., Ebizuka, N., et al., 2006, AJ, 132, 433 [NASA ADS] [CrossRef] [Google Scholar]
- Keller, C. U. 2002, in Astrophysical Spectropolarimetry (Cambridge: Cambridge Univ. Press), 303 [Google Scholar]
- Kulkarni, S. R., Ofek, E. O., Rau, A., et al. 2007, ApJ, 447, 458 [Google Scholar]
- Leonard, D. C., & Filippenko, A. V. 2001, PASP, 113, 920 [Google Scholar]
- Leonard, D. C., Filippenko, A. V., Chornock, R., et al. 2002, ApJ, 124, 2506 [Google Scholar]
- Li, A., & Draine, B. T. 2001, ApJ, 554, 778 [Google Scholar]
- Matsuura, M., Barlow, M. J., Zijlstra, A. A., et al. 2009, MNRAS, 396, 918 [NASA ADS] [CrossRef] [Google Scholar]
- Maund, J. 2008, A&A, 481, 913 [Google Scholar]
- Maund, J. R., Smartt, S. J., Kudritzki, R.-P., et al. 2006, MNRAS, 369, 390 [NASA ADS] [CrossRef] [Google Scholar]
- Maund, J. R., Wheeler, J. C., Patat, F., et al. 2007, MNRAS, 381, 201 [NASA ADS] [CrossRef] [Google Scholar]
- McLean, I. S., & Clarke, D. 1979, MNRAS, 186, 245 [Google Scholar]
- Monard, L. A. G. 2008, IAU Circ. n. 8946 [Google Scholar]
- O'Brien, K. 2008, FORS1+2 User's Manual, VLT-MAN-ESO-13100-1543, Issue 82.1 [Google Scholar]
- Ofek, E. O., Kulkarni, S. R., Rau, A., et al. 2008, ApJ, 674, 447 [NASA ADS] [CrossRef] [Google Scholar]
- Pastorello, A., Smartt, S. J., Mattila, S., et al. 2007a, Nature, 447, 829 [NASA ADS] [CrossRef] [PubMed] [Google Scholar]
- Pastorello, A., Della Valle, M., Smartt, S. J., et al. 2007b, Nature, 449, 1 [Google Scholar]
- Patat, F. 2005, MNRAS, 357, 1161 [NASA ADS] [CrossRef] [Google Scholar]
- Patat, F., & Romaniello, M. 2006, PASP, 118, 146 [NASA ADS] [CrossRef] [Google Scholar]
- Patat, F., Benetti, S., Cappellaro, E., et al. 2006, MNRAS, 369, 1949 [NASA ADS] [CrossRef] [Google Scholar]
- Patat, F., Baade, D., Höflich, P., et al. 2009, A&A, 508, 229 [Google Scholar]
- Patel, M., Oudmaijer, R. D., Vink, J. S., et al. 2008, MNRAS, 385, 967 [NASA ADS] [CrossRef] [Google Scholar]
- Prieto, J. L. 2008, A. Tel., n. 1596 [Google Scholar]
- Prieto, J. L., Kistler, M. D., Thompson, T., et al. 2008, ApJ, 681, L9 [NASA ADS] [CrossRef] [Google Scholar]
- Prieto, J. L., Sellgren, K., Thompson, T. A., et al. 2009, ApJ, 705, 1425 [NASA ADS] [CrossRef] [Google Scholar]
- Pumo, M. L., Turatto, M., Botticella, M. T., et al. 2009, ApJ, 705, 138 [Google Scholar]
- Quirrenbach, A., Bjorkman, K. S., Bjorkman, J., et al. 1997, ApJ, 479, 477 [NASA ADS] [CrossRef] [Google Scholar]
- Rau, A., Ofek, E. O., Kulkarni, S. R., et al. 2008, ApJ, 682, 1205 [NASA ADS] [CrossRef] [Google Scholar]
- Rizzi, L., Bresolin, F., Kudritzki, R. P., Gieren, W., & Pietrzynsky, G. 2006, ApJ, 638, 766 [NASA ADS] [CrossRef] [Google Scholar]
- Roussel, H., Gil de Paz, A., Seibert, M., et al. 2005, ApJ, 632, 227 [NASA ADS] [CrossRef] [Google Scholar]
- Scarrot, S. M., Ward-Thompson, D., & Warren-Smith, R. F. 1987, MNRAS, 224, 299 [NASA ADS] [CrossRef] [Google Scholar]
- Serkowski, K., Matheson, D. S., & Ford, V. L. 1975, ApJ, 196, 261 [NASA ADS] [CrossRef] [Google Scholar]
- Schlegel, D. J., Finkbeiner, D. P., & Davis, M. 1998, ApJ, 500, 525 [NASA ADS] [CrossRef] [Google Scholar]
- Smith, N., Ganeshalingam, M., Chornock, R., et al. 2009, ApJ, 697, L49 [NASA ADS] [CrossRef] [Google Scholar]
- Thompson, T. A., Prieto, J. L., Stanek, K. Z., et al. 2009, ApJ, 705, 1364 [NASA ADS] [CrossRef] [Google Scholar]
- van den Hulst, H. C. 1957, Light Scattering by Small Particles (New York: Wiley & Sons) [Google Scholar]
- Van Dyk, S. D., et al. 2000, PASP, 117, 553 [Google Scholar]
- Wang, L., et al. 2004, ApJ, 591, 1110 [Google Scholar]
- Wesson, R., Barlow, M. J., Ercolano, B., et al. 2009, MNRAS, submitted [arXiv:0907:0246v1] [Google Scholar]
- White, R. L. 1979, ApJ, 229, 954 [NASA ADS] [CrossRef] [Google Scholar]
- Whittet, D. C. B., Martin, P. G., Hough, J. H., et al. 1992, ApJ, 386, 562 [NASA ADS] [CrossRef] [Google Scholar]
- Wisniewski, J. P., Morrison, N. D., Bjorkman, K. S., et al. 2003, ApJ, 588, 486 [NASA ADS] [CrossRef] [Google Scholar]
Footnotes
- ... dust
- Based on observations made with ESO Telescopes at Paranal Observatory under Program ID 281.D-5016.
- ... IRAF
- IRAF is distributed by the National Optical Astronomy Observatories, which are operated by the Association of Universities for Research in Astronomy, under contract with the National Science Foundation.
- ... axis
- In the weak polarization approximation the components are vectorially additive. See Appendix B.
- ...
NGC 300
- http://vizier.cfa.harvard.edu/viz-bin/VizieR?-source=II/226
- ... wavelength
- Note that this is a pure shift of Q and U that does not modify their shape.
- ... approximation
- If the dust optical depth is high, then multiple scattering becomes important and acts as a depolarizer. See for instance Patat (2005).
- ... mixtures
- Wesson et al. (2009) have shown that the dust around SN 2008S most likely consists of carbon grains. The usage of a carbonaceous-silicate mixture here is just illustrative.
- ... 100 AU
- Prieto et al. (2009) set the outer boundary of
dust evaporation for NGC 300 OT2008-1 to be 100 AU, while for
SN 2008S Botticella et al. (2009) obtained a significantly
larger value (
 2000 AU).
- ... Observatory
- http://www.eso.org/sci/facilities/paranal/instruments/fors/inst/Filters/
- ... additive
- The demonstration can be easily extended to the most general form of the Mueller matrix that describes the polarizer.
All Tables
Table 1: Log of the VLT-FORS1 observations of NGC 300 OT2008-1.
Table 2: Dominant axis least squares fit parameters.
Table 3: Minimum polarization solutions for the two epochs.
Table 4: Synthetic broadband polarimetry of NGC 300 OT2008-1.
All Figures
|
|
Figure 1: Flux spectra of NGC 300 OT2008-1 on 2008 July 1 ( upper) and 2008 July 8 ( lower). For presentation, the spectrum of the second epoch was shifted by -0.4. The main spectral features are identified. |
| Open with DEXTER | |
| In the text | |
|
|
Figure 2:
Observed spectropolarimetry of NGC 300 OT2008-1 at
the two epochs on the Stokes Q-U
plane. For presentation, the data were binned to 16 pixels
(57 Å). The dotted circles are placed at constant polarization
levels (0.5, 1.0, 1.5, and 2.0%). The dashed line is a weighted least
squares fit to the data in the displayed wavelength range. For
comparison, the colored line sequence of dots in the upper left
quadrant traces a Serkowski law (Serkowski et al. 1975) for |
| Open with DEXTER | |
| In the text | |
|
|
Figure 3:
Differences in Q ( upper panel)
and U ( lower panel) Stokes
parameters between the two epochs (second minus
first). Empty symbols indicate the data points rejected by the
k- |
| Open with DEXTER | |
| In the text | |
|
|
Figure 4:
A DSS image of NGC 300. The location of the optical transient
is marked by a cross. The arrow indicates the polarization position
angle of the dominant axis (the average of the values measured during
the two epochs was used: |
| Open with DEXTER | |
| In the text | |
|
|
Figure 5: Minimum polarization solution for 2008 July 8. The dashed line traces the observed dominant axis, while the point (Q1,U1) indicates the wavelength-independent component. The empty circles mark the rejected data points. |
| Open with DEXTER | |
| In the text | |
|
|
Figure 6:
Dominant ( upper panel) and orthogonal (
lower panel) polarization on 2008 July 1 after
subtracting the
wavelength-independent component |
| Open with DEXTER | |
| In the text | |
|
|
Figure 7: Same as Fig. 6 for 2008 July 8. |
| Open with DEXTER | |
| In the text | |
|
|
Figure 8:
Best fit solution for 2008 July 8 compared to the observed
Stokes parameters ( lower panel), position
angle ( upper panel) and polarization level (upper
panel). The curves trace the wavelength-independent component |
| Open with DEXTER | |
| In the text | |
|
|
Figure 9:
Spectropolarimetry of the H |
| Open with DEXTER | |
| In the text | |
|
|
Figure 10: Expected polarization wavelength dependence of a Milky Way carbonaceous-silicate dust mixture in a single-scattering approximation for RV = 5.5 ( upper panel) and RV = 3.1 ( lower panel) and two different scattering angles. Dust model is from Li & Draine (2001) and Draine (2003b). |
| Open with DEXTER | |
| In the text | |
|
|
Figure 11:
Minimum polarization solution with an
exponential polarization |
| Open with DEXTER | |
| In the text | |
|
|
Figure 12:
Dominant ( upper panel) and orthogonal (
lower panel) polarization on 2008 July 8 after
subtracting the
exponential component |
| Open with DEXTER | |
| In the text | |
|
|
Figure 13:
Best-fit solution for 2008 July 8 compared to the observed
Stokes parameters ( lower panel), position
angle ( upper panel), and polarization level (upper
panel). The curves indicate the exponential component |
| Open with DEXTER | |
| In the text | |
|
|
Figure A.1:
Ratio between observed SO and FO as a function of wavelength derived
for the 300V grism mounted in FORS1. The upper
scale indicates the corresponding FO wavelength
|
| Open with DEXTER | |
| In the text | |
|
|
Figure A.2:
Lower panel: comparison between the observed
spectrum of the OT in NGC 300 (dotted line) and the corrected
spectrum
(solid line). The dashed line traces the |
| Open with DEXTER | |
| In the text | |
|
|
Figure B.1:
Example composition of two Serkowski laws:
|
| Open with DEXTER | |
| In the text | |
Copyright ESO 2010
Current usage metrics show cumulative count of Article Views (full-text article views including HTML views, PDF and ePub downloads, according to the available data) and Abstracts Views on Vision4Press platform.
Data correspond to usage on the plateform after 2015. The current usage metrics is available 48-96 hours after online publication and is updated daily on week days.
Initial download of the metrics may take a while.