| Issue |
A&A
Volume 510, February 2010
|
|
|---|---|---|
| Article Number | A48 | |
| Number of page(s) | 20 | |
| Section | Catalogs and data | |
| DOI | https://doi.org/10.1051/0004-6361/200811184 | |
| Published online | 05 February 2010 | |
The Palermo Swift-BAT hard X-ray catalogue
II. Results after 39 months of sky survey![[*]](/icons/foot_motif.png)
G. Cusumano1 - V. La Parola1 - A. Segreto1 - V. Mangano1 - C. Ferrigno1,2,3 - A. Maselli1 - P. Romano1 - T. Mineo1 - B. Sbarufatti1 - S. Campana4 - G. Chincarini5,4 - P. Giommi6 - N. Masetti7 - A. Moretti4 - G. Tagliaferri4
1 - INAF, Istituto di Astrofisica Spaziale e Fisica Cosmica di Palermo,
via U. La Malfa 153, 90146 Palermo, Italy
2 - Institut für Astronomie und Astrophysik Tübingen (IAAT), Germany
3 - ISDC Data Centre for Astrophysics, Chemin d'Écogia 16, 1290
Versoix, Switzerland
4 - INAF - Osservatorio Astronomico di Brera, via Bianchi 46, 23807
Merate, Italy
5 - Università degli studi di Milano-Bicocca, Dipartimento di Fisica,
Piazza delle Scienze 3, 20126 Milan, Italy
6 - ASI Science Data Center, via Galileo Galilei, 00044 Frascati, Italy
7 - INAF, Istituto di Astrofisica Spaziale e Fisica Cosmica di Bologna,
via Gobetti 101, 40129 Bologna, Italy
Received 17 October 2008 / Accepted 23 June 2009
Abstract
Aims. We present the Palermo Swift-BAT
hard X-ray catalogue obtained from the analysis of data acquired during
the first 39 months of the Swift mission.
Methods. We developed a dedicated software to
perform the data reduction, mosaicking, and source detection of the
BAT survey data. We analyzed the BAT dataset in three
energy bands (14-150 keV, 14-30 keV,
14-70 keV), obtaining a list of 962 detections above
a significance threshold of 4.8 standard deviations. The
identification of the source counterparts was pursued using three
strategies: cross-correlation with published hard X-ray catalogues,
analysis of field observations of soft X-ray instruments, and
cross-correlation with SIMBAD databases.
Results. The survey covers 90% of the sky down to a
flux limit of 2.5 ![]() 10-11 erg cm-2 s-1
and 50% of the sky down to a flux limit of 1.8
10-11 erg cm-2 s-1
and 50% of the sky down to a flux limit of 1.8 ![]() 10-11 erg cm-2 s-1
in the 14-150 keV band. We derived a catalogue of 754
identified sources, of which
10-11 erg cm-2 s-1
in the 14-150 keV band. We derived a catalogue of 754
identified sources, of which ![]() % are extragalactic,
% are extragalactic, ![]() % are
Galactic objects, and
% are
Galactic objects, and ![]() %
are already known X-ray or gamma ray emitters, whose nature
has yet to be determined. The integrated flux of the extragalactic
sample is
%
are already known X-ray or gamma ray emitters, whose nature
has yet to be determined. The integrated flux of the extragalactic
sample is ![]() of the cosmic X-ray background in the 14-150 keV range.
of the cosmic X-ray background in the 14-150 keV range.
Key words: X-rays: general - catalogs - surveys
1 Introduction
The study of Galactic and extragalactic sources at energies greater
than 10 keV is fundamental to both the investigation of non
thermal emission processes and to the study of source populations that
are not detectable in the soft X-ray energy band because their emission
is strongly absorbed by a thick column of gas or dust. Another major
aim of deep and sensitive surveys in the hard X-ray domain is to
resolve the diffuse X-ray background (CXB) and identify which class of
sources represents the most significant contribution: while the CXB at
energies lower than 10 keV has been almost entirely resolved
(80-90%, Moretti
et al. 2003; Worsley et al. 2006; Brandt &
Hasinger 2005; Worsley et al. 2005),
only ![]() 1.5% of the
CXB at higher energies can be associated with resolved sources
(Ajello et al. 2008b).
1.5% of the
CXB at higher energies can be associated with resolved sources
(Ajello et al. 2008b).
Until now, the observation of the hard X-ray sky has not been
performed with imaging grazing incidence telescopes because the
reflectivity above 10 keV rapidly declines because of the
steep decrease in the critical angle with energy. The first surveys in
the hard X-ray domain were performed with detectors equipped with
collimator-limited field of view: UHURU (2-20 keV; Forman et al. 1978) and
HEAO1 (0.2 keV-10 MeV; Wood
et al. 1984). Later, sky images for energies greater
than 10 keV were produced using coded mask detectors (e.g., Fenimore & Cannon 1978;
Skinner et al. 1987a):
in these detectors the entrance window of the telescope is partially
masked and the ``shadows'' of the cosmic sources are projected onto a
position-sensitive detector. Dedicated algorithms are then used to
reconstruct the position and intensity of the sources in the field of
view and, therefore, reproduce the image of the observed sky.
In the last two decades, space observatories equipped with
this type of telescopes have surveyed the sky reporting detections of
numerous sources emitting in the hard X-ray domain: Spacelab/XRT (Skinner et al. 1987b),
MIR/KVANT/TTM (Sunyaev et al.
1991), GRANAT/ART-P (Pavlinsky et al. 1994,1992),
GRANAT/SIGMA (Cordier
et al. 1991; Sunyaev et al. 1991), and BeppoSAX/WFC
(Jager et al. 1997).
Today, the IBIS-ISGRI camera (Lebrun et al. 2003; Ubertini
et al. 2003) on the INTEGRAL observatory (Winkler et al. 2003)
with its field of view of ![]()
![]()
![]() (fully coded)
is carrying out a hard X-ray survey focussing mostly on the
Galactic plane in the 20-150 keV energy band with a
sensitivity higher than previous observatories. The main results of
this survey and the relevant source catalogues are reported in several
papers (e.g. Sazonov
et al. 2007; Bird et al. 2007,2004; Krivonos
et al. 2007; Bird et al. 2006; Churazov
et al. 2007; Bassani et al. 2006; Krivonos
et al. 2005).
(fully coded)
is carrying out a hard X-ray survey focussing mostly on the
Galactic plane in the 20-150 keV energy band with a
sensitivity higher than previous observatories. The main results of
this survey and the relevant source catalogues are reported in several
papers (e.g. Sazonov
et al. 2007; Bird et al. 2007,2004; Krivonos
et al. 2007; Bird et al. 2006; Churazov
et al. 2007; Bassani et al. 2006; Krivonos
et al. 2005).
The Burst Alert Telescope (BAT; Barthelmy
et al. 2005) onboard the Swift
observatory (Gehrels et al. 2004),
because of its large field of view (
![]()
![]()
![]() half coded) and large detector area (a factor of
2 greater than ISGRI), offers the opportunity to significantly
increase the number of detections contributing to the luminosity of the
sky in the hard X-rays allowing a substantial improvement of our
knowledge of the AGN and of the cosmic hard X-ray background.
The first results on the BAT survey have been presented in Markwardt et al. (2005),
Ajello
et al. (2008b,a), and Tueller
et al. (2008). The latter presents a catalogue of
sources detected in the first 9 months of the
BAT survey data, identifying 154 extragalactic
sources (129 at
half coded) and large detector area (a factor of
2 greater than ISGRI), offers the opportunity to significantly
increase the number of detections contributing to the luminosity of the
sky in the hard X-rays allowing a substantial improvement of our
knowledge of the AGN and of the cosmic hard X-ray background.
The first results on the BAT survey have been presented in Markwardt et al. (2005),
Ajello
et al. (2008b,a), and Tueller
et al. (2008). The latter presents a catalogue of
sources detected in the first 9 months of the
BAT survey data, identifying 154 extragalactic
sources (129 at ![]() ).
).
To take full advantage of the BAT survey archive, we developed
the dedicated software B ATI MAGER
(Segreto et al. 2010),
which is independent from the software developed by the Swift-BAT team![]() . In this paper,
we present the results obtained from the analysis of 39 months
of BAT sky survey. The paper is organized
as follows: in Sect. 2, we describe the
BAT telescope; in Sect. 3, we describe
the data set and screening criteria; in Sect. 4, we present a
brief
description of the code used for the analysis and illustrate our
analysis strategy. In Sect. 5, we describe the
survey properties. The catalogue construction and the results are
reported in Sect. 6.
The last section summarizes our results. The spectral properties of our
extragalactic sample will be discussed in a forthcoming paper (La
Parola et al. 2010, in preparation).
. In this paper,
we present the results obtained from the analysis of 39 months
of BAT sky survey. The paper is organized
as follows: in Sect. 2, we describe the
BAT telescope; in Sect. 3, we describe
the data set and screening criteria; in Sect. 4, we present a
brief
description of the code used for the analysis and illustrate our
analysis strategy. In Sect. 5, we describe the
survey properties. The catalogue construction and the results are
reported in Sect. 6.
The last section summarizes our results. The spectral properties of our
extragalactic sample will be discussed in a forthcoming paper (La
Parola et al. 2010, in preparation).
The cosmology adopted in this work assumes H0=70 km s-1 Mpc-1,
k=0, ![]() ,
and
,
and ![]() .
Quoted errors are at
.
Quoted errors are at ![]() confidence level,
unless stated otherwise.
confidence level,
unless stated otherwise.
2 The BAT telescope
The BAT, one of the three instruments onboard the Swift
observatory, is a coded aperture imaging camera consisting of
a 5200 cm2 array of 4 ![]() 4 mm2 CdZnTe elements mounted
on a plane 1 m behind a 2.7 m2
coded aperture mask of 5
4 mm2 CdZnTe elements mounted
on a plane 1 m behind a 2.7 m2
coded aperture mask of 5 ![]() 5 mm2 elements distributed with a
pseudo-random pattern. The telescope, which operates in the
14-150 keV energy range, has a
large field of view (1.4 steradian half coded), and a point
spread function (PSF) of 17 arcmin, and is devoted mainly to
the monitoring of a large fraction of the sky for the occurrence of
gamma ray bursts (GRBs). The BAT can measure their position
with the accuracy (1-4 arcmin) that is necessary to slew the
spacecraft towards a GRB position and bring the burst location inside
the field of view of the narrow field instruments in a couple of
minutes. While waiting for new GRBs, it continuously collects
spectral and imaging information in survey mode, covering a fraction of
between 50% and 80% of the sky every day. The data
are immediately made available to the scientific community through the
public Swift data archive
5 mm2 elements distributed with a
pseudo-random pattern. The telescope, which operates in the
14-150 keV energy range, has a
large field of view (1.4 steradian half coded), and a point
spread function (PSF) of 17 arcmin, and is devoted mainly to
the monitoring of a large fraction of the sky for the occurrence of
gamma ray bursts (GRBs). The BAT can measure their position
with the accuracy (1-4 arcmin) that is necessary to slew the
spacecraft towards a GRB position and bring the burst location inside
the field of view of the narrow field instruments in a couple of
minutes. While waiting for new GRBs, it continuously collects
spectral and imaging information in survey mode, covering a fraction of
between 50% and 80% of the sky every day. The data
are immediately made available to the scientific community through the
public Swift data archive ![]() .
.
3 Survey data set and screening criteria
We analyzed the first 39 months of the BAT survey data archive, from 2004 December to the end of 2008 February. The BAT survey data are in the form of detector plane histograms (DPH). These are three dimensional arrays (two spatial dimensions, one spectral dimension) that collect count-rate data in (typically) 5-m time bins for 80 energy channels.
The data were retrieved from the Swift public archive and screened out from bad quality files, excluding those files where the spacescraft attitude was unstable (i.e., with a significant variation in the pointing coordinates). The resulting dataset was pre-analyzed (see Sect. 4), to produce preliminary Detector Plane Images (DPI, obtained integrating the DPH along the spectral dimension) from where the bright sources (S/N > 8) and background were subtracted; very noisy DPHs, i.e., with a standard deviation significantly larger than the average value where subtracted. The list of bright sources detected in each DPH was used to identify and discard the files suffering from inaccurate position reconstruction. After cross-correlating the position of these sources with the ISGRI catalogue, the GRB positions, and the newly discovered Swift sources documented in literature (Tueller et al. 2008; Markwardt et al. 2005; Ajello et al. 2008a), we discarded the files where:
- the bright sources in the BAT field of view are detected more than 10 arcmin from their counterpart position (because of a star tracker loss of lock);
- the reconstructed image of at least one bright source has a strongly elongated shape (maybe due to an unrecognized slew).
4 Methodology
To perform a systematic and efficient search for new hard X-ray sources, we developed the B ATI MAGER, a dedicated software that produces an all-sky mosaic directly from a list of BAT data files. A complete and detailed description of the software and its performance is presented in Segreto et al. (2010). Here we report only the details of the procedure which are relevant to this work.
4.1 The code
The B ATI MAGER integrates each single DPH in a selected energy range, producing the corresponding DPI. A preliminary cleaning of the disabled and noisy pixels is performed, and the DPI is cross-correlated with the mask pattern, to identify and subtract bright sources (with S/N > 8). The background, modelled on a large scale from the analysis of the shadowgram residuals by performing a Principal Component Analysis (Kendall 1980), is then subtracted. A further search for bad pixels is performed, to obtain the final map of all pixels to be excluded in the following steps. A further correction is applied to take into account differences in the detection efficiency of single detector pixels, by means of a time/energy dependent efficiency map, built by stacking all the processed DPI and equalizing the average residual contribution for each pixel. The original DPI, corrected for the efficiency map and cleaned for bad pixels, is processed again, with all the contributions from the background and the bright sources identified in the previous steps computed simultaneously, to correct for cross-contamination effects. These contributions are subtracted from the DPI, that is then converted into a sky image, using the Healpix projection (Górski et al. 2005). This projection provides an equal-area pixelization on a sphere and allows the generation of an all-sky map, avoiding the distortion introduced by other types of sky projections far from the projection center. This sky map is then corrected for the occultation of Sun, Earth, and Moon. The sky maps produced from each DPI are added together, with the intensity in a given sky direction computed from the contribution from all the sky images, each inversely weighted for its variance in that direction. As described above, the bright sources and background were already subtracted from each single DPI; therefore, this all-sky mosaic contains only the residual sky contribution. To correct for residual systematic effects (e.g., imperfect modelling of the source illumination pattern or of the background distribution), the all-sky S/N map is sampled on a scale significantly larger than the PSF: the local average S/N is subtracted and its measured variance used to normalize the local S/N distribution. Finally, we obtain a S/N map with zero average and unitary variance that can be used to complete a blind source detection.
4.2 Detection strategy
We created all-sky maps in three energy bands: 14-150 keV,
14-70 keV, and 14-30 keV. The source detection in the
all-sky map is performed by searching for local excesses in the
significance map. The source position and its peak significance are
then refined with a fit restricted within a region of a few pixels,
where the excess dominates over the noise distribution. Only detections
with peak significance greater than 4.8 sigma are included in
our list of detected sources. We found that this threshold represents
the optimal value maximizing the number of detectable sources,
maintaining at the same time an acceptable number of spurious
detections: taking into account the total number of pixels in the all
sky map and their spatial correlation, the PSF, and the Gaussian
distribution of the noise, we expect 15 spurious detections
above our threshold in each energy band, because of statistical
fluctuations (Segreto et al.
2010). Therefore, the total number of spurious detections
will be between 15 and 45 (1.6% to 4.7% of
the total number of our detections, see below), the best case
occurring if each noise fluctuation above the threshold appears
simultaneously in all three bands, the worst case occurring if each
fluctuation appears only in one energy band. A few sources (![]() )
detected with a significance slightly lower than our
threshold were included in the detection list because their S/N
is significantly higher than the negative excess (in modulus)
of the local noise distribution.
)
detected with a significance slightly lower than our
threshold were included in the detection list because their S/N
is significantly higher than the negative excess (in modulus)
of the local noise distribution.
The resulting detection catalogues (one for each of the three energy bands) were cross-correlated and merged into a single catalogue: when source candidates closer than 10 arcmin were present in the sky maps of different energy bands, they were reported in the merged catalogue as a single source candidate. We obtain a final number of 962 source candidates (detected in at least one of the three energy bands). We assume the most accurate source position to be that corresponding to the energy range with the highest detection significance.
We evaluated the hardness ratio of the detected sources as Rate(30-150 keV)/Rate(14-30 keV) (the hard rate is evaluated as the difference between the count rates in the 14-150 and in the 14-30 energy bands). In Fig. 1, we plot the hardness ratio as a function of the significance of each detected source, showing the energy range where the detection has the highest significance. Repeating the detection process in three energy bands optimizes the S/N for each source, yielding more reliable values of the source position, whose uncertainty scales inversely with the significance. Moreover, a significant subsample of sources was detected in only one of the three energy bands (56 in the 14-150 keV energy band, 38 in the 14-30 keV energy band, 78 in the 14-70 keV energy band) demonstrating that searching in different energy bands maximizes the number of detectable sources.
Figure 2 shows that the distribution of the detected sources (orange squares) versus Galactic latitude flattens for |b| > 5, which we shall hereafter consider to be our operational definition of the Galactic plane.
![\begin{figure}
\par\includegraphics[width=8.5cm,clip]{11184_01.ps}
\end{figure}](/articles/aa/full_html/2010/02/aa11184-08/img20.png)
|
Figure 1: Hardness ratio (defined as R(30-150)/R(14-30)) of the sources detected with B ATI MAGER as a function of the best detection significance. Different symbols refer to the energy range where each source was detected at the highest S/N. The solid line is the average hardness ratio value. |
| Open with DEXTER | |
![\begin{figure}
\par\includegraphics[width=8.8cm,clip]{11184_02.ps}
\end{figure}](/articles/aa/full_html/2010/02/aa11184-08/img21.png)
|
Figure 2:
Distribution of the detected sources versus Galactic latitude. Each
bin corresponds to a solid angle of |
| Open with DEXTER | |
4.3 Identification strategy
The identification of the counterpart to the BAT detections was performed following three different strategies:
A. The position of each
of the 962 detected excesses was cross-correlated with the coordinates
of the sources included in the INTEGRAL General Reference Catalogue![]() (v. 27), which
contains 1652 X-ray emitters, and with the coordinates of the
counterpart of the 48 new identifications of
BAT sources already published (Ajello et al. 2008b; Tueller
et al. 2008; Markwardt et al. 2005;
Ajello
et al. 2008a) and not included in the above
catalogue. We adopted as a counterpart a source within a radius R=8.4 arcmin
from the BAT position (4 standard deviations error
circle for a source detection at 4.8 standard deviations, Segreto et al. 2010).
With this method, we obtained 458 identifications,
295 with
(v. 27), which
contains 1652 X-ray emitters, and with the coordinates of the
counterpart of the 48 new identifications of
BAT sources already published (Ajello et al. 2008b; Tueller
et al. 2008; Markwardt et al. 2005;
Ajello
et al. 2008a) and not included in the above
catalogue. We adopted as a counterpart a source within a radius R=8.4 arcmin
from the BAT position (4 standard deviations error
circle for a source detection at 4.8 standard deviations, Segreto et al. 2010).
With this method, we obtained 458 identifications,
295 with ![]() .
Our choice of the error radius enabled us to maximize the
associations and ensure that the number of spurious associations were
maintained to a negligible level. The number of spurious
identifications due to chance spatial coincidence was evaluated using
the following expression:
.
Our choice of the error radius enabled us to maximize the
associations and ensure that the number of spurious associations were
maintained to a negligible level. The number of spurious
identifications due to chance spatial coincidence was evaluated using
the following expression:
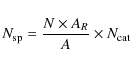
where, AR is the selected error circle area, A is the total sky area under investigation, and N and
B. We searched for observations
from Swift/XRT containing the remaining (504)
unidentified excesses in their field. We found Swift/XRT
observations for 186 BAT source candidates. Source
detection inside these X-ray images was performed using
XIMAGE (v4.4). When a source was detected inside
a 6.3 arcmin error circle (99.7% confidence
level for a source detection at 4.8 standard deviations, Segreto et al. 2010),
we first measured its hardness ratio in the
0.3-10 keV range (with 3 keV as a common
boundary of the two ratio bands) and its count rate above
3 keV. We identified a source as the counterpart of
a BAT detection, if at least one of the
above conditions was satisfied: hardness ratio >0.5,
count rate above 3 keV >5 ![]() 10-3 c s-1.
In seven cases where two candidates, satisfying at least one
of the threshold conditions, were found inside the BAT error
circle, we selected the counterpart to be the closest source
to the BAT position. With this method, we identified
170 source counterparts. To evaluate the number of
expected spurious identifications, we collected a large sample of
XRT observations of GRB fields, using only late
follow-ups (where the GRB afterglow
has faded) with the same exposure time distribution as the XRT
pointings of the BAT sources. We searched for sources within
a 6.3 arcmin error circle centered on the nominal
pointing position in each of these fields, excluding any
GRB residual afterglow, and satisfying at least one of the
above threshold conditions. We detected 7 sources, therefore,
the number of expected spurious identifications is consistent with the
number of multiple XRT detections inside the
BAT error
circle. We also searched for field observations with other X-ray
instruments (XMM-Newton, Chandra,
BeppoSAX), finding 25 identifications,
out of 30 pointings. Given the low number of
available fields, the number of expected spurious identifications
within this sample is irrelevant.
10-3 c s-1.
In seven cases where two candidates, satisfying at least one
of the threshold conditions, were found inside the BAT error
circle, we selected the counterpart to be the closest source
to the BAT position. With this method, we identified
170 source counterparts. To evaluate the number of
expected spurious identifications, we collected a large sample of
XRT observations of GRB fields, using only late
follow-ups (where the GRB afterglow
has faded) with the same exposure time distribution as the XRT
pointings of the BAT sources. We searched for sources within
a 6.3 arcmin error circle centered on the nominal
pointing position in each of these fields, excluding any
GRB residual afterglow, and satisfying at least one of the
above threshold conditions. We detected 7 sources, therefore,
the number of expected spurious identifications is consistent with the
number of multiple XRT detections inside the
BAT error
circle. We also searched for field observations with other X-ray
instruments (XMM-Newton, Chandra,
BeppoSAX), finding 25 identifications,
out of 30 pointings. Given the low number of
available fields, the number of expected spurious identifications
within this sample is irrelevant.
C. For the remaining
unidentified sky map excesses (309), we searched for spatial
coincidence inside an error circle of 4.2 arcmin radius (![]() confidence
level for a source detection at 4.8 standard deviations, Segreto et al. 2010)
with sources included in the SIMBAD catalogues. The size of the search
radius was fixed to 4.2 arcmin to ensure a negligible number
of spurious identifications (see below). We restricted our
search to the following SIMBAD object classes: cataclysmic
variable (CV), high mass X-ray binaries (HXB), low mass X-ray
binaries (LXB), Seyfert 1 (Sy1), Seyfert 2 (Sy2),
Blazar and BL Lac (Bla, BLL), and LINERs (LIN), for a total of
22 425 objects in the SIMBAD database. This strategy
allowed us to identify 92 detections, only one source being at
low Galactic latitude (
confidence
level for a source detection at 4.8 standard deviations, Segreto et al. 2010)
with sources included in the SIMBAD catalogues. The size of the search
radius was fixed to 4.2 arcmin to ensure a negligible number
of spurious identifications (see below). We restricted our
search to the following SIMBAD object classes: cataclysmic
variable (CV), high mass X-ray binaries (HXB), low mass X-ray
binaries (LXB), Seyfert 1 (Sy1), Seyfert 2 (Sy2),
Blazar and BL Lac (Bla, BLL), and LINERs (LIN), for a total of
22 425 objects in the SIMBAD database. This strategy
allowed us to identify 92 detections, only one source being at
low Galactic latitude (
![]() ). The number of expected
spurious identifications was evaluated with the two methods described
by strategy A. According to
Eq. (1),
we expect 0.03 spurious identifications within
). The number of expected
spurious identifications was evaluated with the two methods described
by strategy A. According to
Eq. (1),
we expect 0.03 spurious identifications within ![]() (20 BAT detections and 391 Simbad sources in
the classes of interest) and 2.7 elsewhere
(289 BAT detections and
22 034 Simbad sources); using the set of
309 coordinate pairs obtained inverting with respect to the
Galactic center the positions of the sources in our sample, we find
3 spurious associations,
consistent with the first method. The cross-correlation between
unidentified sky excess and the SIMBAD catalogue of QSOs was treated
separately because the coincidence error circle of 4.2 arcmin
radius results in a high number of spurious associations
(9 out of 17 associations). A radius of
2 arcmin allowed us to identify 9 sources
as QSOs, and to optimize the ratio of the total number of
associations to the expected number of spurious associations (
(20 BAT detections and 391 Simbad sources in
the classes of interest) and 2.7 elsewhere
(289 BAT detections and
22 034 Simbad sources); using the set of
309 coordinate pairs obtained inverting with respect to the
Galactic center the positions of the sources in our sample, we find
3 spurious associations,
consistent with the first method. The cross-correlation between
unidentified sky excess and the SIMBAD catalogue of QSOs was treated
separately because the coincidence error circle of 4.2 arcmin
radius results in a high number of spurious associations
(9 out of 17 associations). A radius of
2 arcmin allowed us to identify 9 sources
as QSOs, and to optimize the ratio of the total number of
associations to the expected number of spurious associations (![]() ).
).
![\begin{figure}
\par\includegraphics[angle=-90,width=8.8cm,clip]{11184_03.ps}
\end{figure}](/articles/aa/full_html/2010/02/aa11184-08/img31.png)
|
Figure 3: Offset between the BAT position and the counterpart position as a function of the detection significance. A few values are far from the overall distribution: those marked with a star (sources number 535, 564, 565, 570, 571, 574, 584 and 586 in Table 2) are in crowded field and the reconstructed sky position suffers from the contamination of the PSF of the nearest sources; the one marked with a circle is an extended source (Coma Cluster). The solid line represents the fit to the data (excluding the few outliers) with a power law. |
| Open with DEXTER | |
In Fig. 3,
we report the offsets of each BAT source with respect to its
identified counterpart as a function of the detection
significance (S/N).
The offset versus the detection significance can be modeled
with a power-law plus a constant. The best-fit equation that
we obtained was:
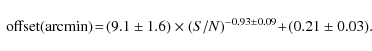
The constant in Eq. (2) represents the systematic error due to a residual boresight misalignment. At the detection threshold of 4.8 standard deviations, the average offset is
Figure 4 shows the distribution of the identified sources for each identification strategy as a function of the offset between the BAT position and the counterpart position. The peak of the distribution is at a lower offset for strategy A because the sample of the sources identified with this strategy contains the brightest objects. The peak of the distribution relevant to strategy B is at a lower offset than the distribution of strategy C because the XRT follow-up observations were performed on the more significant still unidentified source candidates.
All the identifications obtained with the three strategies (754) were merged into the final catalogue reported in Table 2 (see Sect. 6), where a flag indicates the identification method for each source. Figure 2 shows the distribution of all identified sources (black diamonds) as a function of the Galactic latitude.
A set of 208 detections could not be associated with a
counterpart. These source candidates have a detection significance of
between 4.8 and 14 standard deviations and a flux in
the 14-150 keV band of between 6.7 ![]() 10-12 and 2.7
10-12 and 2.7 ![]() 10-11 erg cm-2 s-1.
Thirty-three sources out of 208 are detected in all the three
enegy bands, and 63 in two energy bands. The unidentified
detections are distributed quite uniformly across the sky
(Fig. 2,
green circles), 190 sources out of 208 being located
above the Galactic plane (
10-11 erg cm-2 s-1.
Thirty-three sources out of 208 are detected in all the three
enegy bands, and 63 in two energy bands. The unidentified
detections are distributed quite uniformly across the sky
(Fig. 2,
green circles), 190 sources out of 208 being located
above the Galactic plane (
![]() ).
).
![\begin{figure}
\par\includegraphics[angle=-90,width=8.8cm,clip]{11184_04.ps}
\end{figure}](/articles/aa/full_html/2010/02/aa11184-08/img34.png)
|
Figure 4: Distribution of the identified sources for each identification strategy (Sect. 4.3) as a function of the offset between the BAT position and the counterpart position. |
| Open with DEXTER | |
5 Sky coverage and limiting flux
Figure 5
shows the sky coverage, defined as the fraction of the sky covered by
the survey as a function of the detection limiting flux. The limiting
flux for a given sky direction is calculated by multiplying the local
image noise by a fixed detection threshold of 5 standard
deviations. This threshold, higher than the one adopted for source
detection (Sect. 4.2),
was used to compare the BAT sky coverage with those produced with the
INTEGRAL data survey. The large BAT field of view, the large
geometrical area, and the Swift pointing distribution, which covers the
sky randomly and uniformly according to the appearance of GRBs, allowed
an unprecedented sensitive and quite uniform sky coverage to be
obtained. The 39 month BAT survey covers 90% of the
sky down to a flux limit of 2.5 ![]() 10-11 erg cm-2 s-1
(1.1 mCrab), and 50% of the sky down to 1.8
10-11 erg cm-2 s-1
(1.1 mCrab), and 50% of the sky down to 1.8 ![]() 10-11 erg cm-2 s-1
(0.8 mCrab). In the same figure, the BAT sky coverage
is compared with that of INTEGRAL/ISGRI after 44 months of
observation (Krivonos
et al. 2007).
10-11 erg cm-2 s-1
(0.8 mCrab). In the same figure, the BAT sky coverage
is compared with that of INTEGRAL/ISGRI after 44 months of
observation (Krivonos
et al. 2007).
![\begin{figure}
\par\includegraphics[angle=-90,width=8.8cm,clip]{11184_05.ps}
\end{figure}](/articles/aa/full_html/2010/02/aa11184-08/img35.png)
|
Figure 5: Fraction of the sky covered by the Swift-BAT and INTEGRAL-ISGRI surveys vs. limiting flux. |
| Open with DEXTER | |
![\begin{figure}
\par\includegraphics[width=17cm,clip]{11184_06-NEW.eps}
\end{figure}](/articles/aa/full_html/2010/02/aa11184-08/img36.png)
|
Figure 6: Map of the limiting flux (in mCrab) of the 39-months BAT-survey data in the 14-150 keV band, projected in Galactic coordinates, with the ecliptic coordinates grid superimposed (the thick lines represents the ecliptica axes). The scale on the colorbar is in mCrab. |
| Open with DEXTER | |
Figure 6
shows the limiting flux map in Galactic Aitoff projection, with the
ecliptic coordinates grid superimposed. The minimum detection limiting
flux is not fully uniform on the sky: the Galactic
center and the ecliptic plane are characterized by a poorer sensitivity
because of high contamination from intense Galactic sources and to the
observing constraints on the Swift spacecraft. The
highest flux sensitivity is achieved close to the ecliptic poles, where
a detection flux limit of about 1.1 ![]() 10-11 erg cm-2 s-1
is reached (
10-11 erg cm-2 s-1
is reached (![]() mCrab).
mCrab).
6 The 39-month catalogue
The complete catalogue of the sources identified in the first 39 months of BAT survey data is reported in Table 2. The table contains the following information:
- Palermo BAT Catalogue (PBC) name of the source (Col. 2), compiled from the BAT coordinates with the precision of 0.1 arcmin on RA.
- Counterpart identification (Col. 3) and source type (Col. 4) coded according to the nomenclature used in SIMBAD.
- RA and Dec of the BAT source in decimal degrees (Cols. 5, 6).
- Error radius (Col. 7), offset with respect to the counterpart position (Col. 8) and significance (Col. 9), obtained for the energy band with the highest significance (a flag in Col. 14 indicates the energy range with the maximum significance).
- Flux in the widest band of detection, averaged over the
entire survey period (Col. 10). For most of the sources, this
is 14-150 keV. In the other cases, a flag in
Col. 14 indicates the appropriate band. To convert
count rates into fluxes, we derived a conversion factor for
each of the three bands using the corresponding Crab count rate and the
Crab spectrum used for BAT calibration purposes, as reported
in the BAT calibration status report.
- Hardness ratio defined as Rate[30-150 keV]/Rate [14-30 keV], where the hard rate is evaluated as the difference between the count rates in the 14-150 and in the 14-30 energy bands (Col. 11).
- Redshift of the extragalactic sources (Col. 12), from the SIMBAD database (or NED, for the few cases that were not reported in SIMBAD).
- Log of the rest-frame luminosity in the 14-150 keV band for extragalactic objects (Col. 13), calculated using the luminosity distance for sources with redshift >0.01, and using the distance reported in the Nearby Galaxies Catalogue (NBG, Tully 1988) or NED, for the few cases not reported in the NBG catalogue, for sources with redshift <0.01.
- Flag column (Col. 14) with information about:
energy band with the highest significance (A), energy band
used for the calculation of the flux (B), flag for already
known hard X-ray sources (C), position with respect to the
Galactic plane (
 , D), and strategy
used for the identification (E, see Sect. 4.3).
, D), and strategy
used for the identification (E, see Sect. 4.3).
6.1 Statistical properties of the catalogue
Table 1
describes the distribution of the 754 sources in our catalogue
among different object classes: ![]() % of the catalogue consists of
extragalactic objects,
% of the catalogue consists of
extragalactic objects, ![]() %
are Galactic objects, and
%
are Galactic objects, and ![]() %
are already known X-ray or gamma-ray emitters whose nature is still to
be determined. Figure 7
shows the distribution of all the sources in our catalogue,
colour-coded according to the object class, where the size of the
symbol is proportional to the 14-150 keV flux
(for those sources not detected in the 14-150 keV
band, the flux in the widest band of detection has been extrapolated to
the 14-150 keV range using the BAT Crab spectrum).
%
are already known X-ray or gamma-ray emitters whose nature is still to
be determined. Figure 7
shows the distribution of all the sources in our catalogue,
colour-coded according to the object class, where the size of the
symbol is proportional to the 14-150 keV flux
(for those sources not detected in the 14-150 keV
band, the flux in the widest band of detection has been extrapolated to
the 14-150 keV range using the BAT Crab spectrum).
Table 1: Classification of the known sources detected in the BAT survey.
We compared this distribution with the third ISGRI catalogue (Bird et al. 2007). The
results are plotted in Fig. 8.
We measured a dramatic improvement in the detection of extragalactic
objects, both in the nearby Universe (normal galaxies, LINERs) and at
greater distances (Seyfert
galaxies, QSO, clusters of galaxies). As expected from the sky
coverage achieved by the BAT survey data (Fig. 5), most of our
identified sources have a flux below 1 ![]() 10-10 erg s-1 cm-2
and are located outside the Galactic plane. We also detected many
Galactic sources that are not included in the ISGRI catalogue,
most of which are cataclysmic variables and X-ray binaries. This can be
explained in part by the different pointing strategy of the two
instruments. However, Fig. 2
shows that, although most of our newly identified sources (red
triangles) are above the Galactic plane, where the
ISGRI exposure is low, we also detect a few sources on the
Galactic plane most of which we identify as X-ray binaries
(1E 1743.1-2852, GRO 1750-27,
SAX J1810.8-2609, and XTE J1856+053). We verified
that their detections are caused by a transient intense emission
observed in the large FoV of BAT.
10-10 erg s-1 cm-2
and are located outside the Galactic plane. We also detected many
Galactic sources that are not included in the ISGRI catalogue,
most of which are cataclysmic variables and X-ray binaries. This can be
explained in part by the different pointing strategy of the two
instruments. However, Fig. 2
shows that, although most of our newly identified sources (red
triangles) are above the Galactic plane, where the
ISGRI exposure is low, we also detect a few sources on the
Galactic plane most of which we identify as X-ray binaries
(1E 1743.1-2852, GRO 1750-27,
SAX J1810.8-2609, and XTE J1856+053). We verified
that their detections are caused by a transient intense emission
observed in the large FoV of BAT.
![\begin{figure}
\par\includegraphics[width=17cm,clip]{11184_07.ps}
\end{figure}](/articles/aa/full_html/2010/02/aa11184-08/img38.png)
|
Figure 7: Map of the sources that we detect in the BAT survey data (Galactic coordinates). Different colors denote different object classes, as detailed in the legend. The size of the symbol is proportional to the source flux in the 14-150 keV band. |
| Open with DEXTER | |
![\begin{figure}
\par\includegraphics[width=8cm,clip]{11184_08.ps}\vspace*{2mm}
\includegraphics[width=8cm,clip]{11184_09.ps}
\end{figure}](/articles/aa/full_html/2010/02/aa11184-08/img39.png)
|
Figure 8: Comparison between the sources in our catalogue and those reported in the third ISGRI catalogue (Bird et al. 2007). Top: galactic sources. Bottom: extragalactic sources. |
| Open with DEXTER | |
![\begin{figure}
\par\includegraphics[width=8.5cm,clip]{11184_10.ps}
\end{figure}](/articles/aa/full_html/2010/02/aa11184-08/img40.png)
|
Figure 9: Redshift distribution of the extragalactic sources in the BAT survey catalogue for different classes of extragalactic sources. |
| Open with DEXTER | |
![\begin{figure}
\par\includegraphics[width=8.8cm,clip]{11184_11.ps}
\end{figure}](/articles/aa/full_html/2010/02/aa11184-08/img42.png)
|
Figure 10:
|
| Open with DEXTER | |
We detected emission from 18 clusters of galaxies. We verified that
for 17 of them the spectral distribution in the
14-150 keV band is consistent with the tail of a thermal
emission with kT ![]() 10 keV, without evidence of hard non-thermal emission. Only
for Abell 2142 did we find evidence of
a power law component that could be related to the
AGN content of the cluster.
10 keV, without evidence of hard non-thermal emission. Only
for Abell 2142 did we find evidence of
a power law component that could be related to the
AGN content of the cluster.
6.2 The extragalactic subsample
The catalogue contains 519 extragalactic objects. Figure 9 shows the redshift
distribution of our sample for the main classes of extragalactic
objects. Most of the emission-line AGNs are located at z<0.1,
but we also detected a few Seyfert 1 galaxies at higher
redshift (up to ![]() ).
Seyfert 2 galaxies are detected up to
).
Seyfert 2 galaxies are detected up to ![]() .
Blazars are detected up to
.
Blazars are detected up to ![]() ,
and QSOs are detected up to
,
and QSOs are detected up to ![]() .
.
We verified the completeness of our sample of 366
emission-line galaxies (i.e., the significance limit down to
which we include in the sample all objects above a given flux limit)
using
the ![]() test (Schmidt
1968; Huchra
& Sargent 1973). This method was developed
to test the evolution of complete samples of objects, but can also be
used to
test the completeness of non-evolving samples.
For each source, V is the volume enclosed by the
object distance, while
test (Schmidt
1968; Huchra
& Sargent 1973). This method was developed
to test the evolution of complete samples of objects, but can also be
used to
test the completeness of non-evolving samples.
For each source, V is the volume enclosed by the
object distance, while
![]() is the volume corresponding to the maximum distance where the object
could still be revealed in the survey (and thus depends on the limiting
flux in
the direction of the object). In the case of no evolution, the expected
value of
is the volume corresponding to the maximum distance where the object
could still be revealed in the survey (and thus depends on the limiting
flux in
the direction of the object). In the case of no evolution, the expected
value of
![]() ,
averaged over the entire sample, is 0.5. We assumed the hypothesis of
no evolution and uniform distribution in the local Universe. For each
source in the sample and for each significance level tested for
completeness (
,
averaged over the entire sample, is 0.5. We assumed the hypothesis of
no evolution and uniform distribution in the local Universe. For each
source in the sample and for each significance level tested for
completeness (
![]() ), we computed the quantity
), we computed the quantity ![]() as
as
![]() ,
where F is the flux of the source and
,
where F is the flux of the source and ![]() is its 1 standard deviation uncertainty. The quantity
is its 1 standard deviation uncertainty. The quantity ![]() was obtained by averaging
was obtained by averaging ![]() over
the number N of all sources in the sample detected with a significance
higher than
over
the number N of all sources in the sample detected with a significance
higher than ![]() ,
and its error is 1/12N. Figure 10 shows the results
of this test: the distribution becomes constant at
,
and its error is 1/12N. Figure 10 shows the results
of this test: the distribution becomes constant at ![]() ,
with a mean
value of
,
with a mean
value of ![]() ,
consistent with the expected value of 0.5. Thus, we
can confidently assume that our sample is complete to our adopted
significance threshold of
,
consistent with the expected value of 0.5. Thus, we
can confidently assume that our sample is complete to our adopted
significance threshold of ![]() .
.
Table 2: BAT survey 39 months catalogue.
6.3 log(N) - log(S) distribution
The ![]() distribution was evaluated by summing the contributions of all the
detected sources firmly identified with extragalactic objects
(Table 2)
and all the unidentified
detections. We selected only sources with
distribution was evaluated by summing the contributions of all the
detected sources firmly identified with extragalactic objects
(Table 2)
and all the unidentified
detections. We selected only sources with ![]() :
Fig. 2
(orange squares) shows that the detection distribution is uniform above
this Galactic latitude limit. The cumulative distribution is weighted
by the area in which these sources could have been detected.
The following formula was applied:
:
Fig. 2
(orange squares) shows that the detection distribution is uniform above
this Galactic latitude limit. The cumulative distribution is weighted
by the area in which these sources could have been detected.
The following formula was applied:

where N is the total number of detected sources with fluxes greater than S, Si is the flux of the ith source and
To avoid the presence of systematic errors in the determination of the ![]() caused by spurious source detections and to the large relative
uncertainty in the sky coverage at the lower end of the flux scale, we
limited the construction of the
caused by spurious source detections and to the large relative
uncertainty in the sky coverage at the lower end of the flux scale, we
limited the construction of the ![]() to fluxes greater than
to fluxes greater than ![]()
![]() 10-11 erg cm-2 s-1.
The resulting
10-11 erg cm-2 s-1.
The resulting ![]() distribution
contains 330 sources (14 unidentified) and covers a
flux range up to 3
distribution
contains 330 sources (14 unidentified) and covers a
flux range up to 3 ![]() 10-10 erg s-1 cm-2.
10-10 erg s-1 cm-2.
We applied a linear least-square fit to determine the slope of
the ![]() distribution
assuming a power law in the form N(>S)=K
distribution
assuming a power law in the form N(>S)=K ![]()
![]() ,
where S0 is assumed
to be 1
,
where S0 is assumed
to be 1 ![]() 10-11 erg cm-2 s-1.
The fit infers a value of
10-11 erg cm-2 s-1.
The fit infers a value of ![]()
![]() 0.06 and a normalization of 570
0.06 and a normalization of 570 ![]() 24 sources with flux greater than 10-11 erg cm-2 s-1,
corresponding to a density of
24 sources with flux greater than 10-11 erg cm-2 s-1,
corresponding to a density of ![]()
![]() 10-2 deg-2.
The single power-law model is found to provide an acceptable
description of the data (
10-2 deg-2.
The single power-law model is found to provide an acceptable
description of the data (
![]() ;
31 d.o.f.) with a slope consistent with
a Euclidean distribution.
;
31 d.o.f.) with a slope consistent with
a Euclidean distribution.
The presence of spurious detections in the sample of
unidentified sources could introduce a systematic effect in both the
slope and the normalization of the ![]() .
We expect
between 15 and 45 spurious detections to be caused by
statistical fluctuations (see Sect. 4.2), which
correspond to a percentage between
.
We expect
between 15 and 45 spurious detections to be caused by
statistical fluctuations (see Sect. 4.2), which
correspond to a percentage between ![]() and
and ![]() %
in the sample of the
%
in the sample of the ![]() unidentified
sources. This implies that 1-3 unidentified sources among
those
used in the fit of the
unidentified
sources. This implies that 1-3 unidentified sources among
those
used in the fit of the ![]() could be spurious. We checked that their contribution does not
introduce any significant systematic errors in the best-fit values.
could be spurious. We checked that their contribution does not
introduce any significant systematic errors in the best-fit values.
The integrated flux is ![]()
![]() 10-13 erg cm-2 s-1 deg-2
corresponding to
10-13 erg cm-2 s-1 deg-2
corresponding to ![]() 1.4%
of the intensity of the X-ray background in the 14-170 keV
energy band as measured by HEAO-1 (Gruber
et al. 1999).
1.4%
of the intensity of the X-ray background in the 14-170 keV
energy band as measured by HEAO-1 (Gruber
et al. 1999).
We compared this ![]() law with the one derived from INTEGRAL data (Krivonos et al. 2007)
in the 17-60 keV band. To convert our
law with the one derived from INTEGRAL data (Krivonos et al. 2007)
in the 17-60 keV band. To convert our ![]() into the 17-60 keV band, we used the Crab spectral parameters
derived by the INTEGRAL analysis (Laurent
et al. 2003). We determined a slope of
into the 17-60 keV band, we used the Crab spectral parameters
derived by the INTEGRAL analysis (Laurent
et al. 2003). We determined a slope of ![]()
![]() 0.08 and a normalization of 240
0.08 and a normalization of 240 ![]() 12 sources with flux higher than 1 mCrab,
corresponding to a density of
12 sources with flux higher than 1 mCrab,
corresponding to a density of ![]()
![]() 10-3 deg-2.
These parameters are in full agreement with those reported by
Krivonos et al. (2007).
10-3 deg-2.
These parameters are in full agreement with those reported by
Krivonos et al. (2007).
![\begin{figure}
\par\includegraphics[angle=-90,width=8.8cm,clip]{11184_12.ps}
\end{figure}](/articles/aa/full_html/2010/02/aa11184-08/img506.png)
|
Figure 11:
|
| Open with DEXTER | |
7 Conclusions
We have analyzed the BAT hard X-ray survey data of the first 39 months of the Swift mission. To complete this analysis we developed a dedicated software (Segreto et al. 2010) that performs data reduction, background subtraction, mosaicking, and source detection for the BAT survey data. This software is completely independent from that developed by the Swift-BAT team. It is a single tool that provides all the products relevant to the BAT survey sources (e.g., images, spectra, and light curves).
The large BAT field of view, the large geometrical area, and
the Swift pointing strategy
have allowed us to obtain an unprecedented, very sensitive, and quite
uniform sky coverage that has provided a significant increase in
sources detected in the hard X-ray sky. The survey flux limit is
2.5 ![]() 10-11 erg cm-2 s-1
(1.1 mCrab) for 90% of the sky and 1.8
10-11 erg cm-2 s-1
(1.1 mCrab) for 90% of the sky and 1.8 ![]() 10-11 erg cm-2 s-1
(0.8 mCrab) for 50% of the sky.
10-11 erg cm-2 s-1
(0.8 mCrab) for 50% of the sky.
We have derived a catalogue of 754 identified sources detected above a significance threshold of 4.8 standard deviations. The association of these sources with their counterparts has been performed in three alternative strategies: cross-correlation with the INTEGRAL General Reference Catalogue and with previously published BAT catalogues (Tueller et al. 2008; Markwardt et al. 2005; Ajello et al. 2008a); analysis of soft X-ray field observations with Swift-XRT, XMM-Newton, Chandra, BeppoSAX; and cross-correlation with the SIMBAD catalogues of Seyfert galaxies, QSOs, LINERs, Blazars, cataclysmic variables, and X-ray binaries. The expected total number of spurious identifications is negligible. A set of 208 detections have not yet been associated with a counterpart. These candidate sources will be the subject of a follow-up campaign with Swift-XRT in the near future.
The extragalactic sources represents ![]() % of our catalogue
(519 objects),
% of our catalogue
(519 objects), ![]() %
are Galactic objects, and
%
are Galactic objects, and ![]() %
are already known X-ray or gamma-ray emitters, whose nature is still to
be determined. Compared with the 3rd ISGRI catalogue (Bird et al. 2007), we
identify 176 more Seyfert galaxies, 26 more normal
galaxies, 13 more galaxy clusters,
13 more QSO, 57 more Blazars, and
5 more LINERs. The redshift limit for the detected
emission-line AGNs is
%
are already known X-ray or gamma-ray emitters, whose nature is still to
be determined. Compared with the 3rd ISGRI catalogue (Bird et al. 2007), we
identify 176 more Seyfert galaxies, 26 more normal
galaxies, 13 more galaxy clusters,
13 more QSO, 57 more Blazars, and
5 more LINERs. The redshift limit for the detected
emission-line AGNs is ![]() ,
with 31 objects with z>0.1. Blazars
and QSOs are detected up to
,
with 31 objects with z>0.1. Blazars
and QSOs are detected up to ![]() and
and ![]() ,
respectively. Among the Galactic sources, we significantly increase the
number of cataclysmic variables detected in the hard X-ray band
(29 new objects). We also detect 22 X-ray binaries
that are not included in the ISGRI catalogue, even though the
total number of X-ray binaries that we detect is lower than the sample
included in the ISGRI catalogue.
,
respectively. Among the Galactic sources, we significantly increase the
number of cataclysmic variables detected in the hard X-ray band
(29 new objects). We also detect 22 X-ray binaries
that are not included in the ISGRI catalogue, even though the
total number of X-ray binaries that we detect is lower than the sample
included in the ISGRI catalogue.
Based on the extragalactic sources sample and on the achieved
sky coverage, we have evaluated the ![]() distribution for fluxes higher than 1.5
distribution for fluxes higher than 1.5 ![]() 10-11 erg cm-2 s-1.
The slope 1.55
10-11 erg cm-2 s-1.
The slope 1.55 ![]() 0.06 is consistent with a Euclidean distribution. We estimate
that the total number of extragalactic sources at
0.06 is consistent with a Euclidean distribution. We estimate
that the total number of extragalactic sources at ![]() and flux greater than 1.0
and flux greater than 1.0 ![]() 10-11 erg cm-2 s-1
is
10-11 erg cm-2 s-1
is ![]() .
Converting this
.
Converting this ![]() into the 17-60 keV band, our results are in full agreement
with those reported by Krivonos
et al. (2007) for the INTEGRAL survey. The
integrated flux of this extragalactic sample is
into the 17-60 keV band, our results are in full agreement
with those reported by Krivonos
et al. (2007) for the INTEGRAL survey. The
integrated flux of this extragalactic sample is ![]() of the cosmic X-ray background in the 14-150 keV range (Gruber
et al. 1999; Frontera et al. 2007; Churazov
et al. 2007; Ajello et al. 2008c).
of the cosmic X-ray background in the 14-150 keV range (Gruber
et al. 1999; Frontera et al. 2007; Churazov
et al. 2007; Ajello et al. 2008c).
Forthcoming papers will focus on the detection of transient sources, spectral properties of the extragalactic sample, and updates of the catalogue.
AcknowledgementsG.C. acknowledges B. Sacco and M. Ajello for useful discussions that helped to improve this paper, and the referee W. Voges for his helpful comments and suggestions. This research has made use of NASA's Astrophysics Data System Bibliographic Services, of the SIMBAD database, operated at CDS, Strasbourg, France, as well as of the NASA/IPAC Extragalactic Database (NED), which is operated by the Jet Propulsion Laboratory, California Institute of Technology, under contract with the National Aeronautics and Space Administration. This work was supported by contract ASI/INAF I/011/07/0.
References
- Ajello, M., Greiner, J., Kanbach, G., et al. 2008a, ApJ, 678, 102 [NASA ADS] [CrossRef] [Google Scholar]
- Ajello, M., Rau, A., Greiner, J., et al. 2008b, ApJ, 673, 96 [NASA ADS] [CrossRef] [Google Scholar]
- Ajello, M., Greiner, J., Sato, G., et al. 2008c, ApJ, 689, 666 [NASA ADS] [CrossRef] [Google Scholar]
- Barthelmy, S. D., Barbier, L. M., Cummings, J. R., et al. 2005, Space Sci. Rev., 120, 143 [NASA ADS] [CrossRef] [Google Scholar]
- Bassani, L., Molina, M., Malizia, A., et al. 2006, ApJ, 636, L65 [NASA ADS] [CrossRef] [Google Scholar]
- Beckmann, V., Soldi, S., Shrader, C. R., Gehrels, N., & Produit, N. 2006, ApJ, 652, 126 [NASA ADS] [CrossRef] [Google Scholar]
- Bird, A. J., Barlow, E. J., Bassani, L., et al. 2004, ApJ, 607, L33 [NASA ADS] [CrossRef] [Google Scholar]
- Bird, A. J., Barlow, E. J., Bassani, L., et al. 2006, ApJ, 636, 765 [NASA ADS] [CrossRef] [EDP Sciences] [Google Scholar]
- Bird, A. J., Malizia, A., Bazzano, A., et al. 2007, ApJS, 170, 175 [NASA ADS] [CrossRef] [Google Scholar]
- Brandt, W. N., & Hasinger, G. 2005, ARA&A, 43, 827 [Google Scholar]
- Cappelluti, N., Hasinger, G., Brusa, M., et al. 2007, ApJS, 172, 341 [NASA ADS] [CrossRef] [Google Scholar]
- Churazov, E., Sunyaev, R., Revnivtsev, M., et al. 2007, A&A, 467, 529 [NASA ADS] [CrossRef] [EDP Sciences] [Google Scholar]
- Cordier, B., Goldwurm, A., Laurent, P., et al. 1991, Adv. Space Res., 11, 169 [Google Scholar]
- Fenimore, E. E., & Cannon, T. M. 1978, Appl. Opt., 17, 337 [NASA ADS] [CrossRef] [PubMed] [Google Scholar]
- Forman, W., Jones, C., Cominsky, L., et al. 1978, ApJS, 38, 357 [NASA ADS] [CrossRef] [Google Scholar]
- Frontera, F., Orlandini, M., Landi, R., et al. 2007, ApJ, 666, 86 [NASA ADS] [CrossRef] [Google Scholar]
- Gehrels, N., Chincarini, G., Giommi, P., et al. 2004, ApJ, 611, 1005 [NASA ADS] [CrossRef] [Google Scholar]
- Górski, K. M., Hivon, E., Banday, A. J., et al. 2005, ApJ, 622, 759 [NASA ADS] [CrossRef] [Google Scholar]
- Gruber, D. E., Matteson, J. L., Peterson, L. E., & Jung, G. V. 1999, ApJ, 520, 124 [NASA ADS] [CrossRef] [Google Scholar]
- Huchra, J., & Sargent, W. L. W. 1973, ApJ, 186, 433 [NASA ADS] [CrossRef] [Google Scholar]
- Jager, R., Mels, W. A., Brinkman, A. C., et al. 1997, A&AS, 125, 557 [Google Scholar]
- Kendall, M. G. 1980, Multivariate analysis (London: Grin & co.) [Google Scholar]
- Krivonos, R., Vikhlinin, A., Churazov, E., et al. 2005, ApJ, 625, 89 [NASA ADS] [CrossRef] [Google Scholar]
- Krivonos, R., Revnivtsev, M., Lutovinov, A., et al. 2007, A&A, 475, 775 [NASA ADS] [CrossRef] [EDP Sciences] [Google Scholar]
- Laurent, P., Limousin, O., Cadolle-Bel, M., et al. 2003, A&A, 411, L185 [NASA ADS] [CrossRef] [EDP Sciences] [Google Scholar]
- Lebrun, F., Leray, J. P., Lavocat, P., et al. 2003, A&A, 411, L141 [NASA ADS] [CrossRef] [EDP Sciences] [Google Scholar]
- Markwardt, C. B., Tueller, J., Skinner, G. K., et al. 2005, ApJ, 633, L77 [NASA ADS] [CrossRef] [Google Scholar]
- Moretti, A., Campana, S., Lazzati, D., & Tagliaferri, G. 2003, ApJ, 588, 696 [NASA ADS] [CrossRef] [Google Scholar]
- Pavlinsky, M. N., Grebenev, S. A., & Sunyaev, R. A. 1992, SvA Lett., 18, 116 [Google Scholar]
- Pavlinsky, M. N., Grebenev, S. A., & Sunyaev, R. A. 1994, ApJ, 425, 110 [NASA ADS] [CrossRef] [Google Scholar]
- Sazonov, S., Revnivtsev, M., Krivonos, R., Churazov, E., & Sunyaev, R. 2007, A&A, 462, 57 [NASA ADS] [CrossRef] [EDP Sciences] [Google Scholar]
- Schmidt, M. 1968, ApJ, 151, 393 [NASA ADS] [CrossRef] [Google Scholar]
- Segreto, A., Cusumano, G., Ferrigno, C., et al. 2010, A&A, 510, A47 [NASA ADS] [CrossRef] [EDP Sciences] [Google Scholar]
- Skinner, G. K., Ponman, T. J., Hammersley, A. P., & Eyles, C. J. 1987a, Ap&SS, 136, 337 [NASA ADS] [CrossRef] [Google Scholar]
- Skinner, G. K., Willmore, A. P., Eyles, C. J., Bertram, D., & Church, M. J. 1987b, Nature, 330, 544 [NASA ADS] [CrossRef] [Google Scholar]
- Sunyaev, R. A., Churazov, E. M., Gil'Fanov, M. R., et al. 1991, Adv. Space Res., 11, 177 [NASA ADS] [CrossRef] [Google Scholar]
- Tueller, J., Mushotzky, R. F., Barthelmy, S., et al. 2008, ApJ, 681, 113 [NASA ADS] [CrossRef] [Google Scholar]
- Tully, R. B. 1988, Nearby Galaxies Catalogue (NBG) (Cambridge University Press) [Google Scholar]
- Ubertini, P., Bazzano, A., Cocchi, M., et al. 1999, Astrophys. Lett. Commun., 38, 301 [Google Scholar]
- Ubertini, P., Lebrun, F., Di Cocco, G., et al. 2003, A&A, 411, L131 [NASA ADS] [CrossRef] [EDP Sciences] [Google Scholar]
- Winkler, C., Courvoisier, T. J.-L., Di Cocco, G., et al. 2003, A&A, 411, L1 [NASA ADS] [CrossRef] [EDP Sciences] [Google Scholar]
- Wood, K. S., Meekins, J. F., Yentis, D. J., et al. 1984, ApJS, 56, 507 [NASA ADS] [CrossRef] [Google Scholar]
- Worsley, M. A., Fabian, A. C., Bauer, F. E., et al. 2005, MNRAS, 357, 1281 [NASA ADS] [CrossRef] [Google Scholar]
- Worsley, M. A., Fabian, A. C., Bauer, F. E., et al. 2006, MNRAS, 368, 1735 [NASA ADS] [CrossRef] [Google Scholar]
- Zdziarski, A. A., Poutanen, J., & Johnson, W. N. 2000, ApJ, 542, 703 [NASA ADS] [CrossRef] [Google Scholar]
Footnotes
- ... survey
- Table 2 is also available in electronic form at the CDS via anonymous ftp to cdsarc.u-strasbg.fr (130.79.128.5) or via http://cdsweb.u-strasbg.fr/cgi-bin/qcat?J/A+A/510/A48
- ... team
- http://heasarc.gsfc.nasa.gov/docs/swift/analysis/
- ... archive
- http://heasarc.gsfc.nasa.gov/cgi-bin/W3Browse/swift.pl
- ... Catalogue
- http://isdc.unige.ch/?Data+catalogs
- ... report
- http://swift.gsfc.nasa.gov/docs/swift/analysis/bat_digest.html#calstatus
All Tables
Table 1: Classification of the known sources detected in the BAT survey.
Table 2: BAT survey 39 months catalogue.
All Figures
|
|
Figure 1: Hardness ratio (defined as R(30-150)/R(14-30)) of the sources detected with B ATI MAGER as a function of the best detection significance. Different symbols refer to the energy range where each source was detected at the highest S/N. The solid line is the average hardness ratio value. |
| Open with DEXTER | |
| In the text | |
|
|
Figure 2:
Distribution of the detected sources versus Galactic latitude. Each
bin corresponds to a solid angle of |
| Open with DEXTER | |
| In the text | |
|
|
Figure 3: Offset between the BAT position and the counterpart position as a function of the detection significance. A few values are far from the overall distribution: those marked with a star (sources number 535, 564, 565, 570, 571, 574, 584 and 586 in Table 2) are in crowded field and the reconstructed sky position suffers from the contamination of the PSF of the nearest sources; the one marked with a circle is an extended source (Coma Cluster). The solid line represents the fit to the data (excluding the few outliers) with a power law. |
| Open with DEXTER | |
| In the text | |
|
|
Figure 4: Distribution of the identified sources for each identification strategy (Sect. 4.3) as a function of the offset between the BAT position and the counterpart position. |
| Open with DEXTER | |
| In the text | |
|
|
Figure 5: Fraction of the sky covered by the Swift-BAT and INTEGRAL-ISGRI surveys vs. limiting flux. |
| Open with DEXTER | |
| In the text | |
|
|
Figure 6: Map of the limiting flux (in mCrab) of the 39-months BAT-survey data in the 14-150 keV band, projected in Galactic coordinates, with the ecliptic coordinates grid superimposed (the thick lines represents the ecliptica axes). The scale on the colorbar is in mCrab. |
| Open with DEXTER | |
| In the text | |
|
|
Figure 7: Map of the sources that we detect in the BAT survey data (Galactic coordinates). Different colors denote different object classes, as detailed in the legend. The size of the symbol is proportional to the source flux in the 14-150 keV band. |
| Open with DEXTER | |
| In the text | |
|
|
Figure 8: Comparison between the sources in our catalogue and those reported in the third ISGRI catalogue (Bird et al. 2007). Top: galactic sources. Bottom: extragalactic sources. |
| Open with DEXTER | |
| In the text | |
|
|
Figure 9: Redshift distribution of the extragalactic sources in the BAT survey catalogue for different classes of extragalactic sources. |
| Open with DEXTER | |
| In the text | |
|
|
Figure 10:
|
| Open with DEXTER | |
| In the text | |
|
|
Figure 11:
|
| Open with DEXTER | |
| In the text | |
Copyright ESO 2010
Current usage metrics show cumulative count of Article Views (full-text article views including HTML views, PDF and ePub downloads, according to the available data) and Abstracts Views on Vision4Press platform.
Data correspond to usage on the plateform after 2015. The current usage metrics is available 48-96 hours after online publication and is updated daily on week days.
Initial download of the metrics may take a while.