| Issue |
A&A
Volume 507, Number 1, November III 2009
|
|
|---|---|---|
| Page(s) | 183 - 193 | |
| Section | Extragalactic astronomy | |
| DOI | https://doi.org/10.1051/0004-6361/200912255 | |
| Published online | 08 September 2009 | |
A&A 507, 183-193 (2009)
Globular cluster system erosion in elliptical galaxies
R. Capuzzo-Dolcetta - A. Mastrobuono-Battisti
Dep. of Physics, Sapienza, University of Roma, P.le A. Moro 5, 00185, Roma, Italy
Received 2 April 2009 / Accepted 5 August 2009
Abstract
Context. We analyse data of 8 elliptical galaxies to
study the
difference between the radial distributions of their globular cluster
systems (GCSs) and their galactic stellar component. In all galaxies
studied, the GCS density profile is significantly flatter towards the
galactic centre than that of the stars.
Aims. A flatter profile of the radial distribution
of the GCS
with respect to that of the galactic stellar component is a difference
with astrophysical relevance. A quantitative comparative analysis of
the profiles may provide insight into both galaxy and globular cluster
formation and evolution. If the difference is caused by erosion of the
GCS, the missing GCs in the galactic central region may have merged
around the galactic centre and formed, or at least increased in mass,
the galactic nucleus. Observational support to this are the
correlations between the galaxy integrated absolute magnitude and the
number of globular clusters lost and that between the central massive
black hole mass and the total mass of globular clusters lost.
Methods. We fitted both the stellar and globular
cluster system
radial profiles of a set of galaxies observed at high resolution. We
found that the GCS profile is less sharply peaked at the galactic
centre than the stellar one. Assuming that this difference is caused by
GCS evolution, starting from a radial distribution initially
indistinguishable from that of stars, we can evaluate by a simple
normalization procedure the number (and mass) of GCs that have
``disappeared''.
Results. The number of missing globular clusters is
significant,
ranging from 21% to 71% of their initial population abundance in the
eight galaxies examined. The corresponding mass lost to the central
galactic region is (for every galaxy of the sample) in the
![]() -
-
![]() interval.
All the transported mass towards the central galactic regions
have had probably an important effect on the innermost galactic zone,
including its violent transient activity (AGN) and local massive black
hole formation and growth.
interval.
All the transported mass towards the central galactic regions
have had probably an important effect on the innermost galactic zone,
including its violent transient activity (AGN) and local massive black
hole formation and growth.
Key words: galaxies: general - galaxies: elliptical and lenticular, cD - galaxies: evolution - galaxies: star clusters - galaxies: nuclei
1 Introduction
Many elliptical galaxies contain quite populous globular cluster systems (hereafter GCSs), that are, usually, less concentrated towards the galactic centre than the bulge-halo stars. Since the seminal review by Harris & Racine (1979) an enormous amount of work has been devoted to GCS identification in external galaxies and study of their properties. Regarding the GCS radial profiles, we recall, for the sake of example, recent papers of Bassino et al. (2006), Goudfrooij et al. (2007), Lee et al. (2008), Rhode et al. (2007), Sikkema et al. (2006), Spitler et al. (2006), Spitler et al. (2008), Rhode & Zepf (2003), Peng et al. (2004) and Harris et al. (2009).
Although this characteristic may not be common to all galaxies, no case, at present, is known where the halo stars are less concentrated than the GCS. There is also general agreement that the difference between the two radial distributions is real and not caused by a selective bias. Consequently, different hypotheses have been proposed to explain this feature. Among these, two seem the most probable. The first hypothesis is that the difference between the two distributions reflects the different formation ages of the two systems, as suggested by Harris & Racine (1979) and Racine (1991); in their opinion globular clusters formed earlier, when the galaxy mass density distribution was less centrally peaked. Also Forbes et al. (1996) and Ashman & Zepf (1998), on an observational basis, and Bekki & Forbes (2006), on a theoretical basis, suggest that the halo-bulge and the globular cluster components may have been formed independently and thus their profiles should not, initially, be identical. Hydrodynamical simulations performed by Hopkins et al. (2009) suggest, for cuspy ellipticals, that the centre of these objects have been constructed by gaseous dissipation in mergers of gas-rich progenitors. The pre-existing stars (and clusters) should not participate in this dissipation, and instead be transported to greater radii. In this scheme, the merged system would not have identical cluster and stellar distributions.
However, these hypotheses have problems in explaining why the stellar and GCS distributions are usually similar in the outer galactic regions. Of course, there are a few exceptions such as the two giant ellipticals NGC 4472 (M 49) and NGC 4486 (M 87), and the lenticular galaxy NGC 4374 in the Virgo cluster, whose GCS distribution seems to be a more radially extended than the stellar component, while the lenticular galaxy NGC 4406, also in Virgo and close to NGC 4374, has a more steeply declining slope of the GCS radial profile than that of the galactic stellar component. These substantially different behaviours can both be attributed to tidal effects, in the sense that in some galaxies an external perturber may cause a tidal stripping of GCs in the outskirts causing depletion of the outer radial population with a corresponding enrichment of the GCS of the perturbing (likely massive) galaxy. This scheme is sketched in Elmegreen (1999) and has a support by numerical simulations of Forte et al. (1982) and Muzzio (1987). In any case, all of these bright galaxies are located at the centre of the cluster potential well, and their outskirts are noticeably distorted, because of gravitational interactions with other Virgo cluster galaxies and because of material acquired during cannibalistic encounters, so they cannot be considered as representative of the ``average'' elliptical.
Another explanation of the difference between the inner GCS and galactic stellar component radial profiles is based on the simpler assumption of a coeval birth of globular clusters and halo stars and additional evolution of the GCS radial distribution, while the collisionless halo remains almost unchanged.
The GCS evolution is caused by dynamical friction, which causes massive clusters to move very close to the galactic centre, where they are tidally disrupted by interactions with the growing nucleus, as first proposed by Tremaine et al. (1975) for M 31. This view of the galactic nuclei formation was, later, abandoned because approximated evaluations of the dynamical friction time scale for GCs to be confined around the galactic center indicated it was too long to account for a rapid accretion of mass of the central galactic regions (see for instance Fall & Rees 1977 and Lauer & Kormendy 1986, the latter authors referring to M 87). This view has been shown to be erroneous, because it is based on the oversimplified assumption that GCs move on quasi-circular orbits at large distances from the galactic center, where the star density is low and, consequently, so is the dynamical friction braking of even massive galactic satellites. A, more probable, radially biased orbital distribution for GCs significantly shortens the dynamical friction timescale. Additionally, the efficiency of dynamical friction is higher in triaxial galaxies, where box orbits maximize the effect of dynamical friction, as first suggested by Ostriker (1988). We note that box orbits represent a significant fraction of orbits in stable triaxial galaxies; the prototype of self-consistent triaxial models, which was studied by Schwarzschild (1979) by means of his orbital superposition technique, has axial ratios 1:0.625:0.5, contains a large fraction of box orbits, and is stable, as demonstrated by Smith & Miller (1982). The density concentration on and near the long axis of a triaxial figure is provided by the major family of box orbits which thus support the deviation from axial symmetry (Vietri & Schwarzschild 1983).
Also the tidal interaction with a compact nucleus is enhanced in a triaxial potential (Ostriker et al. 1989; Capuzzo-Dolcetta & Tesseri 1997; Capuzzo-Dolcetta & Tesseri 1999; Capuzzo-Dolcetta & Vicari 2005). The combined effects of these dynamical mechanisms act to deplete the GCSs in the central, denser, galactic regions, leaving the outer profile unaltered and similar to the profile of the halo stars; alternatively, when the galaxy interacts significantly with other galaxies, the GCS may radially expand towards outer regions. Based on the hypothesis that the initial GCS and halo-bulge radial distributions were similar, an accurate analysis of the observations would allow us to estimate the number of ``missing clusters'' and therefore the mass removed from the GCSs.
Two objections are often made against the evolutionary scheme. One is
that in
the hypothesis of efficient dynamical friction braking, which acts
differentially
on clusters of different mass, one expects to detect a radial
dependence of the GC
luminosity function, which is not usually observed.
The radial dependence may not necessarily be expected because the two
main
external effects on the GCSs, dynamical friction and tidal disruption,
affect different ends of the mass (luminosity) function leaving the
average value almost unaltered (Capuzzo-Dolcetta & Tesseri
1997). Another
objection is that the observed, usually high,
metallicities of the central galactic regions are incompatible with
the, usually low, metal content of GCs. This objection relies on the
presently observed GC population being representative of the initial
one, which in its massive
(
![]() )
tail should be lost to the inner galactic zone
by strong braking. If the well known mass-metallicity relation indeed
extends to very massive globular cluster scale, it is no surprise that
massive, orbitally decayed GCs are also metal rich.
)
tail should be lost to the inner galactic zone
by strong braking. If the well known mass-metallicity relation indeed
extends to very massive globular cluster scale, it is no surprise that
massive, orbitally decayed GCs are also metal rich.
McLaughlin (1995), Capuzzo-Dolcetta & Vignola (1997), Capuzzo-Dolcetta & Tesseri (1999) and Capuzzo-Dolcetta & Donnarumma (2001), estimated, by scaling the radial surface profiles of the halo stars of a galaxy to that of its GCS, the number of missing globular clusters to be the integral of the difference between the two radial profiles. Capuzzo-Dolcetta & Vignola (1997) and Capuzzo-Dolcetta & Tesseri (1999) suggested that the compact nuclei of the Galaxy, M 31 and M 87, as well as those in many other galaxies, may have accreted many decayed globular clusters in the first few Gyr of their life.
In this paper we extend the comparison of the GCS and star distribution in galaxies, studying eight galaxies for which good photometric data are available in the literature to draw reliable radial profiles.
In Sect. 2 we summarize the way, discussed deeply in previously mentioned papers, to derive, from the comparison of the GCS-stars radial profiles in a galaxy, the number and mass of GCs that have disappeared due to the time evolution of the GCS; in Sect. 3, we present and discuss the observational data, as well as the analytical fit expressions to the density profiles; in Sect. 4, we present the extension, to the data of this work, of the correlation found by Capuzzo-Dolcetta & Donnarumma (2001) between the mass lost by the GCS, the host galaxy luminosity and the mass of the galactic central massive black hole. Finally, in Sect. 5 we summarize our results and draw some general conclusions. An error analysis of the methods used is presented in Appendix A.
2 The estimate of both the number and total mass of globular clusters lost
Based on the hypothesis that the flattening of the GCS distribution in the central regions, compared to the distribution of the stars in the galactic bulge, is caused by the evolution of the GCS, the number of GCs that are accreted inward to the centre of the galaxy is inferred by calculating the simple difference of the (normalized) density profiles integrated over the entire radial range (see McLaughlin 1995). A general discussion of the problems in evaluating the number and mass of missing clusters in this way can be found in Capuzzo-Dolcetta & Vignola (1997), Capuzzo-Dolcetta & Tesseri (1999), and Capuzzo-Dolcetta & Donnarumma (2001), and is not repeated here.
In all cases, apart from NGC 4472, we assume as a fitting
function for the GCS projected radial distribution
in the form of a ``modified core model'', i.e., a law
where
For the galaxy stellar profile, ![]() ,
we rely on the fitting formulas
provided by the authors of the various papers from which we derived the
data, which may change case by case, depending on how good the
approximations are for observed data.
The choice of taking outer radial galaxy stellar profiles from the same
source paper from which we derived the data for the GCS profile was
made for the sake of homogeneity with the GCS profiles because the
galaxy photometry was usually taken with the same instrument, in the
same photometric band, and, probably, in comparable observation
conditions.
We note that this was possible for the external radial profiles of
NGC 1400, NGC 1407, NGC 4374, and
NGC 4636 (the inner distribution was assumed to be core-like),
while for NGC 3258 and NGC 3268 a single law
(modified Hubble's) was adopted across the entire radial extension.
In the two remaining cases, NGC 4406 and NGC 4472, we
selected the most
reliable and recent among the various photometric profiles found in the
literature.
,
we rely on the fitting formulas
provided by the authors of the various papers from which we derived the
data, which may change case by case, depending on how good the
approximations are for observed data.
The choice of taking outer radial galaxy stellar profiles from the same
source paper from which we derived the data for the GCS profile was
made for the sake of homogeneity with the GCS profiles because the
galaxy photometry was usually taken with the same instrument, in the
same photometric band, and, probably, in comparable observation
conditions.
We note that this was possible for the external radial profiles of
NGC 1400, NGC 1407, NGC 4374, and
NGC 4636 (the inner distribution was assumed to be core-like),
while for NGC 3258 and NGC 3268 a single law
(modified Hubble's) was adopted across the entire radial extension.
In the two remaining cases, NGC 4406 and NGC 4472, we
selected the most
reliable and recent among the various photometric profiles found in the
literature.
A check of the sensitivity to the choice of galactic photometry is
found in the discussion of NGC 4636 data (Sect. 3.8).
The ``initial'' distribution of GCs, ![]() ,
is assumed to be
equal in shape to the present stellar profile; consequently, it
can be obtained by a vertical translation of the stellar profile,
,
is assumed to be
equal in shape to the present stellar profile; consequently, it
can be obtained by a vertical translation of the stellar profile,
![]() ,
to match the present GCS distribution (
,
to match the present GCS distribution (
![]() as given by Eq. (1)) in the outer
zone.
We calculate the number of missing (lost) clusters to be the surface
integral of the difference between
as given by Eq. (1)) in the outer
zone.
We calculate the number of missing (lost) clusters to be the surface
integral of the difference between ![]() and
and
![]() over the radial range
over the radial range ![]() where these two profiles differ, where
where these two profiles differ, where ![]() is defined to be the radial coordinate of the intersection of the GCS
and stellar radial profiles
that minimizes, after a vertical shift of the stellar radial profile,
the squared of the difference between the GCS and stellar density
distributions over the range
is defined to be the radial coordinate of the intersection of the GCS
and stellar radial profiles
that minimizes, after a vertical shift of the stellar radial profile,
the squared of the difference between the GCS and stellar density
distributions over the range ![]() .
R is the largest radial distance covered by the
observations (for the values of R, we rely on the
papers from which we derived the GC distribution data).
Consequently, the number of lost clusters is
.
R is the largest radial distance covered by the
observations (for the values of R, we rely on the
papers from which we derived the GC distribution data).
Consequently, the number of lost clusters is
![$\displaystyle N_{\rm l}=2\pi \int_{0}^{r_{\max}}\left[\Sigma_{{\rm GC},0}(r)-\Sigma_{\rm GC}(r) \right]r{\rm d}r.$](/articles/aa/full_html/2009/43/aa12255-09/img18.png)
The present number of GCs, N, is obtained by integrating
The initial number of GCs in a galaxy is, indeed, estimated to
be ![]() .
.
The numerical values of ![]() ,
,
![]() ,
and N are functions of both the fitting parameters
and the integration limits.
These dependences and their contribution to the errors in the final
results are discussed
in Appendix A.
,
and N are functions of both the fitting parameters
and the integration limits.
These dependences and their contribution to the errors in the final
results are discussed
in Appendix A.
An estimate of the mass removed from the GCS (![]() )
can be obtained from the number of GCs lost,
)
can be obtained from the number of GCs lost, ![]() ,
and the estimate of the mean mass of the missing globular clusters,
,
and the estimate of the mean mass of the missing globular clusters, ![]() .
A priori,
the determination of
.
A priori,
the determination of ![]() require
the knowledge of the
initial mass spectrum of the CGS, that has experienced an evolutionary
erosion.
However, the most relevant evolutionary phenomena (tidal shocking and
dynamical friction) act
on opposite sides of the initial mass function, and so we expect that
the mean value of the globular cluster mass has not changed very much
in time (see Capuzzo-Dolcetta & Tesseri
1997
and Capuzzo-Dolcetta & Donnarumma 2001). Hence, we can assume
the present mean value of the mass of globular clusters,
require
the knowledge of the
initial mass spectrum of the CGS, that has experienced an evolutionary
erosion.
However, the most relevant evolutionary phenomena (tidal shocking and
dynamical friction) act
on opposite sides of the initial mass function, and so we expect that
the mean value of the globular cluster mass has not changed very much
in time (see Capuzzo-Dolcetta & Tesseri
1997
and Capuzzo-Dolcetta & Donnarumma 2001). Hence, we can assume
the present mean value of the mass of globular clusters, ![]() ,
to be a good reference value for
,
to be a good reference value for ![]() .
.
For NGC 4374, NGC 4406, and NGC 4636, we
calculated ![]() using
their GC luminosity functions (GCLFs) and assuming the same typical
mass-to-light ratio of GCs in our Galaxy, i.e.,
using
their GC luminosity functions (GCLFs) and assuming the same typical
mass-to-light ratio of GCs in our Galaxy, i.e., ![]() for NGC 4406 and
NGC 4636 or
for NGC 4406 and
NGC 4636 or ![]() (Illingworth 1976)
in the case of NGC 4374. For NGC 4636, we also used
the mass function that represents its present distribution
of GCs (see Sect. 3.8).
For the remaining galaxies (NGC 1400, NGC 1407,
NGC 4472, NGC 3258, and NGC 3268), there is
no more reliable way to estimate the total
mass of ``lost'' GCs than by adopting as a ``fiducial'' reference value
of their
mean mass,
(Illingworth 1976)
in the case of NGC 4374. For NGC 4636, we also used
the mass function that represents its present distribution
of GCs (see Sect. 3.8).
For the remaining galaxies (NGC 1400, NGC 1407,
NGC 4472, NGC 3258, and NGC 3268), there is
no more reliable way to estimate the total
mass of ``lost'' GCs than by adopting as a ``fiducial'' reference value
of their
mean mass, ![]() ,
a value,
,
a value,
![]() ,
which is a reliable estimate of the present mean GC mass in our Galaxy,
as obtainable from their LF (Abraham & Van Den Bergh 1995).
,
which is a reliable estimate of the present mean GC mass in our Galaxy,
as obtainable from their LF (Abraham & Van Den Bergh 1995).
![\begin{figure}
\par\includegraphics[width=12cm,clip]{12255fg1.eps}
\end{figure}](/articles/aa/full_html/2009/43/aa12255-09/img28.png)
|
Figure 1: Surface number density for NGC 1400, NGC 1407, NGC 3258 and NGC 3268. Black squares represent the observed GC distributions; the solid lines are their modified core model fits. The dashed curves are the surface brightness profiles of the underlying galaxy (a power law and a central flat core for NGC 1400 and NGC 1407, and a modified Hubble law for NGC 3258 and NGC 3268), vertically normalized to match the radial profile of the GCS in the outer regions. |
| Open with DEXTER | |
3 Data and results
The data studied in this paper were collected from the literature. We analyse data of a set of 8 galaxies for which the GC content and the radial profile were reliably determined and that are suitable to our purposes.The galaxies are: NGC 1400, NGC 1407, NGC 4472 (M 49), NGC 3268, NGC 3258, NGC 4374, NGC 4406, and NGC 4636. These galaxies add to the set of seventeen galaxies (Milky Way, M 31, M 87, NGC 1379, NGC 1399, NGC 1404, NGC 1427, NGC 1439, NGC 1700, NGC 4365, NGC 4494, NGC 4589, NGC 5322, NGC 5813, NGC 5982, NGC 7626, IC 1459) whose GCS radial profiles were compared with those of previous papers (McLaughlin 1995; Capuzzo-Dolcetta & Vignola 1997; Capuzzo-Dolcetta & Tesseri 1999; Capuzzo-Dolcetta & Donnarumma 2001).
3.1 NGC 1400
The surface density profile of this galaxy is presented by Forbes et al. (2006) (hereafter F06), who fitted it by means of a power law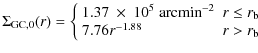
|
(3) |
(see Fig. 1).
Using the general method described in Sect. 2 and the
estimated value ![]() arcmin,
we find that the number of missing clusters in this galaxy is
arcmin,
we find that the number of missing clusters in this galaxy is ![]() ,
i.e., about 71% of the initial population of globular clusters,
,
i.e., about 71% of the initial population of globular clusters,
![]() .
An estimate of the mass lost by the GCS is
.
An estimate of the mass lost by the GCS is
![]() .
.
3.2 NGC 1407
As for NGC 1400, data for both this galaxy and its GCS were
taken from F06.
The luminosity profile of the galactic stars was fitted by a power law,
![]() .
This power law fit is inaccurate in the inner region, where the
luminosity profile exhibits a core of radius
.
This power law fit is inaccurate in the inner region, where the
luminosity profile exhibits a core of radius
![]() arcmin
(Spolaor et al. 2008).
As for NGC 1400,
we thus assume,
for
arcmin
(Spolaor et al. 2008).
As for NGC 1400,
we thus assume,
for ![]() ,
that a flat distribution matches the external power law.
In this case, the GCS modified core model has
,
that a flat distribution matches the external power law.
In this case, the GCS modified core model has
![]() arcmin-2,
arcmin-2,
![]() arcmin, and
arcmin, and ![]() as more suitable parameters.
The normalizing vertical offset of the stellar profile leads to
as more suitable parameters.
The normalizing vertical offset of the stellar profile leads to
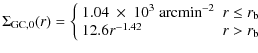
|
(4) |
(see Fig. 1).
Integrating the difference between the GCS ``initial'' and present
radial profiles in the galactic regions where these differ, i.e., up to
![]() arcmin
(see Eq. (2)),
we obtain
arcmin
(see Eq. (2)),
we obtain ![]() .
The present number of GCs
obtained by integrating
.
The present number of GCs
obtained by integrating ![]() in the radial range covered by the observations
(i.e., from 0 to R=7.3 arcmin) is N=314.
The GCS has therefore lost 21% of its initial population,
in the radial range covered by the observations
(i.e., from 0 to R=7.3 arcmin) is N=314.
The GCS has therefore lost 21% of its initial population, ![]() .
.
![\begin{figure}
\par\includegraphics[width=11.5cm,clip]{12255fg2.eps}
\end{figure}](/articles/aa/full_html/2009/43/aa12255-09/img50.png)
|
Figure 2: Surface number density for NGC 4374, NGC 4406, NGC 4472 (M 49) and NGC 4636. Black squares represent the observed GC distributions; the solid lines are their modified core model fit (except for NGC 4472, see Sect. 3.7). The dashed curves are the surface brightness profile of the underlying galaxy (a power law and a central flat core for NGC 4374 and NGC 4636, and a Sersic core model for NGC 4406 and NGC 4472), vertically normalized to match the radial profile of the cluster system in the outer regions. |
| Open with DEXTER | |
In this case, we can evaluate the mass lost by the system to be
![]() .
.
3.3 NGC 3258
The GCS density profile data for this galaxy are discussed by Dirsch, Richtler & Bassino (2003).The closest core model fit is given by the values ![]() arcmin-2,
arcmin-2,
![]() arcmin, and
arcmin, and ![]() .
The stellar luminosity profile, within 5 arcmin, following Dirsch
et al. (2003), is
well represented by another modified core model fitting law.
By mean of the usual procedure, the initial GCS profile is found to be
most accurately described by:
.
The stellar luminosity profile, within 5 arcmin, following Dirsch
et al. (2003), is
well represented by another modified core model fitting law.
By mean of the usual procedure, the initial GCS profile is found to be
most accurately described by:
![$\displaystyle \Sigma_{{\rm GC},0}(r)= \frac{4365}{\left[1+\left(\frac{r}{0.036}\right)^2 \right]^{0.796}}~{\rm arcmin}^{-2}.$](/articles/aa/full_html/2009/43/aa12255-09/img55.png)
|
(5) |
The present number of GCs is N=343 (with R=7.94 arcmin). Performing the surface integral of the difference between the initial and present distribution in the radial range up to
For this galaxy, we obtained ![]() .
.
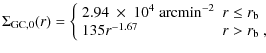
3.4 NGC 3268
As for NGC 3268, the GC distribution of NGC 3258 is taken from Dirsch et la. (2003).
The resulting core model fit parameters have the values ![]() arcmin-2,
arcmin-2,
![]() arcmin and
arcmin and ![]() .
The analytical fit to the luminosity profile (within 5 arcmin) of the
galaxy is, again,
obtained with the same law (modified core model) as used for the
cluster density distribution (Dirsch et al. 2003).
After the vertical translation, we have
.
The analytical fit to the luminosity profile (within 5 arcmin) of the
galaxy is, again,
obtained with the same law (modified core model) as used for the
cluster density distribution (Dirsch et al. 2003).
After the vertical translation, we have
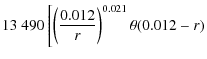
![$\displaystyle \Sigma_{{\rm GC},0} (r)= \frac{13~490}{\left[1+\left(\frac{r}{0.044}\right)^2 \right]^{0.936}}~{\rm arcmin}^{-2}.$](/articles/aa/full_html/2009/43/aa12255-09/img63.png)
Integrating
The number of globular clusters lost is found to be ![]() (from 0 to
(from 0 to ![]() arcmin),
which corresponds to about 55% of the initial
abundance,
arcmin),
which corresponds to about 55% of the initial
abundance, ![]() .
.
As in other cases, also for this galaxy, when evaluating the mean mass
of lost GCs in NCG 3268, we have to assume that ![]() ,
obtaining
,
obtaining ![]() .
.
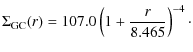
3.5 NGC 4374 (M 84)
Gomez & Richtler (2004) studied the GCS of this giant elliptical galaxy, using photometry in the B and R bands, to determine its radial surface distribution.In this case, contrarily to all the other galaxies discussed
here,
the profile of the GC number density is flatter than that of the
galaxy light (see Fig. 2).
This may be due to tidal interaction with the
nearby NGC 4406 galaxy, which shows, indeed, a sort of
depletion of the outer GC
population.
The best modified core model fit to the GC data is given by
![]() arcmin-2,
arcmin-2,
![]() arcmin, and
arcmin, and ![]() .
.
The galaxy light is characterized by a central core of radius ![]() arcmin
(Lauer et al. 2007); for
arcmin
(Lauer et al. 2007); for ![]() ,
it is well fitted
by the power law
,
it is well fitted
by the power law ![]() (Gomez & Richtler 2004).
Figure 2
shows a clear departure of the GCS from the stellar profile in
the galactic outskirts which is not a surprise because it occurs beyond
the galactic apparent radius (
(Gomez & Richtler 2004).
Figure 2
shows a clear departure of the GCS from the stellar profile in
the galactic outskirts which is not a surprise because it occurs beyond
the galactic apparent radius (![]() 3.1 arcmin, as from NASA/IPAC
Extragalactic Database),
i.e., in a region profoundly contaminated by interaction with the tidal
field
of the inner, crowded, Virgo cluster region.
3.1 arcmin, as from NASA/IPAC
Extragalactic Database),
i.e., in a region profoundly contaminated by interaction with the tidal
field
of the inner, crowded, Virgo cluster region.
The usual normalization infers
|
(7) |
to be the GCS initial radial profile. Integrating our core model to R=11.8 arcmin, we find N=4655 to be the present number of GCs. The usual integration of the difference between the initial and present GC distribution (Eq. (2) with
In the case of NGC 4374, the value of the mean mass
of a GC was evaluated using the GCLF in the R band
given by Gomez & Richtler (2004).
The mean color ![]() of GCs in this galaxy
(Gomez & Richtler 2004)
allows us to estimate the mean B absolute magnitude
and the
mean luminosity of GCs in the B band,
of GCs in this galaxy
(Gomez & Richtler 2004)
allows us to estimate the mean B absolute magnitude
and the
mean luminosity of GCs in the B band, ![]() ,
by assuming that m-M=
31.61 (Gomez & Richtler 2004),
resulting in
,
by assuming that m-M=
31.61 (Gomez & Richtler 2004),
resulting in
![]() (with
(with
![]() ,
Cox 2000).
,
Cox 2000).
Adopting the mass-to-light ratio ![]() obtained
by Illingworth (1976)
for 10 galactic globular clusters,
we find that
obtained
by Illingworth (1976)
for 10 galactic globular clusters,
we find that ![]() and
and
![]() .
.
3.6 NGC 4406 (VCC 881)
NGC 4406 is another giant elliptical in Virgo whose GCS was studied using data acquired by the Mosaic Imager on the 4 m Mayall telescope at the KPNO (Rhode & Zepf 2004) in the B, V, and R bands. The resulting best-fit core model is characterized byThe galaxy star luminosity distribution, according to
Ferrarese et al. (2006),
is well reproduced by a Sersic core model (Trujillo et al. 2004),
i.e., by
![\begin{displaymath}
\Sigma_{\rm s}(r)=\Sigma_{\rm b}\left[ {\left(\frac{r_{\rm b...
...}^{-b_n\left(\frac{r}{r_{\rm e}}\right)^{\frac{1}{n}}}\right],
\end{displaymath}](/articles/aa/full_html/2009/43/aa12255-09/img89.png)
where
For NGC 4406, the parameter values are (Ferrarese
et al. 2006):
![]() ,
n=7.016, bn=13.649,
and
,
n=7.016, bn=13.649,
and ![]() arcsec
(=6.864 arcmin),
arcsec
(=6.864 arcmin), ![]() arcsec (=0.0127 arcmin).
Following a vertical translation, the initial GCS radial profile is
given by
arcsec (=0.0127 arcmin).
Following a vertical translation, the initial GCS radial profile is
given by
|
|
= | 
|
|
| (9) |
In this case we note that, unique to the sample of 8 galaxies examined in this paper, the stellar profile in the external zone decreases more slowly than that of the GCS, probably because of GC stripping from both the companion NGC 4374 and the general tidal field in the dense central Virgo cluster region where NGC 4406 is located.
By integrating the present distribution of GCs from
0 arcmin to R=24 arcmin, we find
that N=2850.
The surface integral given in Eq. (2), with ![]() arcmin, infers the number of globular clusters lost,
arcmin, infers the number of globular clusters lost, ![]() ,
i.e.,
about 32% of the initial GC population (
,
i.e.,
about 32% of the initial GC population (
![]() ).
).
Using the GCLF of this galaxy and its distance modulus m-M=31.12
(Rhode & Zepf 2004),
we evaluated the mean value
of the absolute GC V magnitude, ![]() corresponding to the mean luminosity
corresponding to the mean luminosity ![]() (
(
![]() from Cox 2000).
from Cox 2000).
Assuming ![]() ,
we obtain
,
we obtain ![]() .
This estimate infers the value of the mass lost by the GCS to be
.
This estimate infers the value of the mass lost by the GCS to be ![]() .
.
3.7 NGC 4472 (M 49)
Data of the GC distribution in this giant elliptical galaxy in Virgo were taken from Rhode & Zepf (2001). The galaxy light is well fitted by a Sersic core model (Eq. (8)), whose parameters, determined by Ferrarese et al. (2006), are:In this case, the core model profile does not provide a good
approximation to the observed GCS distribution. A closer fit is given
by one of the family of galaxy models (gamma-models) developed by
Dehnen (1993): ![]() .
Here we assume that
.
Here we assume that ![]() ,
as suggested by Côté et al. (2003). Using
this law, we found that
,
as suggested by Côté et al. (2003). Using
this law, we found that
|
(10) |
After the usual vertical translation, we obtained
|
|
= | 
|
|
| (11) |
Performed with
As for NGC 1400 and NGC 1407, a more robust
estimate of ![]() is not available, so we evaluate
is not available, so we evaluate ![]() to be
to be ![]() .
.
Table 1: GCS radial distribution parameters.
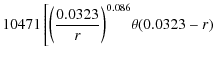
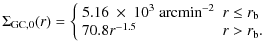
3.8 NGC 4636
The GC content of this galaxy was studied by Kissler Patig et al. (1994). The modified core model fit hasThe galactic light profile shows an inner flat distribution
(a core with radius ![]() arcmin
Lauer et al. 2007),
while for
arcmin
Lauer et al. 2007),
while for ![]() the light distribution is well fitted by the power-law fit
the light distribution is well fitted by the power-law fit ![]() (Kissler Patig et al. 1994).
(Kissler Patig et al. 1994).
Table 2: Galactic luminosity fitting parameters.
Table 3: Deduced parameters for the various GCSs.
The vertical translation of the stellar profile gives the initial GCS
profile:
|
Integrating the present surface density profile of the GCS to R=6.6 arcmin, we obtain N=1411. Performing the surface integral given in Eq. (2) (with
The average of our ![]() and
and ![]() values gives
values gives ![]() .
.
To provide some insight into the effects of using different photometry
for the galaxy stellar profile, we adopted for the whole radial
extension
of NGC 4636 the ``Nuker'' stellar profile given in Lauer
et al. (2007)
and re-evaluated the ![]() value. In this way, we obtained
value. In this way, we obtained ![]() (compared
the previous value of 645) with
(compared
the previous value of 645) with ![]() arcmin
(previously 4.75 arcmin), where a
arcmin
(previously 4.75 arcmin), where a ![]() relative variation.
relative variation.
Tables 1 and 2 summarize the parameters of the radial-profile fitting functions for the studied galaxies, while Table 3 presents the results in terms of the estimated number and mass of GCs lost.
For the error estimates of Table 3 (see Appendix
A),
we note that a ![]() error in
error in ![]() contributes between
contributes between
![]() (NGC 1400)
and
(NGC 1400)
and ![]() (NGC 1407) to the total error.
For the greatest difference in the slope of the external GCS
and stellar profiles (NGC 4374), the contribution of a
(NGC 1407) to the total error.
For the greatest difference in the slope of the external GCS
and stellar profiles (NGC 4374), the contribution of a ![]() indeterminacy in
indeterminacy in ![]() corresponds to
corresponds to ![]() of the total error.
of the total error.
Table 4: Integrated magnitudes and central black hole masses for a set of galaxies for which the estimate of the mass lost from their GCSs is known.
![\begin{figure}
\par\mbox{\includegraphics[width=5.9cm,clip]{12255fg3a.eps}\hspace*{2mm}
\includegraphics[width=5.9cm,clip]{12255fg3b.eps} }\end{figure}](/articles/aa/full_html/2009/43/aa12255-09/img214.png)
|
Figure 3: The correlation between the GCS (logarithmic) mass lost and the central galactic black hole mass ( left panel) and integrated V magnitude of the host galaxy ( right panel) for the set of galaxies in Table 4. Masses are in solar masses. Black circles represent the eight galaxies whose GCS data are discussed in this paper, black triangles refer to the others. The straight lines and curves are the approximation fits discussed in Sect. 4. |
| Open with DEXTER | |
4 The correlation between  ,
,
 ,
and
,
and 
The evolutionary explanation of the difference between the initial and
present GC
distribution implies a correlation between the (supposed) mass lost by
GCS,
with the mass of the galactic central supermassive black hole (
![]() )
and, probably,
with the host galaxy luminosity (MV).
Table 4
reports the whole set of galaxies
for which we have the estimate of MV,
)
and, probably,
with the host galaxy luminosity (MV).
Table 4
reports the whole set of galaxies
for which we have the estimate of MV,
![]() ,
and
,
and ![]() .
.
Figure 3
shows a plot of the data given in Table 4.
For some galaxies, two estimates of MV
and/or ![]() were available.
In these cases, we took from Table 4 the entries in
the first of the two rows to plot in Fig. 3.
The figure clearly indicates an increasing trend of
were available.
In these cases, we took from Table 4 the entries in
the first of the two rows to plot in Fig. 3.
The figure clearly indicates an increasing trend of ![]() as function
of
as function
of ![]() (left panel) and of MV
(right panel).
(left panel) and of MV
(right panel).
In particular, the linear fit of data in the left panel is given
by ![]() with
with ![]() and
and
![]() ,
giving
,
giving ![]() .
The alternative, exponential fit gives
.
The alternative, exponential fit gives
![]() ,
where
,
where ![]() and
and
![]() and
and ![]() .
.
For the 9 galaxies for which alternative data are available
we re-evaluated the linear and exponential fit to data using the
second row values in Table 4, obtaining
![]() and
and ![]() ,
where
,
where ![]() for the linear fit, and then for the exponential fit,
for the linear fit, and then for the exponential fit,
![]() and
and
![]() ,
where
,
where ![]() .
The differences between the fit coefficients are insignificant.
.
The differences between the fit coefficients are insignificant.
The least squares, straight-line, fit to the whole set of data shown in
the right
panel of Fig. 3
is given by ![]() ,
where
,
where ![]() and
and
![]() providing
providing ![]() .
The
exponential fit to the same data gives
.
The
exponential fit to the same data gives ![]() , where
, where
![]() and
and
![]() and
and ![]() .
As before, we re-evaluated the linear and exponential fits using the
second set of entries for the galaxies with two evaluations in
Table 4
and found that
.
As before, we re-evaluated the linear and exponential fits using the
second set of entries for the galaxies with two evaluations in
Table 4
and found that ![]() and
and ![]() ,
giving
,
giving ![]() ,
provided the tightest
linear fit, and that
,
provided the tightest
linear fit, and that ![]() and
and
![]() and
and ![]() ,
provided the tightest exponential fit.
,
provided the tightest exponential fit.
![\begin{figure}
\par\includegraphics[width=9cm,clip]{12255fg4.eps}
\end{figure}](/articles/aa/full_html/2009/43/aa12255-09/img242.png)
|
Figure 4: The correlation between the logarithm of the central galactic black hole mass (in solar masses) and the integrated V galactic magnitude (see Table 4). |
| Open with DEXTER | |
In the right panel of Fig. 3
the correlation between ![]() and MV
reflects both an expected physical
dependence of evolutionary processes acting
on GCSs on the total galactic mass and, more simply, the positive
correlation between
and MV
reflects both an expected physical
dependence of evolutionary processes acting
on GCSs on the total galactic mass and, more simply, the positive
correlation between ![]() and MV
for the same set
of galaxies. The
and MV
for the same set
of galaxies. The ![]() -MV
correlation for the set of galaxies in Table 4 clearly has a
positive slope, as also shown by the least squares fit in Fig. 4. The least
square fit is
-MV
correlation for the set of galaxies in Table 4 clearly has a
positive slope, as also shown by the least squares fit in Fig. 4. The least
square fit is
![]() with
with ![]() and
and
![]() ,
giving
,
giving ![]() .
When using the alternative entries in Table 4, the fit
coefficients
transform into
.
When using the alternative entries in Table 4, the fit
coefficients
transform into ![]() and
and
![]() ,
giving
,
giving ![]() .
.
On the astrophysical side, Capuzzo-Dolcetta & Tesseri (1999) demonstrated how a correlation between GCS radial profiles and the parent galaxy luminosity is expected for the larger tidal disturbance caused by a more massive compact central nucleus in the galaxy, which erodes the GC distribution peaked at the galactic centre by means of frictionally decayed massive clusters.
5 Conclusions
We have presented a comparative discussion of the radial distributions of the globular cluster systems and of stars in eight elliptical galaxies observed by various authors. We found that GCS distributions flatten towards the centre, showing a broad core in the profile, in contrast to the surrounding star field. This result agrees with many previous findings, indicating, indeed, that GCs are usually less centrally concentrated than the stars of the galaxy bulge-halo. A debate remains open on the interpretation of this observational issue. The ``evolutionary'' interpretation is particularly appealing; it claims that, initially, the GCS and stellar profiles were similar and, later, GCS evolved to the presently flatter distribution because of dynamical friction and tidal interactions (Capuzzo-Dolcetta 1993). In this picture, the flatter central profile is caused by the erosion of the inner GCS radial profile. Many GCs are, consequently, packed into the inner galactic region, where they influence the physics of the host galaxy. Many galaxies studied so far have massive black holes at their centres, whose mass positively correlates with our estimates of the number and mass of GCs lost. This provides a strong support of the validity of the aforementioned evolutionary scenario, together with the other clear correlations between number and mass of GC lost and their parent galaxy luminosity. In the light of these encouraging findings, we propose that much effort should be devoted towards improving the observational tests of this astrophysical scenario.Appendix A: The formal error in the estimate of the number of lost GCs
We describe how we evaluated the errors in GCs lost, ![]() ,
given in Table 3.
As explained in Sect. 2,
the number of GCs lost in the galaxies of the sample was evaluated as
the integral of the difference between the (estimated) initial and
present GCS radial distributions over the radial range
,
given in Table 3.
As explained in Sect. 2,
the number of GCs lost in the galaxies of the sample was evaluated as
the integral of the difference between the (estimated) initial and
present GCS radial distributions over the radial range
![]() where the two profiles differ.
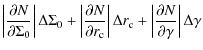
The absolute errors in
where the two profiles differ.
The absolute errors in ![]() (
(
![]() )
are given by the sum of the error in
)
are given by the sum of the error in ![]() (
(
![]() )
and the error on N (
)
and the error on N (![]() ), yielding the relative error
), yielding the relative error
![]() of
Table 3.
We estimate
of
Table 3.
We estimate ![]() and
and ![]() as follows:
as follows:
(i) To estimate of ![]() ,
for all galaxies, except for NGC 4472, the number
,
for all galaxies, except for NGC 4472, the number ![]() is given by
is given by
![$\displaystyle 2\pi\Sigma_0\int_{r_{\min}}^{r_{\max}}\frac{r} {\left[1+\left(\frac{r}{r_{\rm c}}\right)^2\right]^{\gamma}}{\rm d}r$](/articles/aa/full_html/2009/43/aa12255-09/img257.png)
![$\displaystyle \left.\frac{\Sigma_0\pi(r^2+r_{\rm c}^2)}{(1-\gamma)\left[1+\left(\frac{r} {r_{\rm c}}\right)^2\right]^{\gamma}}\right\vert^{r_{\max}}_{r_{\min}},$](/articles/aa/full_html/2009/43/aa12255-09/img258.png)
which is a function of the parameters
where
![\begin{displaymath}\frac{\partial{N}}{\partial{\Sigma_0}}=2 \pi\int_{r_{\min}}^{...
...} \right)^2\right]^{\gamma}}\right\vert^{r_{\max}}_{r_{\min}},
\end{displaymath}](/articles/aa/full_html/2009/43/aa12255-09/img263.png)
|
(A.3) |
|
|
= | ![$\displaystyle \int_{r_{\min}}^{r_{\max}}\frac{4\pi \Sigma_0 \gamma r^3}{r_{\rm c}^3\left[1+\left(\frac{r}{r_{\rm c}} \right)^2\right]^{(1+\gamma)}}{\rm d}r$](/articles/aa/full_html/2009/43/aa12255-09/img265.png)
|
|
| = | ![$\displaystyle -\left.\frac{2\pi\Sigma_0(r_{\rm c}^2+\gamma r^2)}{r_{\rm c}(\gam...
...frac{r}{r_{\rm c}}\right)^2\right]^{\gamma}}\right\vert ^{r_{\max}}_{r_{\min}},$](/articles/aa/full_html/2009/43/aa12255-09/img266.png)
|
(A.4) |
|
|
= | ![$\displaystyle -2 \pi \Sigma_0 \int_{r_{\min}}^{r_{\max}}r\left[1+\left(\frac{r}...
...2\right]^{- \gamma}\ln\left[1+\left(\frac{r}{r_{\rm c}}\right)^2\right]{\rm d}r$](/articles/aa/full_html/2009/43/aa12255-09/img268.png)
|
|
| = | ![$\displaystyle \left.\frac{\pi \Sigma_0 (r^2+r_{\rm c}^2)\left\{1+(\gamma-1)\ln\...
...frac{r}{r_{\rm c}}\right)^2\right]^{\gamma}}\right\vert ^{r_{\max}}_{r_{\min}},$](/articles/aa/full_html/2009/43/aa12255-09/img269.png)
|
(A.5) |
![\begin{displaymath}\frac{\partial{N}}{\partial{r_{\min}}}=-2\pi\Sigma_0
\frac{r_...
...1+\left(\frac{r_{\min}}{r_{\rm c}} \right)^2\right]^{\gamma}},
\end{displaymath}](/articles/aa/full_html/2009/43/aa12255-09/img270.png)
|
(A.6) |
(where we assume that
![\begin{displaymath}
\frac{\partial{N}}{\partial{{r_{\max}}}}=
2\pi\Sigma_0\frac{...
...left(\frac{r_{\max}}{r_{\rm c}}\right)^2\right]^{\gamma}}\cdot
\end{displaymath}](/articles/aa/full_html/2009/43/aa12255-09/img272.png)
For NGC 4472 we have that:
|
|
= | ![$\displaystyle 2\pi\Sigma_0\int_{r_{\min}}^{r_{\max}} \left(\frac{r_{\rm c}}{r}\right)^{\gamma}\frac{r}{\left[1+\frac{r}{r_{\rm c}} \right]^{4-\gamma}}{\rm d}r$](/articles/aa/full_html/2009/43/aa12255-09/img273.png)
|
|
| = | (A.8) |
This is a function of the parameters
|
|
= | ||

|
(A.9) |
where
|
|
= | ![$\displaystyle 2\pi\int_{r_{\min}}^{r_{\max}} \left(\frac{r_{\rm c}}{r}\right)^{\gamma}\frac{r}{\left[1+\frac{r}{r_{\rm c}} \right]^{4-\gamma}}{\rm d}r$](/articles/aa/full_html/2009/43/aa12255-09/img278.png)
|
|
| = | (A.10) |
|
|
= | 
|
|
![$\displaystyle \left.+\gamma\left(\frac{r_{\rm c}}{r}\right)^{\gamma-1}\left(1+\frac{r}{r_{\rm c}} \right)^{\gamma-4}\right]{\rm d}r$](/articles/aa/full_html/2009/43/aa12255-09/img281.png)
|
|||
| = | 
|
||
| (A.11) |
and
|
|
= | 
|
|
| = | 
|
||
| (A.12) |
![$\displaystyle \frac{\partial{N}}{\partial{r_{\min}}}=- 2\pi\Sigma_0\left(\frac{...
...{\gamma}\frac{r_{\min}}{\left[1+\frac{r_{\min}}{r_{\rm c}} \right]^{4-\gamma}},$](/articles/aa/full_html/2009/43/aa12255-09/img287.png)
![$\displaystyle \frac{\partial{N}}{\partial{{r_{\max}}}}=
2\pi\Sigma_0\left(\frac...
...mma}\frac{r_{\max}} {\left[1+\frac{r_{\max}}{r_{\rm c}}\right]^{4-\gamma}}\cdot$](/articles/aa/full_html/2009/43/aa12255-09/img288.png)
|
(A.14) |
The fitting parameters used to calculate
(ii) To estimate ![]() ,
the fitting formulas for the initial distribution of GCs changed for
the various galaxies studied.
,
the fitting formulas for the initial distribution of GCs changed for
the various galaxies studied.
For NGC 1400, NGC 1407, NGC 4374, and
NGC 4636, we have (see Sects. 3.1, 3.2,
3.5, 3.8 and
Table 2
for the meanings and the values of the parameters)
In Eq. (A.15),
The error ![]() is thus given by
is thus given by
|
|
= | ||
|
(A.16) |
where
|
|
= | 
|
|
| = | 
|
(A.17) |
|
(A.18) |
|
|
= | ||
| = | ![$\displaystyle \left.-2\pi r_{\rm b}^{-\alpha}r^2\ln(r_{\rm b})\right\vert^{r_{\...
... + [ \alpha-2]\ln(r)\right\}} {(\gamma-2)^2}\right\vert^{r_{\max}}_{r_{\rm b}},$](/articles/aa/full_html/2009/43/aa12255-09/img301.png)
|
(A.19) |
In this case, we also assumed that
For M 49 and NGC 4406 (Sects. 3.7 and 3.6), we have
![$\displaystyle +~\left.\textrm{e}^{b_n\left[\left(\frac{r_{\rm b}}{r_{\rm e}}\ri...
...{\rm e}}\right)^{\frac{1}{n}}\right]}\theta(r-r_{\rm b})\right \rbrace {\rm d}r$](/articles/aa/full_html/2009/43/aa12255-09/img308.png)
![$\displaystyle \left.\frac{2\pi\eta}{2-\gamma}r^2
\left(\frac{r_{\rm b}}{r}\righ...
...^{\frac{1}{n}}
-\left(\frac{r}{r_{\rm e}}\right)^{\frac{1}{n}}
\right]}{\rm d}r$](/articles/aa/full_html/2009/43/aa12255-09/img309.png)
where bn=1.992 n-0.3271. The second row of the previous expression is justified by that, for both M 49 and NGC 4406,
|
|
= | ||
| (A.23) |
where
![$\displaystyle 2\pi\int_{r_{\min}}^{r_{\rm b}}r\left(\frac{r_{\rm b}}{r}\right)^...
...^{\frac{1}{n}}
-\left(\frac{r}{r_{\rm e}}\right)^{\frac{1}{n}}
\right]}{\rm d}r$](/articles/aa/full_html/2009/43/aa12255-09/img314.png)
![$\displaystyle \left.\frac{2\pi}{2-\gamma}r^2\left(\frac{r_{\rm b}}{r}\right)^\g...
...{\frac{1}{n}}
-\left(\frac{r}{r_{\rm e}}\right)^{\frac{1}{n}}
\right]}{\rm d}r,$](/articles/aa/full_html/2009/43/aa12255-09/img315.png)
![\begin{displaymath}\frac{\partial{N_{\rm i}}}{\partial b_n}=2 \pi \eta \int_{r_{...
...left(\frac{r}{r_{\rm e}}\right)^{\frac{1}{n}}\right] {\rm d}r,
\end{displaymath}](/articles/aa/full_html/2009/43/aa12255-09/img316.png)
|
(A.25) |
![$\displaystyle +~ 2 \pi \frac{\eta b_n}{n r_{\rm e}} \int_{r_{\rm b}}^{r_{\max}}...
...}{n}}
\right]}
\left(\frac{r_{\rm b}}{r_{\rm e}}\right)^{\frac{1}{n}-1}{\rm d}r$](/articles/aa/full_html/2009/43/aa12255-09/img319.png)
![$\displaystyle +~2 \pi \frac{\eta b_n}{n r_{\rm e}} \int_{r_{\rm b}}^{r_{\max}} ...
...}{n}}
\right]}\left(\frac{r_{\rm b}}{r_{\rm e}}\right)^{\frac{1}{n}-1}{\rm d}r,$](/articles/aa/full_html/2009/43/aa12255-09/img321.png)
|
|
= | 
|
|
| = | ![$\displaystyle \left.\frac{2\pi \eta r^2}{(\gamma-2)^2}\left(\frac{r_{\rm b}}{r}...
...a)
\ln\left(\frac{r_{\rm b}}{r}\right)\right]\right\vert^{r_{\rm b}}_{r_{\min}}$](/articles/aa/full_html/2009/43/aa12255-09/img324.png)
|
(A.27) |
|
|
= | ![$\displaystyle -2 \pi \frac{\eta b_n}{n r_{\rm e}^2} \int_{r_{\rm b}}^{r_{\max}}...
... \right)^{\frac{1}{n}}
-\left(\frac{r}{r_{\rm e}}\right)^{\frac{1}{n}}
\right]}$](/articles/aa/full_html/2009/43/aa12255-09/img326.png)
|
|
![$\displaystyle ~\times~\left[r_{\rm b}\left(\frac{r_{\rm b}}{r_{\rm e}}\right)^{\frac{1}{n}-1}-r
\left(\frac{r}{r_{\rm e}}\right)^{\frac{1}{n}-1}\right]{\rm d}r,$](/articles/aa/full_html/2009/43/aa12255-09/img327.png)
|
(A.29) |
![$\displaystyle -2 \pi \frac{\eta b_n}{n^2} \int_{r_{\rm b}}^{r_{\max}} r\textrm{...
... \right)^{\frac{1}{n}}
-\left(\frac{r}{r_{\rm e}}\right)^{\frac{1}{n}}
\right]}$](/articles/aa/full_html/2009/43/aa12255-09/img329.png)
![$\displaystyle \times~\left[\left(\frac{r_{\rm b}}{r_{\rm e}}\right)^{\frac{1}{n...
...rm e}}\right)^{\frac{1}{n}}\ln\left(\frac{r}{r_{\rm e}}\right) \right]{\rm d}r.$](/articles/aa/full_html/2009/43/aa12255-09/img330.png)
Remembering that, for both NGC 4472 and NGC 4406,
![\begin{displaymath}\frac{\partial{N_{\rm i}}}{\partial{r_{\min}}}=-2\pi \eta r_{...
...frac{r_{\min}}{r_{\rm e}}\right)^{\frac{1}{n}}\right]\right\},
\end{displaymath}](/articles/aa/full_html/2009/43/aa12255-09/img331.png)
|
(A.30) |
![\begin{displaymath}
\frac{\partial{N_{\rm i}}}{\partial{{r_{\max}}}}=2\pi \eta r...
...{r_{\max}}{r_{\rm e}}\right)^{\frac{1}{n}}\right]\right\}\cdot
\end{displaymath}](/articles/aa/full_html/2009/43/aa12255-09/img332.png)
See Table 2 for the values of the parameters used in Eqs. (A.22)-(A.31).
Finally, for NGC 3268 and NGC 3258 (see Sect. 3.4, Sect. 3.3 and Table 2 for values of the parameters), we have the same equations obtained for the present profile of all the galaxies, except NGC 4472 (see Eq. (A.1)-(A.7)). All the integrals from Eq. (A.22) to Eq. (A.29) must be calculated numerically using the values of the parameters given in Table 2.
The results listed in Table 3 are obtained by assuming an
error
of 1% in each independent parameter used.
Only in the case of NGC 4472, where we assumed ![]() (Côté et al. 2003),
we could not consider a value for
(Côté et al. 2003),
we could not consider a value for
![]() obtained by a fixed percentual variation
and, thus, we adopted
obtained by a fixed percentual variation
and, thus, we adopted ![]() .
.
References
- Abraham, R. G., & Van Den Bergh, S. 1995, ApJ, 438, 218 [CrossRef] [NASA ADS]
- Ashman K. M., & Zepf, S. E. 1998, Globular Cluster Systems, Cambridge astrophysics series, 30 (Cambridge University Press, New York)
- Balmaverde B., & Capetti, A. 2006, A&A, 447, 97 [EDP Sciences] [CrossRef] [NASA ADS], BC06
- Bassino, L. P., Faifer, F. R., Forte, J. C., et al. 2006, A&A, 451, 789 [EDP Sciences] [CrossRef] [NASA ADS]
- Bekki K., & Forbes, D. A. 2006, A&A, 445, 485 [EDP Sciences] [CrossRef] [NASA ADS]
- Bertin G., Ciotti, L., & Del Principe, M. 2002, A&A, 386, 149 [EDP Sciences] [CrossRef] [NASA ADS]
- Capetti A., & Balmaverde, B. 2005, A&A, 440, 73 [EDP Sciences] [CrossRef] [NASA ADS]
- Capuzzo Dolcetta, R. 1993 ApJ, 415, 616
- Capuzzo Dolcetta, R. 2002, ASP Conf. Ser., vol. 285, 389
- Capuzzo Dolcetta, R., & Donnarumma, I. 2001, MNRAS, 328, 645 [CrossRef] [NASA ADS]
- Capuzzo Dolcetta, R., & Tesseri, A. 1997, MNRAS, 292, 808 [NASA ADS], CDT99
- Capuzzo Dolcetta, R., & Tesseri, A. 1999, MNRAS, 308, 961 [CrossRef] [NASA ADS]
- Capuzzo Dolcetta, R., & Vicari, A. 2005, MNRAS, 356, 899 [CrossRef] [NASA ADS]
- Capuzzo Dolcetta, R., & Vignola, L. 1997, A&A, 327, 130 [NASA ADS], CD97
- Carter D., & Jenkins, C. R. 1993, MNRAS, 263, 1049 [NASA ADS], CJ93
- Côté P., McLaughlin, D. E., Cohen, J. G., & Blakeslee, J. P., ApJ 2003, 591, 850
- Cox A. N. 2000, Allen's Astrophysical Quantities, 4th edn. (Springer-Verlag)
- Dehnen, W. 1993, MNRAS, 265, 250 [NASA ADS]
- Dirsch B., Richtler T., & Bassino L. P. 2003, A&A, 408, 929 [EDP Sciences] [CrossRef] [NASA ADS], D03
- Eisenhauer F., Genzel, R., Alexander, T., et al. 2005, ApJ, 628, 246 [CrossRef] [NASA ADS], E05
- Elmegreen B. 1999, Ap&SS, 269-270, 469 [CrossRef] [NASA ADS]
- Fall S. M., & Rees, M. J. 1977, MNRAS, 181, 37 [NASA ADS]
- Ferrarese L., & Ford H. 2005, SSRv, 116, 523 [NASA ADS], Fe05
- Ferrarese L., Côté, P., Jordán, A., et al. 2006, ApJ, 164, 334 [CrossRef] [NASA ADS]
- Forbes D. A., Franx, M., Illingworth, G. D., & Carollo, C. M. 1996, ApJ, 467, 126 [CrossRef] [NASA ADS]
- Forbes D. A., Sanchez- Blazquez, P., Phan, A. T. T., et al. 2006, MNRAS, 366, 1230 [NASA ADS], F06
- Forte J. C., Martinez, R. E., & Muzzio, J. C. 1982, AJ, 87, 1465 [CrossRef] [NASA ADS]
- Gómez M., & Richtler, T. 2004, A&A, 415, 499 [EDP Sciences] [CrossRef] [NASA ADS], GR04
- Gebhardt, K., Lauer, T. R., Pinkney, J., et al. 2007, 671, 1321, GE07
- Goudfrooij P., Schweizer, F., Gilmore, D., & Whitmore, B. C. 2007, AJ, 133, 2737 [CrossRef] [NASA ADS]
- Harris, W. E., Kavelaars, J. J., Hanes, D. A., Pritchet, C. J., & Baum, W. A. 2009, AJ, 137, 3314 [CrossRef] [NASA ADS]
- Harris W. E., & Racine, R. 1979, ARA&A, 17, 241 [CrossRef] [NASA ADS]
- Hopkins P. F., Cox, T. J., Dutta, S. N., et al. 2009, ApJS, 181, 135 [CrossRef] [NASA ADS]
- Illingworth G. 1976, ApJ, 204, 73 [CrossRef] [NASA ADS]
- Kissler M., Richtler, T., Held, E. V., et al. 1994, A&A, 287, 463 [NASA ADS], KR94
- Lauer T. R., Gebhardt K., Faber S. M., et al. 2007, ApJ, 664, 226 [CrossRef] [NASA ADS]
- Kormendy J., & Bender, R. 2009, ApJ, 691, L142 [CrossRef] [NASA ADS], KB09
- Lauer T. R. & Kormendy, J. J. 1986, ApJ Lett., 303, 1 [CrossRef] [NASA ADS]
- Lee, M. G., Park, H. S., Kim, E., et al. 2008, ApJ, 682, 135 [CrossRef] [NASA ADS]
- Magorrian J., Tremaine, S., Richstone, D., et al. 1998, AJ, 115, 2285 [CrossRef] [NASA ADS], M98
- McLaughlin D. E. 1995, AJ, 109, 2034 [CrossRef] [NASA ADS]
- Muzzio J. C. 1987, PASP, 99, 245 [CrossRef] [NASA ADS]
- Ostriker J. P. 1988, in The Harlow Shapley Symposium on Globular Cluster Systems in Galaxies (Dordrecht: Kluwer Academic Publishers), IAU Symp., 126, 271
- Ostriker J. P., Binney, J., & Saha, P. 1989, MNRAS, 241, 849 [NASA ADS]
- Peng, E. W., Ford, H. C., & Freeman, K. C. 2004, ApJ, 602, 705 [CrossRef] [NASA ADS]
- Prugniel P., & Simien F. 1996, A&A, 309, 749 [NASA ADS]
- Rhode, K. L., & Zepf, S. E. 2001 AJ, 121 , 210
- Rhode, K. L., & Zepf, S. E. 2003, AJ, 126, 2307 [CrossRef] [NASA ADS]
- Rhode K. L., & Zepf, S. E. 2004, AJ, 127, 302 [CrossRef] [NASA ADS], RZ04
- Rhode, K. L., Katherine, L., Zepf, S. E., Kundu, A., & Larner, A. N. 2007, AJ, 134, 1403 [CrossRef] [NASA ADS]
- Richstone D., Ajhar, E. A., Bender, R., et al. 1998, Nature, 395, A14 [NASA ADS], R98
- Schwarzschild, M. 1979, ApJ, 232, 236 [CrossRef] [NASA ADS]
- Sikkema, G., Peletier, R. F., D.Carter, Valentijn, E. A., & Balcells, M. 2006, A&A, 458, 53 [EDP Sciences] [CrossRef] [NASA ADS]
- Smith B. F., & Miller, R. H. 1982, Ap. J. 257, 103
- Spitler, L. R., Forbes, D. A., Strader, J., Brodie, J. P., & Gallagher, J. S. 2008, MNRAS, 385, 361 [CrossRef] [NASA ADS]
- Spitler L. R., Larsen, S. S., Strader, J., et al. 2006, AJ, 132, 1593 [CrossRef] [NASA ADS]
- Spolaor Ma., Forbes D. A., Hau G. K. T., Proctor R. N., & Brough S. 2008, MNRAS, 385, 667 [CrossRef] [NASA ADS]
- Tremaine, S., Gebhardt, K., Bender, R., et al. 2002, ApJ, 574, 740 [CrossRef] [NASA ADS], TR02
- Tremaine S. D., Ostriker, J. P., & Spitzer, L., Jr. 1975, ApJ, 196, 407 [CrossRef] [NASA ADS]
- Trujillo I., Erwin, P., Asensio Ramos, A., & Graham, A. W. 2004, AJ, 127, 1917 [CrossRef] [NASA ADS]
- Van der Marel, R. P. 1999, ApJ, 117, 744 [NASA ADS], VM99
- Verdoes G., Van der Marel, R. P., Carollo, C. M., & de Zeeuw, P. T. 2000, AJ, 120, 1221 [CrossRef] [NASA ADS], VV00
- Vietri M., & Schwarzschild, M. 1983, ApJ, 269, 487 [CrossRef] [NASA ADS]
- Zhang Z., Xu, H., Wang, Y., et al. 2007, ApJ, 656, 805 [CrossRef] [NASA ADS], Z07
All Tables
Table 1: GCS radial distribution parameters.
Table 2: Galactic luminosity fitting parameters.
Table 3: Deduced parameters for the various GCSs.
Table 4: Integrated magnitudes and central black hole masses for a set of galaxies for which the estimate of the mass lost from their GCSs is known.
Current usage metrics show cumulative count of Article Views (full-text article views including HTML views, PDF and ePub downloads, according to the available data) and Abstracts Views on Vision4Press platform.
Data correspond to usage on the plateform after 2015. The current usage metrics is available 48-96 hours after online publication and is updated daily on week days.
Initial download of the metrics may take a while.