| Issue |
A&A
Volume 506, Number 1, October IV 2009
The CoRoT space mission: early results
|
|
|---|---|---|
| Page(s) | 57 - 67 | |
| Section | Stellar structure and evolution | |
| DOI | https://doi.org/10.1051/0004-6361/200911713 | |
| Published online | 19 May 2009 | |
The CoRoT space mission: early results
Theoretical amplitudes and lifetimes of non-radial solar-like oscillations in red giants
M.-A. Dupret1,2 - K. Belkacem2,1 - R. Samadi1 - J. Montalban2 - O. Moreira2 - A. Miglio2 - M. Godart2 - P. Ventura3 - H.-G. Ludwig![]() ,4 - A. Grigahcène5 - M.-J. Goupil1 - A. Noels2 - E. Caffau4
,4 - A. Grigahcène5 - M.-J. Goupil1 - A. Noels2 - E. Caffau4
1 - LESIA, Observatoire de Paris, CNRS UMR 8109, Université Paris Diderot, 5 place J. Janssen, 92195 Meudon, France
2 - Institut d'Astrophysique et de Géophysique de l'Université de Liège, Allée du 6 Août 17, 4000 Liège, Belgium
3 - INAF - Osservatorio Astronomico di Roma, MontePorzio Catone (RM), Italy
4 -
GEPI, Observatoire de Paris, CNRS, Université Paris Diderot, 92195 Meudon Cedex, France
5 - Centro de Astrofisica da Universidade do Porto, Rua das Estrelas, 4150-762 Porto, Portugal
Received 23 January 2009 / Accepted 3 April 2009
Abstract
Context. Solar-like oscillations have been observed in numerous red giants from ground and from space. An important question arises: could we expect to detect non-radial modes probing the internal structure of these stars?
Aims. We investigate under what physical circumstances non-radial modes could be observable in red giants; what would be their amplitudes, lifetimes and heights in the power spectrum (PS)?
Methods. Using a non-radial non-adiabatic pulsation code including a non-local time-dependent treatment of convection, we compute the theoretical lifetimes of radial and non-radial modes in several red giant models. Next, using a stochastic excitation model, we compute the amplitudes of these modes and their heights in the PS.
Results. Distinct cases appear. Case A corresponds to subgiants and stars at the bottom of the ascending giant branch. Our results show that the lifetimes of the modes are mainly proportional to the inertia I, which is modulated by the mode trapping. The predicted amplitudes are lower for non-radial modes. But the height of the peaks in the PS are of the same order for radial and non-radial modes as long as they can be resolved. The resulting frequency spectrum is complex. Case B corresponds to intermediate models in the red giant branch. In these models, the radiative damping becomes high enough to destroy the non-radial modes trapped in the core. Hence, only modes trapped in the envelope have significant heights in the PS and could be observed. The resulting frequency spectrum of detectable modes is regular for ![]() and 2, but a little more complex for
and 2, but a little more complex for ![]() modes because of less efficient trapping. Case C corresponds to models of even higher luminosity. In these models the radiative damping of non-radial modes is even larger than in the previous case and only radial and non-radial modes completely trapped in the envelope could be observed. The frequency pattern is very regular for these stars. The comparison between the predictions for radial and non-radial modes is very different if we consider the heights in the PS instead of the amplitudes. This is important as the heights (not the amplitudes) are used as detection criterion.
modes because of less efficient trapping. Case C corresponds to models of even higher luminosity. In these models the radiative damping of non-radial modes is even larger than in the previous case and only radial and non-radial modes completely trapped in the envelope could be observed. The frequency pattern is very regular for these stars. The comparison between the predictions for radial and non-radial modes is very different if we consider the heights in the PS instead of the amplitudes. This is important as the heights (not the amplitudes) are used as detection criterion.
Key words: stars: oscillations - stars: interiors - convection
1 Introduction
Oscillations of high radial order
p-modes have been firmly detected in several red giants,
from radial velocity data (Frandsen et al. 2002; Bedding & Kjeldsen 2006)
and photometric data from space (De Ridder et al. 2009; Barban et al. 2007).
These oscillations are stochastically excited by turbulent motion in the outer layers
of these stars. A particularly interesting case
is ![]() Oph, in which De Ridder et al. (2006) detected equidistant frequencies
from ground-based spectroscopic observations. Hekker et al. (2006) analysed the line-profile variations and advocate the presence of non-radial modes.
For the same star, Barban et al. (2007) used data obtained by the MOST satellite. They detected at least 7 equidistant peaks and derived mode lifetimes of about 2.7 days. Kallinger et al. (2008a) reexamined the available data for
Oph, in which De Ridder et al. (2006) detected equidistant frequencies
from ground-based spectroscopic observations. Hekker et al. (2006) analysed the line-profile variations and advocate the presence of non-radial modes.
For the same star, Barban et al. (2007) used data obtained by the MOST satellite. They detected at least 7 equidistant peaks and derived mode lifetimes of about 2.7 days. Kallinger et al. (2008a) reexamined the available data for ![]() Oph and claim to detect at least 21 independent modes with longer lifetimes between 10 and 20 days.
Kallinger et al. (2008b) claim to have detected non-radial modes with long lifetimes (more than 10 days) in the star HD 20884 observed by MOST. A very different result was found by Stello et al. (2006) who claim to have detected modes with very short lifetimes in
Oph and claim to detect at least 21 independent modes with longer lifetimes between 10 and 20 days.
Kallinger et al. (2008b) claim to have detected non-radial modes with long lifetimes (more than 10 days) in the star HD 20884 observed by MOST. A very different result was found by Stello et al. (2006) who claim to have detected modes with very short lifetimes in ![]() Hydrae. We finally mention the recent detection by the CoRoT satellite of solar-like radial and non-radial oscillations in many red giants (De Ridder et al. 2009). Different kinds of power spectra are found in these data of unprecedented quality, some of them showing regular patterns while others are more complex. Modes with very long lifetimes (more than 50 days) are detected.
Hydrae. We finally mention the recent detection by the CoRoT satellite of solar-like radial and non-radial oscillations in many red giants (De Ridder et al. 2009). Different kinds of power spectra are found in these data of unprecedented quality, some of them showing regular patterns while others are more complex. Modes with very long lifetimes (more than 50 days) are detected.
From a theoretical point of view, an important study was made by (Dziembowski et al. 2001, hereafter D01). They underline the mode trapping phenomenon present in these stars and the role of radiative damping for several models with different luminosities. They predict that non-radial modes not trapped in the envelope would have much smaller
amplitudes than radial modes. Houdek & Gough (2002) carried out theoretical computations of the amplitudes and lifetimes of radial modes in the star ![]() Hydrae. They found lifetimes of
the order of 15-20 days with a bump going up to infinite value (unstable mode)
around 110
Hydrae. They found lifetimes of
the order of 15-20 days with a bump going up to infinite value (unstable mode)
around 110 ![]() Hz. Finally, Christensen-Dalsgaard (2004) also discuss the mode trapping and inertia of
non-radial adiabatic modes in red giants and subgiants and the possible consequences for the amplitudes.
Hz. Finally, Christensen-Dalsgaard (2004) also discuss the mode trapping and inertia of
non-radial adiabatic modes in red giants and subgiants and the possible consequences for the amplitudes.
In the present study, we compute theoretical lifetimes of radial and non-radial modes of several red giant models, using a fully non-radial non-adiabatic pulsation code including the non-local time-dependent treatment of convection by Grigahcène et al. (2005) (G05). We discuss how these lifetimes are affected by the mode inertia, the radiative damping in the core and the convective damping in the upper part of the convective envelope. Using a stochastic excitation model (Samadi et al. 2003b; Samadi & Goupil 2001; Samadi et al. 2003a), we also compute the amplitudes of radial and non-radial modes and their theoretical heights in the power spectrum (PS). As we show below, predictions for the heights are very different from the amplitudes. Although non-radial modes in general have smaller amplitudes than radial modes, this is not always the case for the heights. As the heights in the PS are used as a criterion for the detection of frequencies, it is important to make this distinction.
In Sect. 2, we discuss the different energetic processes determining the driving and damping of the modes: the radiative damping in the core, the coherent interaction of convection with oscillations and the stochastic excitation by turbulent motion in the upper part of the convective envelope. In Sect. 3, we present the numerical tools, models and method used to solve the problem. In Sect. 4, we present our results for specific red giant models representative of the different cases that can occur.
2 Energetic aspects of oscillations
Different mechanisms lead to the driving and damping of oscillations. For observed modes, two possibilities exist. Firstly, they could be self-excited. In such case the amplitudes are expected to grow until a large amplitude limit cycle is reached. The observed amplitudes
of the high radial order p-modes in red giants are of several m/s. This is too small for such an interpretation and we reject this possibility here. Secondly, the modes can be damped, but turbulent motions supply them with energy in a stochastic way, allowing them to reach observed amplitudes. We assume here that the high frequency modes of red giants are stochastic excited modes. The damping rate of the modes is given
by an integral expression of this type:
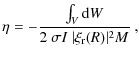
where we assumed the time-dependence
M is the total mass and
2.1 Radiative damping
In the g-mode cavity of red giants, the radial wave-number
![]() becomes huge because of the
high density contrast between the core and the envelope (N is the Brunt-Väisälä frequency). Large variations of the temperature gradient ensue, with loss of heat in the hot phase, leading to radiative damping. In the asymptotic limit,
a simple expression for this damping can be obtained (Godart et al. 2009; Dziembowski 1977b; Van Hoolst et al. 1998):
becomes huge because of the
high density contrast between the core and the envelope (N is the Brunt-Väisälä frequency). Large variations of the temperature gradient ensue, with loss of heat in the hot phase, leading to radiative damping. In the asymptotic limit,
a simple expression for this damping can be obtained (Godart et al. 2009; Dziembowski 1977b; Van Hoolst et al. 1998):
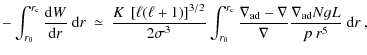
where r0 is the radius of the convective core (if present),
On the other side, the contribution of the g-mode cavity to the denominator of Eq. (1) is simply:
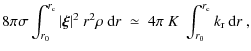
which also can be significant because of the large N (
2.2 Coherent interaction with convection
A very important region for the driving and damping of the modes is the transition region where the thermal relaxation time is of the same order as the oscillation periods. For solar-like oscillations, this transition region corresponds to the upper part of the convective envelope. Moreover, in this region the time-scale of most energetic turbulent eddies is of the same order as the oscillation periods. Hence, the changing physical conditions due to the oscillations lead to periodic variations of the turbulent quantities (convective flux, Reynolds stress, ...), which contribute to the work (positive or negative) performed by the modes. This is what we call the coherent interaction between convection and oscillations. It plays a major role in the damping of high radial order p-mode oscillations of red giants.
This interaction is difficult to model and only a few theories have been proposed for linear oscillations. Two of them make use of a Mixing-Length formalism. The first by Gabriel (1996) and further developed by G05 follows the original ideas of Unno (1967), where a turbulent viscous term opposite to the buoyancy is introduced. This treatment implemented in our non-radial non-adiabatic pulsation code is used in this study. The second theory was developed by Gough (1977b) and follows the ``kinetic of gas'' picture of the MLT. Both theories can include a non-local treatment (Balmforth 1992; Spiegel 1963; Dupret et al. 2006b; Gough 1977a). A third formulation, no longer based on a mixing-length approach but on a Reynolds stress one was also proposed by Xiong et al. (1997). These theories encountered some successes, for example they obtain the red edge of the instability strip (Houdek 2000; Xiong & Deng 2001; Dupret et al. 2004). The reproduction of the Solar mode lifetime is also possible but not easy (Balmforth 1992; Dupret et al. 2006a; Xiong et al. 2000).
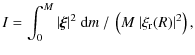
2.3 Stochastic excitation
For stochastically excited modes, the local squared amplitude of velocity variation at the layer where it is measured (we adopt the optical depth
![]() in our results) is given by (e.g., Baudin et al. 2005; Belkacem et al. 2006):
in our results) is given by (e.g., Baudin et al. 2005; Belkacem et al. 2006):
P is the power stochastically supplied to the modes:
where
We also introduce the maximum height of the mode profile in the PS, which is an observable and will permit us to draw conclusions about the mode detectability (see Sect. 4 for details). To this end, one has to distinguish between two cases, namely resolved and unresolved modes. The resolved modes present a Lorentzian profile in the PS and their heights are given by (see e.g. Chaplin et al. 2005; Belkacem et al. 2006):
where
When
![]() (
(
![]() being the duration of observations),
the modes are not resolved. In the limit
being the duration of observations),
the modes are not resolved. In the limit
![]() ,
the heights in the PS
tend to behave like (see e.g. Berthomieu et al. 2001; Lochard et al. 2005):
,
the heights in the PS
tend to behave like (see e.g. Berthomieu et al. 2001; Lochard et al. 2005):
In the theoretical predictions of the heights presented in this paper, we choose the very favorable case of the CoRoT long runs with
Finally, the observed velocity amplitudes are obtained by integration of the projected local velocity over the visible stellar disk (Dziembowski 1977a). This introduces a visibility factor depending on the inclination angle of the star (through the factor
![]() ). We do not include this factor in our theoretical study (the inclination angle is unknown).
). We do not include this factor in our theoretical study (the inclination angle is unknown).
3 Numerical tools, models and method
3.1 Structure models
The equilibrium models analyzed in this study were computed with the version updated for asteroseismology of the code ATON (Mazzitelli 1979). A detailed description of the numerical techniques and implemented physics is given in Ventura et al. (2008) and references therein. For the models in this paper we adopted the classical mixing-length theory of convection (Böhm-Vitense 1958), with a value of the mixing-length parameter
![]() ,
and we assume core overshooting that was treated as a diffusive mixing process. For the parameter describing the extension of that extra mixing we took
,
and we assume core overshooting that was treated as a diffusive mixing process. For the parameter describing the extension of that extra mixing we took
![]() (see Ventura et al. 1998, for details), and for the chemical composition X=0.72 and Z=0.012. The radiative opacities are those from OPAL (Iglesias & Rogers 1996) for the
metal mixture of Grevesse & Noels (1993) completed with Alexander & Ferguson (1994) at low temperatures, and the conductive ones come from Potekhin et al. (1999). Thermodynamic quantities are derived from OPAL (Rogers & Nayfonov 2002), Saumon et al. (1995) for the pressure ionization regime and Stolzmann & Bloecker (1996) treatment is used for He/C/O mixtures. The nuclear cross-sections are from the NACRE compilation (Angulo et al. 1999), and the surface boundary conditions are provided by a grey atmosphere following the Henyey et al. (1965) treatment. Turbulent pressure is not included in our structure models.
(see Ventura et al. 1998, for details), and for the chemical composition X=0.72 and Z=0.012. The radiative opacities are those from OPAL (Iglesias & Rogers 1996) for the
metal mixture of Grevesse & Noels (1993) completed with Alexander & Ferguson (1994) at low temperatures, and the conductive ones come from Potekhin et al. (1999). Thermodynamic quantities are derived from OPAL (Rogers & Nayfonov 2002), Saumon et al. (1995) for the pressure ionization regime and Stolzmann & Bloecker (1996) treatment is used for He/C/O mixtures. The nuclear cross-sections are from the NACRE compilation (Angulo et al. 1999), and the surface boundary conditions are provided by a grey atmosphere following the Henyey et al. (1965) treatment. Turbulent pressure is not included in our structure models.
We focus our study on five well chosen models representative of the
different situations that can occur. Some of their global characteristics are given
in Table 1.
![]() is the cut-off
frequency of an isothermal plane-parallel atmosphere
(estimated here at the photosphere). Evolutionary tracks with the location of these models
in the HR diagram are given in Fig. 1.
is the cut-off
frequency of an isothermal plane-parallel atmosphere
(estimated here at the photosphere). Evolutionary tracks with the location of these models
in the HR diagram are given in Fig. 1.
Table 1: Global parameters of our models.
![\begin{figure}
\par\includegraphics[width=8.7cm,clip]{1713f1.eps}
\end{figure}](/articles/aa/full_html/2009/40/aa11713-09/img65.png) |
Figure 1: HR diagram with the location of our five models. |
| Open with DEXTER | |
3.2 Non-radial non-adiabatic oscillations
We use the non-adiabatic pulsation code MAD (Dupret 2002) to compute the theoretical
lifetimes and inertia of the modes. We use the TDC treatment of G05 for the modelling of the convective flux and turbulent pressure variations entering in the non-adiabatic equations. Different ingredients must be specified. We keep a local treatment for the convective flux. The variations of the turbulent pressure and entropy gradient are treated in a non-local way, with values of the non-local parameters b=3 and c=3.5 according to the definition of Balmforth (1992). Our value of b is derived from a fit of the
turbulent pressure in the subadiabatic atmospheric layers of a solar hydrodynamic simulation
(Dupret et al. 2006b). We recall that our structure models are built without turbulent pressure. We compute it a posteriori in order to be able to determine the turbulent pressure perturbation. This implies that the effect of turbulent pressure on the stratification is not
taken into account in our models. However, the impact of this inconsistency
on the theoretical lifetimes is expected to be
negligible compared to others aspects. The main source of uncertainties in any TDC treatment comes from the perturbation of the closure equations. In our TDC treatment, this uncertainty appears in the form of a free parameter ![]() ,
as introduced by G05. We take by default the value
,
as introduced by G05. We take by default the value
![]() .
Adopting this value for the Sun leads to predictions of the mode lifetimes in reasonable agreement with observations. It also gives in all our red giant models stable high radial order p-modes, in agreement with our working hypothesis of stochastic excitation. However, we discuss in Sect. 4.6 the impact of changing this value.
.
Adopting this value for the Sun leads to predictions of the mode lifetimes in reasonable agreement with observations. It also gives in all our red giant models stable high radial order p-modes, in agreement with our working hypothesis of stochastic excitation. However, we discuss in Sect. 4.6 the impact of changing this value.
Some changes were required in the MAD code to address specific numerical difficulties
associated with red giants. First, we changed the formalism to a Eulerian one in the core.
In the g-mode cavity of red giants where
![]() ,
we have
,
we have
![]() and thus
and thus
![]() .
Hence,
.
Hence, ![]() and
and
![]() are not independent functions and they do not allow us to capture the oscillatory behaviour of the eigenfunctions in the cavity. Therefore, a Lagrangian formalism lacks numerical precision in the dense region of evolved stars, which justifies our switch to a Eulerian formalism.
are not independent functions and they do not allow us to capture the oscillatory behaviour of the eigenfunctions in the cavity. Therefore, a Lagrangian formalism lacks numerical precision in the dense region of evolved stars, which justifies our switch to a Eulerian formalism.
Another significant numerical difficulty comes from the very large number of nodes of
the eigenfunctions in the g-mode cavity. Van Hoolst et al. (1998) and D01 used
a mixed treatment to address this difficulty: numerical solutions of the fully non-adiabatic equations in the envelope are matched with asymptotic solutions in the g-mode cavity.
Our way to proceed is slightly different. Firstly we solve the fully non-adiabatic equations from the center to the surface, which gives a first estimation of the lifetimes.
Second, we separate the integrals in Eqs. (1) and (2) in two parts:
region 1 where
![]() and region 2 (the remaining). In region 1 we use the results obtained in the asymptotic quasi-adiabatic limit (Eqs. (3) and (4)), and in region 2 we use the fully non-adiabatic eigenfunctions obtained numerically in the first step. We then compare the
results obtained by the two approaches: in many cases they are very close, showing
that our fully numerical solution of the problem is precise enough.
In other cases corresponding to high luminosity red giants, the number of nodes
becomes huge (
and region 2 (the remaining). In region 1 we use the results obtained in the asymptotic quasi-adiabatic limit (Eqs. (3) and (4)), and in region 2 we use the fully non-adiabatic eigenfunctions obtained numerically in the first step. We then compare the
results obtained by the two approaches: in many cases they are very close, showing
that our fully numerical solution of the problem is precise enough.
In other cases corresponding to high luminosity red giants, the number of nodes
becomes huge (![]() 1000), which implies loss of numerical precision. In such cases we are more confident in using results with the asymptotic treatment in the g-mode cavity and the fully non-adiabatic solution in the rest of the star.
1000), which implies loss of numerical precision. In such cases we are more confident in using results with the asymptotic treatment in the g-mode cavity and the fully non-adiabatic solution in the rest of the star.
A last important numerical issue is associated with the mode trapping phenomenon, which is
discussed in detail in Sect. 4.1. Algorithms solving the non-adiabatic problem
converge towards the closest eigenvalue in the complex plane (the real part corresponds to
the angular frequency ![]() and the imaginary part to the damping rate
and the imaginary part to the damping rate ![]() ).
Some non-radial modes trapped in the envelope have much lower inertia than the others. Hence, their damping rates are much higher than for other non-radial modes, higher than the frequency separation between consecutive non-radial modes:
).
Some non-radial modes trapped in the envelope have much lower inertia than the others. Hence, their damping rates are much higher than for other non-radial modes, higher than the frequency separation between consecutive non-radial modes:
![]() .
Hence, with a real initial guess of the eigenvalues (e.g. the adiabatic frequencies),
it is impossible to converge towards the modes strongly trapped in the envelope.
The only way is to adopt a complex initial value; for example, interpolating the complex non-adiabatic eigenvalues of radial modes gives adequate initial values, allowing the solution to converge towards the non-radial modes strongly trapped in the envelope.
.
Hence, with a real initial guess of the eigenvalues (e.g. the adiabatic frequencies),
it is impossible to converge towards the modes strongly trapped in the envelope.
The only way is to adopt a complex initial value; for example, interpolating the complex non-adiabatic eigenvalues of radial modes gives adequate initial values, allowing the solution to converge towards the non-radial modes strongly trapped in the envelope.
3.3 Ingredients for the stochastic excitation models
The power stochastically supplied to the modes, P in Eqs. (5) and (6), is computed as described in Belkacem et al. (2008). The typical convective length-scales as well as the kinetic energy spectrum are poorly known for red giant stars. Given that the predictions of the stochastic excitation models strongly depend on them, we infer both the kinetic energy spectrum and the injection length-scale from a representative 3D numerical simulation. To this end, we computed a 3D radiation-hydrodynamical model atmosphere with the code
CO5BOLD (Wedemeyer et al. 2004; Freytag et al. 2002). The simulation has a gravity
![]() and an effective temperature of
and an effective temperature of
![]() K.
The model has a spatial mesh with
K.
The model has a spatial mesh with
![]() grid
points, and a physical extent of the computational box of
grid
points, and a physical extent of the computational box of
![]() Mm3.
Using this 3D numerical simulation, we determine the injection length-scale
in the layer where the driving is the largest
(see Samadi et al. 2003b, for details). This estimation of the injection scale gives values larger than the mixing-length by a factor of 5-10 depending on the model. Using the mixing-length as the injection scale would give theoretical amplitudes much lower than typical observations.
We assume here that the injection scale is constant in the driving region. In the
case of the Sun, such approximation underestimates by about 25% the
theoretical amplitudes (Samadi et al. 2003b). The models considered in our study have different
gravities. This affects the injection length-scale and we assume here that it scales
as the pressure scale-height at the photosphere. Such a procedure has been verified in the case of
Mm3.
Using this 3D numerical simulation, we determine the injection length-scale
in the layer where the driving is the largest
(see Samadi et al. 2003b, for details). This estimation of the injection scale gives values larger than the mixing-length by a factor of 5-10 depending on the model. Using the mixing-length as the injection scale would give theoretical amplitudes much lower than typical observations.
We assume here that the injection scale is constant in the driving region. In the
case of the Sun, such approximation underestimates by about 25% the
theoretical amplitudes (Samadi et al. 2003b). The models considered in our study have different
gravities. This affects the injection length-scale and we assume here that it scales
as the pressure scale-height at the photosphere. Such a procedure has been verified in the case of ![]() Cen A (Samadi et al. 2008). This allows us to compute the excitation rates for all the models presented in Sect. 3.1. We use a Lorentzian profile for the eddy time-correlation function (Samadi et al. 2003a). Eventually, concerning the k-dependency of the kinetic energy spectrum (k is the wavenumber in the Fourrier space of turbulence), we use the Broad Kolmogorov Spectrum (BKS) (Musielak et al. 1994) that reproduces the spectrum inferred from the 3D simulation.
Cen A (Samadi et al. 2008). This allows us to compute the excitation rates for all the models presented in Sect. 3.1. We use a Lorentzian profile for the eddy time-correlation function (Samadi et al. 2003a). Eventually, concerning the k-dependency of the kinetic energy spectrum (k is the wavenumber in the Fourrier space of turbulence), we use the Broad Kolmogorov Spectrum (BKS) (Musielak et al. 1994) that reproduces the spectrum inferred from the 3D simulation.
4 Results
![\begin{figure}
\par\includegraphics[width=8.7cm,clip]{1713f2.eps}
\end{figure}](/articles/aa/full_html/2009/40/aa11713-09/img84.png) |
Figure 2:
Energy density
|
| Open with DEXTER | |
![\begin{figure}
\par\includegraphics[width=8.7cm,clip]{1713f3.eps}
\end{figure}](/articles/aa/full_html/2009/40/aa11713-09/img85.png) |
Figure 3:
Inertia of |
| Open with DEXTER | |
4.1 Mode trapping in evolved stars
Mode trapping is a very important phenomenon allowing to understand the behaviour
of non-radial modes in evolved stars. D01 and Christensen-Dalsgaard (2004) discussed it in
the case of red giants. Here we recall basic aspects that are important for the interpretation of our results. The Brunt-Väisälä (N) and Lamb (![]() )
frequencies are huge in the dense core of red giants. Because of these huge values, all non-radial modes with frequencies lower than the cut-off frequency and larger than the fundamental radial mode have a mixed character.
In the envelope,
)
frequencies are huge in the dense core of red giants. Because of these huge values, all non-radial modes with frequencies lower than the cut-off frequency and larger than the fundamental radial mode have a mixed character.
In the envelope,
![]() and they behave like acoustic modes (as in solar-like main sequence stars).
But
and they behave like acoustic modes (as in solar-like main sequence stars).
But
![]() in the core
and the same modes behave there like gravity modes.
The presence of an evanescent region between the p- and g-cavities
is at the origin of the mode trapping. Some modes have significant
kinetic energy in the g-cavity and low ones in the p-cavity; they are
trapped in the core. Others have low kinetic energy in the g-cavity but high
ones in the envelope; they are trapped in the envelope.
in the core
and the same modes behave there like gravity modes.
The presence of an evanescent region between the p- and g-cavities
is at the origin of the mode trapping. Some modes have significant
kinetic energy in the g-cavity and low ones in the p-cavity; they are
trapped in the core. Others have low kinetic energy in the g-cavity but high
ones in the envelope; they are trapped in the envelope.
An illustration of the
distribution of energy of a mode trapped in the core and a mode trapped
in the envelope are shown in Fig. 2, where we give
![]() .
Mode trapping directly affects the mode inertia. We give in Fig. 3
the inertia as a function of frequency for
.
Mode trapping directly affects the mode inertia. We give in Fig. 3
the inertia as a function of frequency for
![]() modes.
We first notice how dense the spectrum of
frequencies for non-radial modes is, which is a direct consequence of the huge
Brunt-Väisälä frequency in the core (according to the asymptotic theory,
modes.
We first notice how dense the spectrum of
frequencies for non-radial modes is, which is a direct consequence of the huge
Brunt-Väisälä frequency in the core (according to the asymptotic theory,
![]() ).
Modes trapped in the envelope are the local minima with low inertia in Fig. 3.
The
).
Modes trapped in the envelope are the local minima with low inertia in Fig. 3.
The ![]() modes trapped in the envelope have
lower inertia than the
modes trapped in the envelope have
lower inertia than the ![]() modes trapped in the envelope, while it is the contrary
for all other modes. In agreement with D01 and Christensen-Dalsgaard (2004), the size of the evanescent
region and thus the efficiency of trapping increases with the degree
modes trapped in the envelope, while it is the contrary
for all other modes. In agreement with D01 and Christensen-Dalsgaard (2004), the size of the evanescent
region and thus the efficiency of trapping increases with the degree ![]() of the modes.
This is very different from RR Lyrae stars (Van Hoolst et al. 1998) because there the evanescent region is larger for
of the modes.
This is very different from RR Lyrae stars (Van Hoolst et al. 1998) because there the evanescent region is larger for ![]() in the observed range of frequency. It is very interesting to notice that when only the modes trapped in the envelope are considered, the frequency spectrum is similar to solar-type main sequence stars, with large and small separations appearing clearly. The inertia appears directly in Eqs. (1), (5) and (8). Hence, the mode trapping is expected to strongly affect the amplitudes, lifetimes, and heights
of the modes in the PS of red giants. In the next section, we present our main results for different models (Table 1, Fig. 1).
in the observed range of frequency. It is very interesting to notice that when only the modes trapped in the envelope are considered, the frequency spectrum is similar to solar-type main sequence stars, with large and small separations appearing clearly. The inertia appears directly in Eqs. (1), (5) and (8). Hence, the mode trapping is expected to strongly affect the amplitudes, lifetimes, and heights
of the modes in the PS of red giants. In the next section, we present our main results for different models (Table 1, Fig. 1).
4.2 Model A: bottom of the red giant branch
![\begin{figure}
\par\includegraphics[width=8.8cm,clip]{1713f4.eps}
\end{figure}](/articles/aa/full_html/2009/40/aa11713-09/img92.png) |
Figure 4: Theoretical lifetimes of radial modes of model A. The horizontal line corresponds to our choice of the resolution limit (75 days). |
| Open with DEXTER | |
![\begin{figure}
\par\includegraphics[width=8.22cm,clip]{1713f5.eps}\par\includegr...
...lip]{1713f7.eps}\par\includegraphics[width=8.22cm,clip]{1713f8.eps}
\end{figure}](/articles/aa/full_html/2009/40/aa11713-09/img93.png) |
Figure 5:
Theoretical predictions for |
| Open with DEXTER | |
![\begin{figure}
\par\includegraphics[width=8.7cm,clip]{1713f9.eps}
\end{figure}](/articles/aa/full_html/2009/40/aa11713-09/img95.png) |
Figure 6:
Work integral for the mode |
| Open with DEXTER | |
We first consider the lifetimes of radial modes from the fundamental up to the cut-off frequency. We also give the resolution limit of 75 days (horizontal line).
As can be seen, we can separate the modes into two sets. From the fundamental to p7(
![]() Hz), the lifetimes are very long and such modes could not be resolved.
On the other side, for larger frequencies the lifetimes of radial modes are below 75 days
and these radial modes have a chance of being resolved. Current observations of red giant
solar-like oscillations show that at least some of the modes can be resolved. We note
also that Xiong & Deng (2007) predict unstable modes in the lower part of the spectrum.
Depending on the parameter
Hz), the lifetimes are very long and such modes could not be resolved.
On the other side, for larger frequencies the lifetimes of radial modes are below 75 days
and these radial modes have a chance of being resolved. Current observations of red giant
solar-like oscillations show that at least some of the modes can be resolved. We note
also that Xiong & Deng (2007) predict unstable modes in the lower part of the spectrum.
Depending on the parameter ![]() used in our TDC model, they can be stable or unstable.
We restrict our study to the second set of modes, in which radial modes could
be resolved. We propose to call them solar-like modes by analogy with the solar case.
Such modes are detected (as shown in the introduction) and their physical interpretation
as stochastic modes has been firmly established.
used in our TDC model, they can be stable or unstable.
We restrict our study to the second set of modes, in which radial modes could
be resolved. We propose to call them solar-like modes by analogy with the solar case.
Such modes are detected (as shown in the introduction) and their physical interpretation
as stochastic modes has been firmly established.
In the top panel of Fig. 5, we give the theoretical lifetimes
![]() obtained for the
obtained for the ![]() ,
1 and 2 modes of model A.
According to Eq. (1), the mode lifetime
,
1 and 2 modes of model A.
According to Eq. (1), the mode lifetime
![]() .
Moreover, we see from Eq. (7) that the heights in the PS
are proportional to
.
Moreover, we see from Eq. (7) that the heights in the PS
are proportional to
![]() for resolved modes. This leads us to consider
in the second panel the mode lifetimes divided by the inertia
(
for resolved modes. This leads us to consider
in the second panel the mode lifetimes divided by the inertia
(![]() ). As we showed in Fig. 3, the mode trapping leads to an oscillatory
behaviour of the inertia with the large frequency separation as periodicity.
The oscillatory behaviour of the lifetimes is a direct consequence of the oscillations of I. But when the ratio between the two is considered, the oscillatory behaviour disappears and the same results are found for radial and non-radial modes.
). As we showed in Fig. 3, the mode trapping leads to an oscillatory
behaviour of the inertia with the large frequency separation as periodicity.
The oscillatory behaviour of the lifetimes is a direct consequence of the oscillations of I. But when the ratio between the two is considered, the oscillatory behaviour disappears and the same results are found for radial and non-radial modes.
In order to interpret this result, we give in Fig. 6 the cumulated
work integral
![]() for a typical
for a typical ![]() mode trapped in the core (
mode trapped in the core (
![]() Hz). The surface value is
Hz). The surface value is
![]() .
We see that significant driving and damping only occur in the upper part of the convective envelope, but there is no significant radiative damping in the core. As the radial component of the displacement dominates in the envelope, the numerator of Eq. (1) is the same at a given frequency, whatever the value of
.
We see that significant driving and damping only occur in the upper part of the convective envelope, but there is no significant radiative damping in the core. As the radial component of the displacement dominates in the envelope, the numerator of Eq. (1) is the same at a given frequency, whatever the value of ![]() .
This explains why
.
This explains why ![]() does not depend on
does not depend on ![]() .
.
In the third panel of Fig. 5, we give the theoretical amplitudes of the modes. The amplitudes of radial modes are higher because they have less inertia. The oscillatory behaviour of the inertia due to mode trapping leads to oscillations of the amplitudes of non-radial modes.
In the bottom panel of Fig. 5, we give the theoretical heights in the PS.
We put the resolution limit at 75 days (horizontal line in top panel).
If the mode lifetime value is larger than this value, Eq. (8) is used instead of Eq. (7)
to obtain the height. For resolved modes (
![]() ),
the same heights are found for radial and non-radial modes,
except for the visibility factor (integration over the stellar disk), which is not included
in our study. The unresolved non-radial modes with long lifetimes (mainly
),
the same heights are found for radial and non-radial modes,
except for the visibility factor (integration over the stellar disk), which is not included
in our study. The unresolved non-radial modes with long lifetimes (mainly ![]() modes
trapped in the core) have smaller heights than the closest radial mode.
We emphasize that the predictions for the heights are different
from the amplitudes. Although non-radial modes have smaller amplitudes than radial modes,
the heights in the PS are often of the same order. Contrary to the amplitudes, the heights are observation dependent. If
modes
trapped in the core) have smaller heights than the closest radial mode.
We emphasize that the predictions for the heights are different
from the amplitudes. Although non-radial modes have smaller amplitudes than radial modes,
the heights in the PS are often of the same order. Contrary to the amplitudes, the heights are observation dependent. If
![]() is smaller,
more non-radial modes are unresolved and their heights in the PS are smaller.
is smaller,
more non-radial modes are unresolved and their heights in the PS are smaller.
Thus, many non-radial modes would be detectable in the PS of stars like model A. Moreover, the interaction between the p- and g-mode cavities leads to many avoided crossings. Hence, the resulting frequency spectrum is very complex, particularly for ![]() modes and its seismic interpretation is not easy.
modes and its seismic interpretation is not easy.
4.3 Model B: intermediate in the red giant branch
![\begin{figure}
\par\includegraphics[width=8.33cm,clip]{1713f10.eps}\par\includeg...
...]{1713f12.eps}\par\includegraphics[width=8.33cm,clip]{1713f13.eps}
\end{figure}](/articles/aa/full_html/2009/40/aa11713-09/img102.png) |
Figure 7:
Theoretical predictions for
|
| Open with DEXTER | |
![\begin{figure}
\par\includegraphics[width=8.7cm,clip]{1713f14.eps}
\end{figure}](/articles/aa/full_html/2009/40/aa11713-09/img103.png) |
Figure 8:
Work integrals for the mode |
| Open with DEXTER | |
We now present the results obtained for model B that is slightly higher in the red giant
branch (Fig. 1, Table 1). In the top panel of Fig. 7,
we give the theoretical lifetimes obtained for the ![]() ,
1 and 2 modes. Again we see the oscillatory behaviour due to mode trapping. But considering now the ratio between the lifetime and the inertia given in the 2nd panel from the top, we find very different results compared to model A. Now, oscillatory behaviour of this ratio is present for non-radial modes, particularly at low frequencies. To understand this, we compare in Fig. 8 the work integral for two
,
1 and 2 modes. Again we see the oscillatory behaviour due to mode trapping. But considering now the ratio between the lifetime and the inertia given in the 2nd panel from the top, we find very different results compared to model A. Now, oscillatory behaviour of this ratio is present for non-radial modes, particularly at low frequencies. To understand this, we compare in Fig. 8 the work integral for two ![]() modes, one trapped in the envelope
(
modes, one trapped in the envelope
(
![]() Hz, top panel) and the other trapped in the core (
Hz, top panel) and the other trapped in the core (
![]() Hz, bottom panel). For the mode trapped in the envelope, the driving and damping occur in the upper part of the convective envelope, as in model A. But for the mode trapped in the core, significant radiative damping occurs around the bottom of the H-burning shell (
Hz, bottom panel). For the mode trapped in the envelope, the driving and damping occur in the upper part of the convective envelope, as in model A. But for the mode trapped in the core, significant radiative damping occurs around the bottom of the H-burning shell (
![]() ).
).
In the third panel of Fig. 7, we give the theoretical amplitudes of radial and non-radial modes of model B. The amplitudes of non-radial modes trapped in the core are very small because of large inertia and radiative damping. The amplitudes of non-radial modes trapped in the envelope (local maxima in the figure) are smaller than radial modes but not negligible because of similar inertia and negligible radiative damping.
In the bottom panel of Fig. 7, we give the heights of the modes in the PS. Non-radial modes trapped in the core have negligible heights and would not be detected. In contrast, non-radial modes trapped in the envelope have similar heights compared to radial modes.
Thus, only radial modes and non-radial modes trapped in the envelope
could be observed in the PS of stars like model B. The groups of non-radial modes
trapped in the envelope are more or less separated from each other by a constant large separation. Seismic interpretation of the frequency spectrum of such stars would thus be easier than in model A. We notice however that the trapping is not perfect for ![]() modes. Hence, a small group of
modes. Hence, a small group of ![]() modes is detectable around each local maximum. This would have to be taken into account in any seismic study. Considering observed power spectra, this also means that these groups of modes would have to be not confused with single large line-widths modes.
modes is detectable around each local maximum. This would have to be taken into account in any seismic study. Considering observed power spectra, this also means that these groups of modes would have to be not confused with single large line-widths modes.
4.4 Model C: high in the red giant branch
![\begin{figure}
\par\includegraphics[width=8.7cm,clip]{1713f15.eps}\par\includegr...
...ip]{1713f16.eps}\par\includegraphics[width=8.7cm,clip]{1713f17.eps}
\end{figure}](/articles/aa/full_html/2009/40/aa11713-09/img105.png) |
Figure 9:
Theoretical predictions for
|
| Open with DEXTER | |
![\begin{figure}
\par\includegraphics[width=8.7cm,clip]{1713f18.eps}
\end{figure}](/articles/aa/full_html/2009/40/aa11713-09/img107.png) |
Figure 10:
Work integral for the mode |
| Open with DEXTER | |
We consider now the results obtained for model C, which is even higher in the red giant
branch than the previous ones (Fig. 1). In the top panel of Fig. 9, we give the theoretical lifetimes. They are very different from those of model B.
The oscillatory behaviour is no longer present for most ![]() and low frequency
and low frequency ![]() modes. As can be seen in the figure, the transitions to envelope-trapped modes are very sharp; these modes, known as Strongly Trapped in the Envelope (STE), are nearly perfectly reflected at the internal turning point (near the top of the H-burning shell).
We give in Fig. 10 the work integral for an
modes. As can be seen in the figure, the transitions to envelope-trapped modes are very sharp; these modes, known as Strongly Trapped in the Envelope (STE), are nearly perfectly reflected at the internal turning point (near the top of the H-burning shell).
We give in Fig. 10 the work integral for an ![]() mode with frequency very close
to but different from an STE mode. The very high radiative damping illustrated in this figure occurs for all non-radial modes of this model, except the STE mode. Because of this and the large inertia, the g-mode cavity dominates the integrals in the numerator and the denominator of Eq. (1) for all non-STE modes. Hence Eqs. (3) and (4) are good approximations for the full integrals and the K constant simplifies when the ratio between the two is considered. This explains why the lifetimes do not show oscillations in the top panel. In the second panel of Fig. 9, we give the theoretical amplitudes. They are very small for all non-radial non-STE modes, because of the high radiative damping and inertia. Finally, we give in the bottom panel the theoretical heights in the PS. All non-radial non-STE modes have negligible heights because of the large radiative damping. Thus, only radial modes and non-radial modes completely trapped in the envelope could be detected in stars like model C.
mode with frequency very close
to but different from an STE mode. The very high radiative damping illustrated in this figure occurs for all non-radial modes of this model, except the STE mode. Because of this and the large inertia, the g-mode cavity dominates the integrals in the numerator and the denominator of Eq. (1) for all non-STE modes. Hence Eqs. (3) and (4) are good approximations for the full integrals and the K constant simplifies when the ratio between the two is considered. This explains why the lifetimes do not show oscillations in the top panel. In the second panel of Fig. 9, we give the theoretical amplitudes. They are very small for all non-radial non-STE modes, because of the high radiative damping and inertia. Finally, we give in the bottom panel the theoretical heights in the PS. All non-radial non-STE modes have negligible heights because of the large radiative damping. Thus, only radial modes and non-radial modes completely trapped in the envelope could be detected in stars like model C.
4.5 Models D and E: H-shell versus He-core burning
![\begin{figure}
\par\includegraphics[width=8.7cm,clip]{1713f19.eps}\par\includegraphics[width=8.7cm,clip]{1713f20.eps}\end{figure}](/articles/aa/full_html/2009/40/aa11713-09/img108.png) |
Figure 11:
Theoretical lifetimes for
|
| Open with DEXTER | |
![\begin{figure}
\par\includegraphics[width=8.7cm,clip]{1713f21.eps}\par\includegraphics[width=8.7cm,clip]{1713f22.eps}
\end{figure}](/articles/aa/full_html/2009/40/aa11713-09/img109.png) |
Figure 12:
Theoretical heights in the PS for |
| Open with DEXTER | |
We now compare the theoretical lifetimes, amplitudes and heights of the two models D and E with the same luminosity, one before (model D) and the other during (model E) the core helium burning phase.
In Fig. 11, we give the theoretical lifetimes obtained for the
![]() modes of these two models. The behaviour is similar for the two models.
modes of these two models. The behaviour is similar for the two models.
In Fig. 12, we give the theoretical heights in the PS for these two models. No significant difference between the two is found except that the heights in the PS are systematically larger for the He burning model, because of its higher effective temperature leading to stronger stochastic driving.
4.6 Uncertainties of the non-adiabatic treatment in the convective envelope
![\begin{figure}
\par\includegraphics[width=8.7cm,clip]{1713f23.eps}\par\includegraphics[width=8.7cm,clip]{1713f24.eps}
\end{figure}](/articles/aa/full_html/2009/40/aa11713-09/img111.png) |
Figure 13:
Theoretical predictions for |
| Open with DEXTER | |
As discussed in Sects. 2.2 and 3.2, the time-dependent interaction between convection and oscillations is subject to large uncertainties. In the TDC treatment of G05, a free complex parameter ![]() was introduced in the perturbed closure equations. In the previous computations, we adopted
was introduced in the perturbed closure equations. In the previous computations, we adopted
![]() .
We now redo the computations with
.
We now redo the computations with
![]() .
Larger changes of
.
Larger changes of ![]() would give unstable modes in the considered range of frequencies, which is not realistic in view of the typical observed amplitudes of red giant high order p-modes.
would give unstable modes in the considered range of frequencies, which is not realistic in view of the typical observed amplitudes of red giant high order p-modes.
With
![]() ,
the convective damping in the upper part of the convective envelope
is larger. As shown in Fig. 13, this results in smaller lifetimes and amplitudes
of the modes trapped in the envelope compared to Fig. 7. In the upper part of the envelope, the eigenfunctions do not depend significantly on the degree
,
the convective damping in the upper part of the convective envelope
is larger. As shown in Fig. 13, this results in smaller lifetimes and amplitudes
of the modes trapped in the envelope compared to Fig. 7. In the upper part of the envelope, the eigenfunctions do not depend significantly on the degree ![]() of the modes. Hence the uncertainties associated with the TDC treatment affect radial and non-radial modes trapped in the envelope in the same way.
of the modes. Hence the uncertainties associated with the TDC treatment affect radial and non-radial modes trapped in the envelope in the same way.
4.7 Non-linear effects?
Our study is linear, raising the question of whether such an approximation is valid here.
Considering first the amplitudes of the displacement at the photosphere, we find typical values about 200 times smaller than the pressure scale height for detectable modes. Hence non-linear effects in the superficial layers are expected to be small. We consider now the oscillations in the g-mode cavity. We can confidently neglect non-linear terms if
![]() .
In a cavity with short wavelength oscillations, this condition is equivalent to
.
In a cavity with short wavelength oscillations, this condition is equivalent to
![]() .
In the g-mode cavity of envelope trapped modes,
.
In the g-mode cavity of envelope trapped modes,
![]() is typically about 104 times smaller than
is typically about 104 times smaller than
![]() .
Hence the risk of wavebreaking due to non-linear effects is negligible in the core.
.
Hence the risk of wavebreaking due to non-linear effects is negligible in the core.
5 Conclusions
We have determined the theoretical lifetimes, amplitudes and heights in the PS of radial and non-radial modes of several red giant models. The predictions appear to be very different depending on the evolutionary status of the star. What mainly matters is the density contrast between the He core and the envelope. During evolution, it increases considerably as the He core contracts and the envelope expands. Moreover the Kelvin-Helmholtz time decreases because of the increasing luminosity. The consequence of these two effects is an increasing importance of the radiative damping of non-radial modes as the luminosity of the star increases. We can encounter very different cases depending on the evolutionary status of the star:
- Case A: Subgiants and/or low luminosity red giants.
Our model representative of the class is model A at the bottom of the giant branch for .
In these stars, the density contrast is not large enough to imply
significant radiative damping of non-radial solar-type p-modes (
.
In these stars, the density contrast is not large enough to imply
significant radiative damping of non-radial solar-type p-modes (
 in model A). The amplitudes of non-radial modes are smaller than radial modes because of larger inertia. However, if we consider instead the heights in the PS, they are similar for radial and non-radial modes as long as they can be resolved. As the heights are used as detection criteria in a Fourier analysis, many non-radial modes could be detected in the PS of such stars. The interaction between the p- and g-mode cavities leads to many avoided crossings.
The resulting frequency spectrum is thus very complex. Asteroseismology of such stars would be challenging.
in model A). The amplitudes of non-radial modes are smaller than radial modes because of larger inertia. However, if we consider instead the heights in the PS, they are similar for radial and non-radial modes as long as they can be resolved. As the heights are used as detection criteria in a Fourier analysis, many non-radial modes could be detected in the PS of such stars. The interaction between the p- and g-mode cavities leads to many avoided crossings.
The resulting frequency spectrum is thus very complex. Asteroseismology of such stars would be challenging.
- Case B: Intermediate models in the red giant branch.
Our models representative of this class are model B, D and E with greater luminosity compared to the previous case ( ). In these stars the radius ratio between the core and the envelope is smaller (
 in model B). As a consequence, the radiative damping around the bottom of the H-burning shell becomes large enough to destroy the non-radial modes trapped in the core. Only the non-radial modes trapped in the envelope and the radial modes can survive and have similar heights in the PS.
The non-radial modes trapped in the envelope are more or less separated from each other by a constant large separation, allowing us to build echelle diagrams. However, the trapping is not perfect for
in model B). As a consequence, the radiative damping around the bottom of the H-burning shell becomes large enough to destroy the non-radial modes trapped in the core. Only the non-radial modes trapped in the envelope and the radial modes can survive and have similar heights in the PS.
The non-radial modes trapped in the envelope are more or less separated from each other by a constant large separation, allowing us to build echelle diagrams. However, the trapping is not perfect for  modes. Hence, a small group of
modes is detectable around each local maximum in the PS corresponding to an envelope trapped mode. Such structures would not have to be interpreted as single large line-width modes. Seismic interpretation of the frequency spectrum of such stars would be easier than in the previous case.
modes. Hence, a small group of
modes is detectable around each local maximum in the PS corresponding to an envelope trapped mode. Such structures would not have to be interpreted as single large line-width modes. Seismic interpretation of the frequency spectrum of such stars would be easier than in the previous case.
- Case C: High luminosity red giants.
Our model representative of this class is model C with ,
,
 .
This case is not very different from the previous one, except that
the density contrast between the core and the envelope is very large (
.
This case is not very different from the previous one, except that
the density contrast between the core and the envelope is very large (
 in
model C). As a consequence, the radiative damping is stronger in the core and destroys
all non-radial modes except those strongly trapped in the envelope. These modes and the radial modes are the only ones that could be detected in these stars. The trapping is efficient enough in
modes and only single envelope trapped modes are detectable. Seismic interpretation of the frequency spectrum of such stars would also be easier.
in
model C). As a consequence, the radiative damping is stronger in the core and destroys
all non-radial modes except those strongly trapped in the envelope. These modes and the radial modes are the only ones that could be detected in these stars. The trapping is efficient enough in
modes and only single envelope trapped modes are detectable. Seismic interpretation of the frequency spectrum of such stars would also be easier.
Asteroseismology of red giants is a very promising field as the theoretical predictions depend strongly on the physical characteristics of both their deep and superficial layers.
Acknowledgements
The works of K. Belkacem were financially supported throught a postdoctoral fellowship from the ``Subside fédéral pour la recherche 2009'', University of Liège. We thank Prof. W. Dziembowski for his useful advices and remarks.
References
- Alexander, D. R., & Ferguson, J. W. 1994, ApJ, 437, 879 [NASA ADS] [CrossRef] (In the text)
- Angulo, C., Arnould, M., Rayet, M., et al. 1999, Nuclear Physics A, 656, 3 [NASA ADS] [CrossRef] (In the text)
- Balmforth, N. J. 1992, MNRAS, 255, 603 [NASA ADS]
- Barban, C., Matthews, J. M., de Ridder, J., et al. 2007, A&A, 468, 1033 [NASA ADS] [CrossRef] [EDP Sciences]
- Baudin, F., Samadi, R., Goupil, M.-J., et al. 2005, A&A, 433, 349 [NASA ADS] [CrossRef] [EDP Sciences]
- Bedding, T., & Kjeldsen, H. 2006, in Proceedings of SOHO 18/GONG 2006/HELAS I, Beyond the spherical Sun, ESA SP, 624
- Belkacem, K., Samadi, R., Goupil, M. J., Kupka, F., & Baudin, F. 2006, A&A, 460, 183 [NASA ADS] [CrossRef] [EDP Sciences]
- Belkacem, K., Samadi, R., Goupil, M.-J., & Dupret, M.-A. 2008, A&A, 478, 163 [NASA ADS] [CrossRef] [EDP Sciences] (In the text)
- Berthomieu, G., Toutain, T., Gonczi, G., et al. 2001, in SOHO 10/GONG 2000 Workshop: Helio- and Asteroseismology at the Dawn of the Millennium, ed. A. Wilson, & P. L. Pallé, ESA SP-464, 411
- Böhm-Vitense, E. 1958, Z.Astrophys., 46, 108 [NASA ADS] (In the text)
- Chaplin, W. J., Houdek, G., Elsworth, Y., et al. 2005, MNRAS, 360, 859 [NASA ADS] [CrossRef]
- Christensen-Dalsgaard, J. 2004, Sol. Phys., 220, 137 [NASA ADS] [CrossRef] (In the text)
- De Ridder, J., Barban, C., Carrier, F., et al. 2006, A&A, 448, 689 [NASA ADS] [CrossRef] [EDP Sciences] (In the text)
- De Ridder, J., Barban, C., Baudin, F., et al. 2009, Nature, 459, 398 [NASA ADS] [CrossRef]
- Dupret, M.-A. 2002, Bull. Soc. Roy. Sc. Liège, 5, 249 (In the text)
- Dupret, M.-A., Grigahcène, A., Garrido, R., Gabriel, M., & Scuflaire, R. 2004, A&A, 414, L17 [NASA ADS] [CrossRef] [EDP Sciences]
- Dupret, M. A., Barban, C., Goupil, M.-J., et al. 2006a, in Proceedings of SOHO 18/GONG 2006/HELAS I, Beyond the spherical Sun, ESA SP, 624
- Dupret, M.-A., Samadi, R., Grigahcene, A., Goupil, M.-J., & Gabriel, M. 2006b, Commun. Asteroseismol., 147, 85 [NASA ADS] [CrossRef]
- Dziembowski, W. 1977a, Acta Astron., 27, 203 [NASA ADS] (In the text)
- Dziembowski, W. 1977b, Acta Astron., 27, 95 [NASA ADS]
- Dziembowski, W. A., Gough, D. O., Houdek, G., & Sienkiewicz, R. 2001, MNRAS, 328, 601 [NASA ADS] [CrossRef] (In the text)
- Frandsen, S., Carrier, F., Aerts, C., et al. 2002, A&A, 394, L5 [NASA ADS] [CrossRef] [EDP Sciences]
- Freytag, B., Steffen, M., & Dorch, B. 2002, Astron. Nachr., 323, 213 [NASA ADS] [CrossRef]
- Gabriel, M. 1996, BAS of India, 24, 233 [NASA ADS] (In the text)
- Godart, M., Noels, A., Dupret, M.-A., & Lebreton, Y. 2009, MNRAS, 396, 1833 [NASA ADS] [CrossRef]
- Gough, D. O. 1977a, in Problems of Stellar Convection, ed. E. A. Spiegel & J.-P. Zahn (Berlin: Springer Verlag), Lect. Notes Phys., 71, 15
- Gough, D. O. 1977b, ApJ, 214, 196 [NASA ADS] [CrossRef] (In the text)
- Grevesse, N., & Noels, A. 1993, in La formation des éléments chimiques, AVCP, ed. R. D. B. Hauck, & S. Paltani, 205 (In the text)
- Grigahcène, A., Dupret, M.-A., Gabriel, M., Garrido, R., & Scuflaire, R. 2005, A&A, 434, 1055 [NASA ADS] [CrossRef] [EDP Sciences] (In the text)
- Hekker, S., Aerts, C., de Ridder, J., & Carrier, F. 2006, A&A, 458, 931 [NASA ADS] [CrossRef] [EDP Sciences] (In the text)
- Henyey, L., Vardya, M. S., & Bodenheimer, P. 1965, ApJ, 142, 841 [NASA ADS] [CrossRef] (In the text)
- Houdek, G. 2000, in Delta Scuti and Related Stars, ed. M. Breger, & M. Montgomery, ASP Conf. Ser., 210, 454
- Houdek, G., & Gough, D. O. 2002, MNRAS, 336, L65 [NASA ADS] [CrossRef] (In the text)
- Iglesias, C. A., & Rogers, F. J. 1996, ApJ, 464, 943 [NASA ADS] [CrossRef] (In the text)
- Kallinger, T., Guenther, D. B., Matthews, J. M., et al. 2008a, A&A, 478, 497 [NASA ADS] [CrossRef] [EDP Sciences] (In the text)
- Kallinger, T., Guenther, D. B., Weiss, W. W., et al. 2008b, Commun. Asteroseismol., 153, 84 [NASA ADS] [CrossRef] (In the text)
- Lochard, J., Samadi, R., & Goupil, M. J. 2005, A&A, 438, 939 [NASA ADS] [CrossRef] [EDP Sciences]
- Mazzitelli, I. 1979, A&A, 79, 251 [NASA ADS] (In the text)
- Musielak, Z. E., Rosner, R., Stein, R. F., & Ulmschneider, P. 1994, ApJ, 423, 474 [NASA ADS] [CrossRef] (In the text)
- Potekhin, A. Y., Baiko, D. A., Haensel, P., & Yakovlev, D. G. 1999, A&A, 346, 345 [NASA ADS] (In the text)
- Rogers, F. J., & Nayfonov, A. 2002, ApJ, 576, 1064 [NASA ADS] [CrossRef] (In the text)
- Samadi, R., & Goupil, M. 2001, A&A, 370, 136 [NASA ADS] [CrossRef] [EDP Sciences]
- Samadi, R., Nordlund, Å., Stein, R. F., Goupil, M. J., & Roxburgh, I. 2003a, A&A, 404, 1129 [NASA ADS] [CrossRef] [EDP Sciences]
- Samadi, R., Nordlund, Å., Stein, R. F., Goupil, M. J., & Roxburgh, I. 2003b, A&A, 403, 303 [NASA ADS] [CrossRef] [EDP Sciences]
- Samadi, R., Belkacem, K., Goupil, M. J., Dupret, M.-A., & Kupka, F. 2008, A&A, 489, 291 [NASA ADS] [CrossRef] [EDP Sciences] (In the text)
- Saumon, D., Chabrier, G., & van Horn, H. M. 1995, ApJS, 99, 713 [NASA ADS] [CrossRef] (In the text)
- Spiegel, E. A. 1963, ApJ, 138, 216 [NASA ADS] [CrossRef]
- Stello, D., Kjeldsen, H., Bedding, T. R., & Buzasi, D. 2006, A&A, 448, 709 [NASA ADS] [CrossRef] [EDP Sciences] (In the text)
- Stolzmann, W., & Bloecker, T. 1996, A&A, 314, 1024 [NASA ADS] (In the text)
- Unno, W. 1967, PASJ, 19, 140 [NASA ADS] (In the text)
- Van Hoolst, T., Dziembowski, W. A., & Kawaler, S. D. 1998, MNRAS, 297, 536 [NASA ADS] [CrossRef]
- Ventura, P., Zeppieri, A., Mazzitelli, I., & D'Antona, F. 1998, A&A, 334, 953 [NASA ADS] (In the text)
- Ventura, P., D'Antona, F., & Mazzitelli, I. 2008, Ap&SS, 316, 93 [NASA ADS] [CrossRef] (In the text)
- Wedemeyer, S., Freytag, B., Steffen, M., Ludwig, H.-G., & Holweger, H. 2004, A&A, 414, 1121 [NASA ADS] [CrossRef] [EDP Sciences]
- Xiong, D. R., & Deng, L. 2001, MNRAS, 324, 243 [NASA ADS] [CrossRef]
- Xiong, D. R., & Deng, L. 2007, MNRAS, 378, 1270 [NASA ADS] [CrossRef] (In the text)
- Xiong, D. R., Cheng, Q. L., & Deng, L. 1997, ApJS, 108, 529 [NASA ADS] [CrossRef] (In the text)
- Xiong, D. R., Cheng, Q. L., & Deng, L. 2000, MNRAS, 319, 1079 [NASA ADS] [CrossRef]
Footnotes
- ... H.-G. Ludwig
![[*]](/icons/foot_motif.png)
- CIFIST Marie Curie Excellence Team.
All Tables
Table 1: Global parameters of our models.
All Figures
| |
Figure 1: HR diagram with the location of our five models. |
| Open with DEXTER | |
| In the text | |
| |
Figure 2:
Energy density
|
| Open with DEXTER | |
| In the text | |
| |
Figure 3:
Inertia of |
| Open with DEXTER | |
| In the text | |
| |
Figure 4: Theoretical lifetimes of radial modes of model A. The horizontal line corresponds to our choice of the resolution limit (75 days). |
| Open with DEXTER | |
| In the text | |
| |
Figure 5:
Theoretical predictions for |
| Open with DEXTER | |
| In the text | |
| |
Figure 6:
Work integral for the mode |
| Open with DEXTER | |
| In the text | |
| |
Figure 7:
Theoretical predictions for
|
| Open with DEXTER | |
| In the text | |
| |
Figure 8:
Work integrals for the mode |
| Open with DEXTER | |
| In the text | |
| |
Figure 9:
Theoretical predictions for
|
| Open with DEXTER | |
| In the text | |
| |
Figure 10:
Work integral for the mode |
| Open with DEXTER | |
| In the text | |
| |
Figure 11:
Theoretical lifetimes for
|
| Open with DEXTER | |
| In the text | |
| |
Figure 12:
Theoretical heights in the PS for |
| Open with DEXTER | |
| In the text | |
| |
Figure 13:
Theoretical predictions for |
| Open with DEXTER | |
| In the text | |
Copyright ESO 2009
Current usage metrics show cumulative count of Article Views (full-text article views including HTML views, PDF and ePub downloads, according to the available data) and Abstracts Views on Vision4Press platform.
Data correspond to usage on the plateform after 2015. The current usage metrics is available 48-96 hours after online publication and is updated daily on week days.
Initial download of the metrics may take a while.