| Issue |
A&A
Volume 504, Number 1, September II 2009
|
|
|---|---|---|
| Page(s) | 139 - 159 | |
| Section | Interstellar and circumstellar matter | |
| DOI | https://doi.org/10.1051/0004-6361/200811358 | |
| Published online | 09 July 2009 | |
Multi-generation massive star-formation in NGC 3576
C. R. Purcell1,2 - V. Minier3,4 - S. N. Longmore 2,5,6 - Ph. André3,4 - A. J. Walsh2,7 - P. Jones2,8 - F. Herpin9,10 - T. Hill2,11,12 - M. R. Cunningham2 - M. G. Burton2
1 - Jodrell Bank Centre for Astrophysics, Alan Turing
Building, School of Physics and Astronomy, The University of Manchester, Oxford Road, Manchester M13 9PL, UK
2 - School of Physics, University of New South Wales, Sydney, NSW 2052, Australia
3 - CEA, DSM, IRFU, Service d'Astrophysique, 91191 Gif-sur-Yvette, France
4 - Laboratoire AIM, CEA/DSM - CNRS - Université Paris Diderot, IRFU/Service d'Astrophysique, CEA-Saclay, 91191 Gif-sur-Yvette, France
5 - Harvard-Smithsonian Centre For Astrophysics, 60 Garden Street, Cambridge, MA, 02138, USA
6 - CSIRO Australia Telescope National Facillity, PO Box 76, Epping,
NSW 1710, Australia
7 - Centre for Astronomy, James Cook University, Townsville, QLD 4811, Australia
8 - Departmento de Astronoma, Universidad de Chile, Casilla 36-D, Santiago, Chile
9 - Université de Bordeaux, Laboratoire d'Astrophysique de Bordeaux, 33000 Bordeaux, France
10 - CNRS/INSU, UMR 5804, BP 89, 33271 Floirac Cedex, France
11 - School of Physics, University of Exeter, Stocker Road, EX4 4QL, Exeter, UK
12 -
Leiden Observatory, Leiden University, PO BOX 9513, 2300 RA Leiden, the Netherlands
Received 16 November 2008 / Accepted 3 July 2009
Abstract
Context. Recent 1.2-mm continuum observations have shown the giant H II region NGC 3576 to be embedded in the centre of an extended filamentary dust-cloud. The bulk of the filament away from the H II region contains a number of clumps seen only at (sub-)millimetre wavelengths. Infrared and radio observations of the central star cluster have uncovered evidence of sequential star-formation leading us to believe that the adjacent clumps may host massive protostellar objects at a very early stage of evolution.
Aims. We have investigated the physical and chemical conditions in the dusty clumps with the goal of characterising their star-forming content.
Methods. We have used the Australia Telescope Compact Array (ATCA) to image the cloud for the NH3 (1,1), (2,2) and (4,4) transitions, 22 GHz H2O masers, and 23 GHz continuum emission. The 70-m Tidbinbilla dish was used to estimate the total integrated intensity of NH3. We also utilised the 22-m Mopra antenna to map the region for the molecular lines 13CO (1 - 0), C18O (1 - 0), HCO+ (1 - 0), H13CO+ (1 - 0), CS (1 - 0) and N2H+ (1 - 0).
Results. Emission from dense molecular gas follows the morphology of the 1.2-mm dust emission, except towards the central ionised region. The H II region is observed to be expanding into the molecular cloud, sweeping up a clumpy shell of gas, while the central star cluster is dispersing the molecular gas to the east. Analysis of the NH3 data indicates that temperature and linewidth gradients exist in the western arm of the filament. Temperatures are highest adjacent to the central H II region, indicating that the embedded cluster of young stars there is heating the gas. Six new H2O masers were detected in the arms of the filament, all associated with NH3 emission peaks, confirming that star-formation has begun within these cores. Core masses range from 5 to 516 ![]() and most appear to be gravitationally bound. Complementary results by André et al. (2008) imply that seven cores will go on to form massive stars between 15 and 50
and most appear to be gravitationally bound. Complementary results by André et al. (2008) imply that seven cores will go on to form massive stars between 15 and 50 ![]() .
The large scale velocity structure of the filament is smooth, but at least one clump shows the signature of inward gas motions via asymmetries in the NH3 (1,1) line profiles. The same clump exhibits an enhanced abundance of N2H+, which coupled with an absence of CO indicates depletion onto the dust grain surface.
.
The large scale velocity structure of the filament is smooth, but at least one clump shows the signature of inward gas motions via asymmetries in the NH3 (1,1) line profiles. The same clump exhibits an enhanced abundance of N2H+, which coupled with an absence of CO indicates depletion onto the dust grain surface.
Conclusions. The H II region at the heart of NGC 3576 is potentially triggering the formation of massive stars in the bulk of the associated cloud.
Key words: ISM: molecules - stars: formation - HII regions - radio lines: ISM - ISM: abundances - stars: pre-main-sequence
1 Introduction
1.1 Triggered star-formation
A necessary precursor to massive star formation is the existence of dense clumps of self-gravitating gas. Elmegreen (1998) developed the first coherent picture of sequential star formation, in which the formation and collapse of these clumps within giant molecular clouds is triggered by an external event. Three distinct triggering mechanism are considered:
- 1.
- globule squeezing: compression of pre-existing clumps, e.g. due to a propagating shock-wave from a supernova;
- 2.
- cloud-cloud collisions: two molecular clouds collide resulting in gravitational instabilities;
- 3.
- collect and collapse: accumulation of gas into a shell or ridge, and subsequent fragmentation and collapse.
![\begin{figure}
\par\includegraphics[width=17cm,clip]{figs/11358fg1.eps}
\end{figure}](/articles/aa/full_html/2009/34/aa11358-08/img19.png) |
Figure 1:
Overview of the NGC 3576 star forming region. a) SPITZER 5.8 |
| Open with DEXTER | |
It is important to note that energy injected into molecular clouds by newly formed stars may instead quench the star formation
process. Supersonic particle-winds from massive stars account for
![]() 0.1-1.0 per cent of the stellar luminosity and act to
disperse molecular material and dust (e.g., Genzel 1991). The two most important feedback mechanisms, photo-ionisation and cluster winds, compete with each other to disrupt the cloud. On the scale of giant molecular clouds, feedback from newly formed stars is responsible for regulating the star-formation rate and hence the evolution of Galactic structure.
0.1-1.0 per cent of the stellar luminosity and act to
disperse molecular material and dust (e.g., Genzel 1991). The two most important feedback mechanisms, photo-ionisation and cluster winds, compete with each other to disrupt the cloud. On the scale of giant molecular clouds, feedback from newly formed stars is responsible for regulating the star-formation rate and hence the evolution of Galactic structure.
In this paper we present new multi-wavelength observations of the giant H II region NGC 3576, which is thought to be undergoing sequential star formation (see Sect. 1.2). We examine the evidence for star formation in the nearby molecular environment.
1.2 Prior observations of NGC 3576
The environment of the giant H II region NGC 3576 (also known as
RCW 57, G291.3-0.7 and IRAS 11097-6102) has been extensively
studied at infrared and radio wavelengths. Figure 1a
presents the 5.8 ![]() m SPITZER IRAC image of the whole star-forming
complex with the H II region at the centre. The hourglass shaped
emission feature running north-south across the centre of the image
likely correspond to a bipolar cavity being
evacuated by the central embedded cluster. The giant molecular cloud
which hosts NGC3576 manifests itself as large extincted areas
to the north-east and south-west, and is at a distance of 2.4 kpc
(Persi et al. 1994). The extent of the H II
region is illustrated by the thick black contour, corresponding to the 3-
m SPITZER IRAC image of the whole star-forming
complex with the H II region at the centre. The hourglass shaped
emission feature running north-south across the centre of the image
likely correspond to a bipolar cavity being
evacuated by the central embedded cluster. The giant molecular cloud
which hosts NGC3576 manifests itself as large extincted areas
to the north-east and south-west, and is at a distance of 2.4 kpc
(Persi et al. 1994). The extent of the H II
region is illustrated by the thick black contour, corresponding to the 3-![]() (54 mJy/beam) level in the 3.4-cm free-free emission
mapped by de Pree et al. (1999). Figure 1b shows the
distribution of the 3.4-cm emission plotted over the
2.17
(54 mJy/beam) level in the 3.4-cm free-free emission
mapped by de Pree et al. (1999). Figure 1b shows the
distribution of the 3.4-cm emission plotted over the
2.17 ![]() m infrared image from 2MASS. The ionised
gas covers the brightest infrared emission, peaking sharply in
the west and extending
m infrared image from 2MASS. The ionised
gas covers the brightest infrared emission, peaking sharply in
the west and extending ![]() 2
2![]() to the
north-east and south. Frogel & Persson (1974) discovered five
near- and mid-infrared sources towards the ionised gas (plotted as circles in Fig. 1), with the brightest source (IRS 1)
located adjacent to the main peak of the radio emission. Further
high resolution photometric observations by Persi et al. (1994) have
revealed the presence of a very young, deeply embedded cluster with
130 members in the same region. Spectra of these sources exhibit deep
9.7
to the
north-east and south. Frogel & Persson (1974) discovered five
near- and mid-infrared sources towards the ionised gas (plotted as circles in Fig. 1), with the brightest source (IRS 1)
located adjacent to the main peak of the radio emission. Further
high resolution photometric observations by Persi et al. (1994) have
revealed the presence of a very young, deeply embedded cluster with
130 members in the same region. Spectra of these sources exhibit deep
9.7 ![]() m silicate absorption features (Moorwood & Salinari 1981),
leading to their interpretation as pre-main-sequence objects.
m silicate absorption features (Moorwood & Salinari 1981),
leading to their interpretation as pre-main-sequence objects.
Table 1: Details of the Australia Telescope Compact Array observing runs.
There is controversial evidence for sequential star formation in NGC 3576. Persi et al. (1994) showed that a steep near-IR colour gradient exists in the embedded cluster, with the reddest, most deeply embedded sources in the west. This implies that star-formation began in the east, gradually moving to the location of the strong radio peak in the west. Such an interpretation is supported by the existence of an electron temperature gradient in the ionised gas (de Pree et al. 1999) indicating that the youngest and hottest stars are located near the sharp western edge of the H II region (Hjellming 1966). High helium abundance in the east may also indicate the presence of a population of older stars and their mass loss (Hanson & Conti 1993). Bright 22 GHz water masers, commonly found in outflows, have been found adjacent to the main radio peak (Caswell 2004), while Norris et al. (1993) also detected two 6.67 GHz methanol maser sites near IRS 1 and IRS 3. Shocked molecular hydrogen emission was measured peaking towards IRS 1 by Oliva & Moorwood (1986), also pointing to the existence of outflows. IRS 1 was later resolved into three components by Moneti (1992) and Barbosa et al. (2003), one of which is seen through scattered light from a cavity or a dusty disk (Moneti 1992). None of the detected infrared sources contributes significantly to the ionisation of the H II region, (Barbosa et al. 2003), however, recent Chandra observations (Townsley 2006) have revealed multiple deeply embedded hard X-ray sources, which may provide the extra ionisation needed.
The H II region was mapped at 1-mm wavelengths for continuum emission, with a resolution of 1![]() ,
by Cheung et al. (1980), who found that the flux density ratio compared to 40-350
,
by Cheung et al. (1980), who found that the flux density ratio compared to 40-350 ![]() m was consistent with optically
thin thermal dust emission. More recently, Hill et al. (2005) used the
SIMBA
m was consistent with optically
thin thermal dust emission. More recently, Hill et al. (2005) used the
SIMBA![]() bolometer to map 1.2-mm continuum emission at a resolution of
bolometer to map 1.2-mm continuum emission at a resolution of ![]() 24
24
![]() ,
as shown in
Fig. 1c and via white contours in
Fig. 1a. The SIMBA field covers an area of
,
as shown in
Fig. 1c and via white contours in
Fig. 1a. The SIMBA field covers an area of
![]()
![]() ,
centred on the radio peak and reveals that the H II region is embedded in a filamentary structure of cool dust, running north-east to south-west. The H II region is prominent at the centre, however, several bright knots are apparent along the length of the filament. These clumps, designated S1-S5 in this work, fall along the dark lane traversing the nebulosity in the near-infrared image, and are coincident with infrared-dark clouds (IRDCs) in the mid-infrared (e.g., the 5.8
,
centred on the radio peak and reveals that the H II region is embedded in a filamentary structure of cool dust, running north-east to south-west. The H II region is prominent at the centre, however, several bright knots are apparent along the length of the filament. These clumps, designated S1-S5 in this work, fall along the dark lane traversing the nebulosity in the near-infrared image, and are coincident with infrared-dark clouds (IRDCs) in the mid-infrared (e.g., the 5.8 ![]() m IRAC image). IRDCs have been found throughout the Galactic plane with masses in excess of 30
m IRAC image). IRDCs have been found throughout the Galactic plane with masses in excess of 30 ![]() and it has been suggested they are the cold precursors to massive star clusters (e.g., Pillai et al. 2006; Rathborne et al. 2006).
and it has been suggested they are the cold precursors to massive star clusters (e.g., Pillai et al. 2006; Rathborne et al. 2006).
NGC 3576 constitutes an ideal laboratory in which to study the process of massive star formation. In particular, we aim to investigate if the H II region is interacting with the dusty filament and if star-formation has been triggered in the dense knots along its length. Here we present new observations of the whole filament in several molecular tracers, with the goal of constraining the star-forming properties of these new clumps (S1, S2, S4 & S5), and determining the effect of the H II region on the complex.
2 Observations and data reduction
Data from three telescopes, the Australia Telescope Compact Array (ATCA), the 22-m Mopra telescope and the 70-m Tidbinbilla telescope, were combined to assemble a picture of NGC 3576. The ATCA was used to obtain high resolution NH3 maps as a probe of the density and temperature structure of the clumps within the filament. We simultaneously searched for UCH II regions via their 23 GHz free-free continuum emission. We used the Tidbinbilla telescope to map the extended NH3 emission, providing a measure of the total column of NH3 in the filament and an estimation of the ``missing flux'' in the interferometer images. We utilised the Mopra telescope to map the complex in the 3-mm lines 13CO (1-0), C18O (1-0), HCO+ (1-0), H13CO+ (1-0), N2H+ (1-0) and CS (2 - 1), with the goal of probing the physical and chemical conditions in each of the dusty clumps. Line rest frequencies and electronic constants for each transition are noted in Table A.1 in the Appendix.
2.1 ATCA observations
Observations were made with the ATCA in three blocks during the years
2003-2005. Table 1 summarises details of the
dates, array-configurations and frequencies used.
NH3 (1,1) data was obtained using the EW367 and H75 array
configurations in August 2003 and July 2005, respectively. Two
orthogonal linear polarisations were observed at each frequency. The
raw data were processed in a correlator, which was configured to
deliver a bandwidth of ![]() 101 km s-1 split into
101 km s-1 split into
![]() 0.2 km s-1 wide channels. NH3 (2,2) was observed simultaneously with NH3 (1,1) on the H75 array in July 2005. Due to technical constraints only 128 channels were available on the correlator,
yielding a spectral resolution of
0.2 km s-1 wide channels. NH3 (2,2) was observed simultaneously with NH3 (1,1) on the H75 array in July 2005. Due to technical constraints only 128 channels were available on the correlator,
yielding a spectral resolution of ![]() 0.8 km s-1 over the
101 km s-1 bandwidth. In August 2003 the region was also mapped for
23 GHz continuum and 22 GHz water masers using the EW367
array. In July 2004, the 750D array was used to simultaneously
map the NH3 (4,4) transition and 23 GHz continuum. The
correlator configuration was identical to that used to obtain the
NH3 (1,1) data.
0.8 km s-1 over the
101 km s-1 bandwidth. In August 2003 the region was also mapped for
23 GHz continuum and 22 GHz water masers using the EW367
array. In July 2004, the 750D array was used to simultaneously
map the NH3 (4,4) transition and 23 GHz continuum. The
correlator configuration was identical to that used to obtain the
NH3 (1,1) data.
The primary beam of the ATCA at 23 GHz has a full width half maximum (FWHM) of 2.5![]() .
In order to cover the extent of the 1.2 mm continuum emission we observed five overlapping fields, marked by dashed circles in Fig. 1d and centred approximately on the coordinates of the dusty SIMBA clumps. Table 2 lists the
coordinates of the pointing centres. Each of the five fields was
observed for 10 min in turn, over the course of one hour and this
pattern was repeated for 10 h, giving a total of 1.7 h on each
position. In order to correct for fluctuations in the phase and amplitude caused by atmospheric and instrumental effects, a strong phase calibrator was observed for two minutes before and after changing fields. The instrumental contribution to the bandpass shape was measured by integrating on a strong continuum source (e.g., 0420-014) and was subsequently subtracted from all spectra. A primary flux calibrator (1934-638 or Uranus) was observed once per observation period, to allow the absolute calibration of the flux scale.
.
In order to cover the extent of the 1.2 mm continuum emission we observed five overlapping fields, marked by dashed circles in Fig. 1d and centred approximately on the coordinates of the dusty SIMBA clumps. Table 2 lists the
coordinates of the pointing centres. Each of the five fields was
observed for 10 min in turn, over the course of one hour and this
pattern was repeated for 10 h, giving a total of 1.7 h on each
position. In order to correct for fluctuations in the phase and amplitude caused by atmospheric and instrumental effects, a strong phase calibrator was observed for two minutes before and after changing fields. The instrumental contribution to the bandpass shape was measured by integrating on a strong continuum source (e.g., 0420-014) and was subsequently subtracted from all spectra. A primary flux calibrator (1934-638 or Uranus) was observed once per observation period, to allow the absolute calibration of the flux scale.
Table 2: Centre coordinates of the ATCA fields corresponding approximately to the peak 1.2-mm emission.
The data were reduced using the MIRIAD package
(Sault et al. 1995) following standard procedures. During the data
reduction the sources were assumed to be unpolarised and both
polarisations were averaged together. Continuum emission was
subtracted from the spectral line data by using the task uvlin
to fit a polynomial to the line free-channels. An image of the
continuum emission was produced by combining the line-free channels in the NH3 data with the dedicated wide-band 22 and 23 GHz continuum observations. Images were made using the invert task and natural weighting was used to minimise the noise in the image-plane. At this stage the ![]() 3 km baselines to antenna CA06
were discarded as the phases were found to be decorrelated, degrading
the image quality. All images were deconvolved using the standard clean algorithm and, if a sufficiently bright source was present, several iterations of the selfcal task were applied. The above procedure was performed on all fields, before using the task
linmos to mosaic the data into a single map. Finally the
NH3 data were converted to a brightness temperature scale in
Kelvin, using the Jy/K scaling factors noted in
Table 1.
3 km baselines to antenna CA06
were discarded as the phases were found to be decorrelated, degrading
the image quality. All images were deconvolved using the standard clean algorithm and, if a sufficiently bright source was present, several iterations of the selfcal task were applied. The above procedure was performed on all fields, before using the task
linmos to mosaic the data into a single map. Finally the
NH3 data were converted to a brightness temperature scale in
Kelvin, using the Jy/K scaling factors noted in
Table 1.
2.2 Mopra observations
The Mopra observations were conducted in ``on the fly'' (OTF) mapping mode, between the months June-September, during 2004 and 2005. An image was built up by combining overlapping scan rows, each containing 30-40 spectra. Scan rows were offset by half of the beam-FWHM and the scanning speed was slow enough to ensure Nyquist sampling in the scan direction.
NGC 3576 was divided into an overlapping mosaic of three or more
5![]()
![]() 5
5![]() fields, positioned to cover the
1.2-mm continuum emission. The pointing centres of individual fields
varied, depending on where molecular emission was detected, and the
final maps were assembled by co-adding individual fields
together. Each field took
fields, positioned to cover the
1.2-mm continuum emission. The pointing centres of individual fields
varied, depending on where molecular emission was detected, and the
final maps were assembled by co-adding individual fields
together. Each field took ![]() 80 min to complete, plus a
further
80 min to complete, plus a
further ![]() 10 min for pointing checks and calibration
measurements.
10 min for pointing checks and calibration
measurements.
The signal from the receiver was processed in a digital
auto-correlator, configured to have a bandwidth of 64 MHz divided
into 1024 channels, which provided a velocity resolution of
![]() 0.2 km s-1 over a usable bandwidth of
0.2 km s-1 over a usable bandwidth of
![]() 120 km s-1. The central frequency was chosen so that
channel 512 was centred on the systemic velocity of NGC 3576 at
-24 km s-1. Observations were made in dual orthogonal linear
polarisation mode and the polarisations were averaged together during
the reduction procedure. The pointing accuracy was checked using a
nearby SiO maser before observing each field and was estimated to be better than 8
120 km s-1. The central frequency was chosen so that
channel 512 was centred on the systemic velocity of NGC 3576 at
-24 km s-1. Observations were made in dual orthogonal linear
polarisation mode and the polarisations were averaged together during
the reduction procedure. The pointing accuracy was checked using a
nearby SiO maser before observing each field and was estimated to be better than 8
![]() .
Calibration to the
.
Calibration to the
![]() scale was achieved by measuring the emission from a single hot load placed in front of the receiver every 20 min (see Ladd et al. 2005 and
Kutner & Ulich 1981). The maps were further calibrated onto the
main-beam brightness temperature scale (
scale was achieved by measuring the emission from a single hot load placed in front of the receiver every 20 min (see Ladd et al. 2005 and
Kutner & Ulich 1981). The maps were further calibrated onto the
main-beam brightness temperature scale (
![]() )
by dividing the
)
by dividing the
![]() pixel values by the main beam efficiency
pixel values by the main beam efficiency
![]() at the observing frequency (see
Table 4 of Ladd et al. 2005).
at the observing frequency (see
Table 4 of Ladd et al. 2005).
![\begin{figure}
\par\includegraphics[angle=0, width=17.0cm, trim=-0 -20 0 0]{figs/11358fg2.eps}
\end{figure}](/articles/aa/full_html/2009/34/aa11358-08/img34.png) |
Figure 2:
a) Integrated intensity map of the NH3 (1,1) emission (thin black and white contours, and greyscale) made using the combined ATCA H75 and EW367 data. Contours are at 1.6, 7.9, 13.8, 20.0, 25.7, 31.5, 37.4, 43.6 and 50.1 K. The extent of the 23 GHz continuum emission from the central H II region is marked by the thick black contour. The 1.2-mm dust emission is outlined by a single white contour ( |
| Open with DEXTER | |
The data were reduced using the LIVEDATA and GRIDZILLA packages, available from the
ATNF![]() . LIVEDATA performed bandpass calibration by subtracting the preceding OFF spectrum from the SCAN spectra in each row. A low-order polynomial was then fit to line-free channels and subtracted, resulting in a smooth baseline at zero Kelvin. The spectra were assigned individual position stamps and regridded to the LSR-K reference frame, before
being written to disk. The GRIDZILLA package was then used to resample the maps to a regular pixel scale, weighted according to the system temperature (
. LIVEDATA performed bandpass calibration by subtracting the preceding OFF spectrum from the SCAN spectra in each row. A low-order polynomial was then fit to line-free channels and subtracted, resulting in a smooth baseline at zero Kelvin. The spectra were assigned individual position stamps and regridded to the LSR-K reference frame, before
being written to disk. The GRIDZILLA package was then used to resample the maps to a regular pixel scale, weighted according to the system temperature (
![]() ). To grid the data we used a pixel-size of
). To grid the data we used a pixel-size of
![]() arcseconds and a Gaussian smoothing kernel with a FWHM of 18
arcseconds and a Gaussian smoothing kernel with a FWHM of 18
![]() ,
truncated at an angular offset of 36
,
truncated at an angular offset of 36
![]() .
The final data cubes were smoothed to an angular resolution of
.
The final data cubes were smoothed to an angular resolution of ![]() 40
40
![]() .
.
2.3 Tidbinbilla observations
The 70-m antenna located at the NASA Tidbinbilla Deep Space Communications Complex near Canberra has a limited time devoted to radio astronomy. When Mars is above the horizon the 70-m telescope is almost entirely utilised supporting the various NASA missions to that planet and as such has been little used by the radio astronomy community. In 2005 we performed the first frequency-switched spectral line mapping observations using the 23 GHz K-band receiver. Fast frequency switching also provides better cancellation of atmospheric emission fluctuations, however, the response of the receiver may vary considerably with frequency, resulting in poor spectroscopic baselines.
We targeted the same five fields in NGC 3576 as were observed with
the ATCA. The OTF method had not yet been implemented on the 70-m
antenna so we observed each field as a square grid of
![]() positions, spaced by half the 45
positions, spaced by half the 45
![]() beam-FWHM. Each position was observed for 10 min and the pointing accuracy was checked by
observing an unresolved planet (Jupiter) every hour. Pointing errors were usually below 10
beam-FWHM. Each position was observed for 10 min and the pointing accuracy was checked by
observing an unresolved planet (Jupiter) every hour. Pointing errors were usually below 10
![]() or 1/4 beam. Individual maps took 5-6 h to complete, including 15 min to measure the
atmospheric opacity using the ``skydip'' method. During the observations the data were calibrated against an ambient load (a noise diode) and the zenith system temperature at 23 GHz was typically 40-50 K during the observations. We estimate the
or 1/4 beam. Individual maps took 5-6 h to complete, including 15 min to measure the
atmospheric opacity using the ``skydip'' method. During the observations the data were calibrated against an ambient load (a noise diode) and the zenith system temperature at 23 GHz was typically 40-50 K during the observations. We estimate the
![]() flux scale is uncertain by
flux scale is uncertain by ![]() 10 per cent. The peak aperture efficiency was measured as
10 per cent. The peak aperture efficiency was measured as
![]() % at 22.2 GHz by
Greenhill et al. (2003) and we adopt that value here to correct the data onto the main beam brightness temperature flux scale (
% at 22.2 GHz by
Greenhill et al. (2003) and we adopt that value here to correct the data onto the main beam brightness temperature flux scale (
![]() ). To convert to units of Jy/beam the data were multiplied by
0.951 (Jy/beam)/K.
). To convert to units of Jy/beam the data were multiplied by
0.951 (Jy/beam)/K.
The K-band receiver on the 70-m antenna measured only the left
circular polarisation. The bandpass was centred mid-way
between the NH3 (1,1) and (2,2) transitions and the correlator
was configured to have a 64 MHz wide bandpass divided into 2048 channels. Both the NH3(1,1) and (2,2) spectra, including
satellite lines, fell well inside the 850 km s-1 usable range and were
observed at a velocity resolution of ![]() 0.4 km s-1.
0.4 km s-1.
The data were reduced in an ad-hoc pipeline built
using the SPC, GILDAS and MIRIAD packages. SPC was used initially to quotient and resample the spectra to a common
![]() rest-frame. The spectra were inverted and frequency-shifted in the CLASS package.
As the spectral baselines were poor, a polynomial of order 5-9 (in extreme cases) was fit to the line-free channels before spectra
from individual integrations were averaged together. The data were
then assembled into a 3D data-cube using the cube command in the GREG package and resampled onto a finer spatial pixel grid using the fill_cube command. Finally, the data were output as fits cubes and MIRIAD was used to restore missing header information, such as the beam-size and data-unit.
rest-frame. The spectra were inverted and frequency-shifted in the CLASS package.
As the spectral baselines were poor, a polynomial of order 5-9 (in extreme cases) was fit to the line-free channels before spectra
from individual integrations were averaged together. The data were
then assembled into a 3D data-cube using the cube command in the GREG package and resampled onto a finer spatial pixel grid using the fill_cube command. Finally, the data were output as fits cubes and MIRIAD was used to restore missing header information, such as the beam-size and data-unit.
3 Results
Molecular emission was detected from all of the clumps identified in the SIMBA map. The following subsections describe the results from the ATCA, Tidbinbilla and Mopra telescopes separately.
3.1 ATCA results
We detected NH3 (1,1), and NH3 (2,2) across the whole
filament. NH3 (4,4) was not detected down to a sensitivity
limit of ![]() 8 mJy/beam (1.0 K) when the data were smoothed
to a velocity resolution of 1 km s-1. The J,K = (4,4) level is
excited by gas above 200 K (see Fig. 1 in Ho & Townes 1983), hence
no substantial reservoirs of hot gas are present in
NGC 3576. Figures 2a and b present
the NH3 (1,1) and (2,2) integrated intensity
maps of the region. The NH3 (1,1) map utilises data from both
the H75 and EW367 array configurations and has a resolution of
8 mJy/beam (1.0 K) when the data were smoothed
to a velocity resolution of 1 km s-1. The J,K = (4,4) level is
excited by gas above 200 K (see Fig. 1 in Ho & Townes 1983), hence
no substantial reservoirs of hot gas are present in
NGC 3576. Figures 2a and b present
the NH3 (1,1) and (2,2) integrated intensity
maps of the region. The NH3 (1,1) map utilises data from both
the H75 and EW367 array configurations and has a resolution of
![]() 11
11
![]() .
Only H75 data exist for the NH3 (2,2)
transition and the resulting map has a resolution of
.
Only H75 data exist for the NH3 (2,2)
transition and the resulting map has a resolution of
![]() 23
23
![]() .
For reference, the 5 per cent contour
(0.3 Jy/beam) of the SIMBA 1.2-mm continuum emission is plotted in
white. The thick black line is the 3 per cent contour (0.11 Jy/beam)
of the 23-GHz continuum emission from the central
H II region. We see the NH3 emission has approximately the same
morphology in both transitions and closely follows the structure of
the 1.2-mm dust emission, except immediately to the east of the
central H II region (SIMBA clumps S2 &
S3). The 1.2-mm emission in these clumps is over 50 percent
contaminated by free-free emission (see André et al. 2008). Sample
NH3 (1,1) and (2,2) spectra from peak positions on the integrated intensity maps (labelled S1a-S5b) are presented in Figs. 2c
and -d. Both of the NH3 transitions exhibit the classic
``five-finger'' profiles at all positions. Some asymmetries between the NH3 (1,1)
satellite lines are evident towards all positions, however, for
the most part the spectra appear optically thin, exhibiting
optical depths between
.
For reference, the 5 per cent contour
(0.3 Jy/beam) of the SIMBA 1.2-mm continuum emission is plotted in
white. The thick black line is the 3 per cent contour (0.11 Jy/beam)
of the 23-GHz continuum emission from the central
H II region. We see the NH3 emission has approximately the same
morphology in both transitions and closely follows the structure of
the 1.2-mm dust emission, except immediately to the east of the
central H II region (SIMBA clumps S2 &
S3). The 1.2-mm emission in these clumps is over 50 percent
contaminated by free-free emission (see André et al. 2008). Sample
NH3 (1,1) and (2,2) spectra from peak positions on the integrated intensity maps (labelled S1a-S5b) are presented in Figs. 2c
and -d. Both of the NH3 transitions exhibit the classic
``five-finger'' profiles at all positions. Some asymmetries between the NH3 (1,1)
satellite lines are evident towards all positions, however, for
the most part the spectra appear optically thin, exhibiting
optical depths between
![]() and
and
![]() .
Linewidths vary between 1 and 2.5 km s-1, and peak
brightness temperatures range between 4.4 and 8 K for the
NH3 (1,1) line and between 1.2 and 2.6 K
for the NH3 (2,2) lines. Individual line profiles in the western arm of the filament show clear evidence of blending and multiple components, especially towards positions S3b, S3c, S4b and S5a.
.
Linewidths vary between 1 and 2.5 km s-1, and peak
brightness temperatures range between 4.4 and 8 K for the
NH3 (1,1) line and between 1.2 and 2.6 K
for the NH3 (2,2) lines. Individual line profiles in the western arm of the filament show clear evidence of blending and multiple components, especially towards positions S3b, S3c, S4b and S5a.
![\begin{figure}
\par\includegraphics[width=8.0cm,clip]{figs/11358fg3.eps}
\end{figure}](/articles/aa/full_html/2009/34/aa11358-08/img43.png) |
Figure 3:
23-GHz continuum emission from the
H II region at the centre of the NGC 3576 complex
(contours) overlaid on the 3.6 |
| Open with DEXTER | |
23 GHz continuum was observed simultaneously with each of the
NH3 lines. To make the final map we combined data from the EW367,
H75 and 750D arrays, including the continuum visibilities from the
line-free channels in the narrow-band spectral line windows. No
23 GHz continuum emission was detected
outside of the central H II region, down to a
sensitivity limit of
![]() 0.5 mJy/beam. Figure 3 presents the
image of the H II region at
23 GHz. ``
0.5 mJy/beam. Figure 3 presents the
image of the H II region at
23 GHz. ``![]() '' and ``+'' symbols mark the positions of known 6.67 GHz methanol masers and 22 GHz water masers, respectively
(Norris et al. 1993; Caswell 2004).
The contours are similar to the central part of the 3.4-cm map made by
de Pree et al. (1999) (see Fig. 1b), with a single strong peak at 11
'' and ``+'' symbols mark the positions of known 6.67 GHz methanol masers and 22 GHz water masers, respectively
(Norris et al. 1993; Caswell 2004).
The contours are similar to the central part of the 3.4-cm map made by
de Pree et al. (1999) (see Fig. 1b), with a single strong peak at 11![]() 11
11![]() 51.08
51.08![]() ,
-61
,
-61![]() 18
18![]() 50.0
50.0![]() (J2000) and diffuse
emission extending eastward into SIMBA clump S2. The 23 GHz flux density at the peak is
3.6 Jy/beam and we measure a total integrated intensity of approximately
42.6 Jy. By comparison, the total flux at 3.4-cm is measured to be
71 Jy. Our observations sample the uv-plane less well than
de Pree et al. (1999) and we likely filter out a significant fraction of
the extended emission. Our values are consistent with free-free
emission from optically-thin ionised gas
(S
(J2000) and diffuse
emission extending eastward into SIMBA clump S2. The 23 GHz flux density at the peak is
3.6 Jy/beam and we measure a total integrated intensity of approximately
42.6 Jy. By comparison, the total flux at 3.4-cm is measured to be
71 Jy. Our observations sample the uv-plane less well than
de Pree et al. (1999) and we likely filter out a significant fraction of
the extended emission. Our values are consistent with free-free
emission from optically-thin ionised gas
(S
![]() )
if we are missing
)
if we are missing ![]() 34 percent
of the flux detected at 3.4-cm.
34 percent
of the flux detected at 3.4-cm.
We also searched for 22 GHz water maser emission across the
filament. New masers were detected at six positions, as well as at the three previously known sites adjacent to
IRS 1, IRS 3 and IRS 4. Figure 4 presents a
cumulative spectrum from a single baseline showing the majority of
the maser lines detected. Two groupings of lines are observed, the
first centred at approximately -115 km s-1 (with two components at -130 and -100 km/,s-1) and the second centred at -30 km s-1. The intense lines at -130 and -100 km s-1 have peak amplitudes of ![]() 70 and
70 and ![]() 900 Jy/beam, respectively, and derive from maser sites towards the central H II region. Maser sites scattered across the 1.2-mm continuum filament contribute to the group of lines between -60 and
-10 km s-1. Figure 5 presents the maser spectra
and illustrates the positions of individual maser sites superimposed
on the NH3 (1,1) zeroth-moment image. Precise coordinates, intensities and
velocities are noted in Table 3.
900 Jy/beam, respectively, and derive from maser sites towards the central H II region. Maser sites scattered across the 1.2-mm continuum filament contribute to the group of lines between -60 and
-10 km s-1. Figure 5 presents the maser spectra
and illustrates the positions of individual maser sites superimposed
on the NH3 (1,1) zeroth-moment image. Precise coordinates, intensities and
velocities are noted in Table 3.
![\begin{figure}
\par\includegraphics[angle=0, width=14.0cm, trim=0 0 -0 0]{figs/11358fg4.eps}
\end{figure}](/articles/aa/full_html/2009/34/aa11358-08/img45.png) |
Figure 4: Cumulative H2O maser spectrum from a single baseline showing lines from across the filament. The two broad maser lines at -130 km s-1and -102 km s-1 derive from positions M9 and M5, respectively, towards the central H II region (see Table 3). The bulk of the maser lines concentrated near the systemic velocity at -24 km s-1 are scattered across the filament. The units of amplitude are arbitrary. |
| Open with DEXTER | |
![\begin{figure}
\par\includegraphics[angle=0, width=15.cm, trim=0 0 -20 0]{figs/11358fg5.eps}
\end{figure}](/articles/aa/full_html/2009/34/aa11358-08/img46.png) |
Figure 5:
Positions and spectra for the 22 GHz H2O masers
detected in our ATCA EW367 array data. Six masers (M1, M2, M3, M6,
M7 and M8) are new detections. Greyscale and black contours are
the NH3 (1,1) integrated intensity map. The white line is
the |
| Open with DEXTER | |
Table 3: 22 GHz H2O masers in NGC 3576.
3.2 Tidbinbilla results
![\begin{figure}
\par\includegraphics[angle=0, width=18.cm, trim=0 0 -20 0]{figs/11358fg6.eps}
\end{figure}](/articles/aa/full_html/2009/34/aa11358-08/img47.png) |
Figure 6: NH3 (1,1) and (2,2) integrated intensity maps made using the 70-m Tidbinbilla telescope (greyscale and contours). Contours levels are at 10 percent intervals. The single thick black contour shows the extent of the 1.2 mm continuum emission (Hill et al. 2005). The grid inset into the NH3 (1,1) map illustrates the spectra which contributed to the map of the S5 field. |
| Open with DEXTER | |
NH3 (1,1) and (2,2) integrated intensity maps made using the Tidbinbilla 70-m telescope are presented in Fig. 6. Individual maps are centred on the same position as the ATCA fields, however, technical difficulties meant that we were unable to finish one column of field S3, covering the H II region. It is immediately evident that the morphology of the emission is similar to that seen in the the ATCA NH3 (1,1) data.
We initially intended to use data from the 70-m antenna to ``fill in'' the missing short-spacings in our ATCA data. For the merging to be successful, the emission in the single-dish dataset must be imaged out to its extremes. Unfortunately, there is still considerable flux at the edge of all fields and, due to time constraints and the experimental nature of the observations, we were unable to enlarge the maps. Instead, the Tidbinbilla data is used to estimate the fraction of missing flux due to extended emission in each of the ATCA fields. To do this we smoothed the final ATCA maps to the same resolution and pixel scale as the Tidbinbilla maps and compared the integrated intensities measured under the same aperture. The percentage ATCA/Tidbinbilla integrated intensity ratios are presented in Table 4. Calibration error on the Tidbinbilla data is approximately 30 percent and the measurements are consistent with less than 10 percent missing flux in the ATCA fields.
Table 4: ATCA NH3 percentage flux detected.
The estimates assume a beam-efficiency of 48 per cent for the 70-m telescope (Greenhill et al. 2003) and a (Jy/Beam)/K conversion factor of 0.951.
3.3 Mopra results
![\begin{figure}
\par\includegraphics[angle=00, width=17cm, trim=0 0 -0 0]{figs/11358fg7.eps}
\end{figure}](/articles/aa/full_html/2009/34/aa11358-08/img48.png) |
Figure 7: Integrated intensity (zeroth-moment) maps of NGC 3576 in the six molecular transitions observed with the Mopra telescope ( left panels). Sample spectra, extracted from the data cube at the positions S1-S5, are presented to the right of each map. 13CO is generally optically thick and is a good tracer of the extended molecular envelope. HCO+ and H13CO+ trace similar gas densities to CO, while CS and N2H+ trace denser gas. |
| Open with DEXTER | |
Figure 7 presents integrated intensity
maps and sample spectra for all six molecules detected by Mopra towards NGC 3576. The data have been smoothed to a velocity
resolution of 0.4 km s-1and have a spatial resolution of 40
![]() .
Sample spectra presented alongside each map were extracted from the
data-cubes at the peak positions of the SIMBA clumps (labelled
S1-S5) identified in the 1.2-mm continuum map and marked by
filled circles in Fig. 7.
.
Sample spectra presented alongside each map were extracted from the
data-cubes at the peak positions of the SIMBA clumps (labelled
S1-S5) identified in the 1.2-mm continuum map and marked by
filled circles in Fig. 7.
As with NH3, the distribution of the other molecular lines
closely follow the 1.2-mm emission except to the east of the central
H II region. 13CO (1-0) and
HCO+ (1-0) trace more extended gas than the other lines, and
their spectra appear moderately
optically thick compared to their isotopologues, C18O (1-0)
and H13CO+ (1-0). N2H+ and CS both trace dense gas, however N2H+ exhibits optically thin line profiles (![]() )
at all positions while CS appears optically thick in places. The relative intensity of the emission between species varies significantly over the extent of the cloud, likely due to differences in the chemistry of the clumps. We discuss this possibility further in Sect. 5.3.
)
at all positions while CS appears optically thick in places. The relative intensity of the emission between species varies significantly over the extent of the cloud, likely due to differences in the chemistry of the clumps. We discuss this possibility further in Sect. 5.3.
At position S2 the spectra of all species display three line components, offset in velocity by ![]() 4 km s-1. Spectra
sampled at the other positions appear as a single line profile. These
lines are not well fit by single Gaussians except at position S5 and
are possibly composed of several blended features. Taking the
optically thin N2H+ as an example, the peak
4 km s-1. Spectra
sampled at the other positions appear as a single line profile. These
lines are not well fit by single Gaussians except at position S5 and
are possibly composed of several blended features. Taking the
optically thin N2H+ as an example, the peak
![]() of the
emission in the western arm (SIMBA clumps S3-S5) has a mean
velocity of -
of the
emission in the western arm (SIMBA clumps S3-S5) has a mean
velocity of -
![]() km s-1, while the eastern arm (SIMBA clumps S1 and S2) has a mean velocity of -
km s-1, while the eastern arm (SIMBA clumps S1 and S2) has a mean velocity of -
![]() km s-1. No large velocity gradients are apparent, but the two arms are offset in velocity by
km s-1. No large velocity gradients are apparent, but the two arms are offset in velocity by ![]() 1 km s-1. The full-width half-maximum N2H+ linewidths ranges between approximately 1 and 3 km s-1 across the filament, with the highest values occurring adjacent to the H II region.
1 km s-1. The full-width half-maximum N2H+ linewidths ranges between approximately 1 and 3 km s-1 across the filament, with the highest values occurring adjacent to the H II region.
4 Derived properties
In this section we derive physical properties, such as temperature and density, from the molecular line data. The detailed methodology used in the calculations is presented in the appendix. We discuss the results in Sect. 5 where we analyse the morphology, kinematics, relative chemical abundances and star-forming content in detail.
4.1 Physical properties from NH3
The rotation-inversion transitions of NH3 have been used extensively in the literature to derive the kinetic temperature and column densities of molecular clouds (e.g., Bourke et al. 1995; Ungerechts et al. 1986; Cesaroni et al. 1992). Due to its quantum mechanical properties, the NH3 inversion spectrum is split into multiple hyperfine components from whose brightness ratios the optical depth may be derived directly, hence removing a major assumption from the calculation of rotational temperatures.
4.1.1 Kinetic temperature
The modified rotational diagram method used to calculate rotational
temperature (
![]() )
from NH3 has been described in
detail by Ho et al. (1977), Ungerechts et al. (1980) and
Townes et al. (1983). We provide a brief summary of the procedure in the appendix, specifically for the NH3 (1,1) and (2,2)
transitions. The molecular constants used in the calculations are
collected in Table A.1.
)
from NH3 has been described in
detail by Ho et al. (1977), Ungerechts et al. (1980) and
Townes et al. (1983). We provide a brief summary of the procedure in the appendix, specifically for the NH3 (1,1) and (2,2)
transitions. The molecular constants used in the calculations are
collected in Table A.1.
![\begin{figure}
\par\includegraphics[width=17.0cm, angle=0, trim=0 -20 0 0]{figs/11358fg8.eps}
\end{figure}](/articles/aa/full_html/2009/34/aa11358-08/img55.png) |
Figure 8:
a) Map of the kinetic temperature derived from the ratio of the NH3 (1,1) and (2,2)
lines. The beam size is
|
| Open with DEXTER | |
Figure 8a presents a kinetic temperature map of
NGC 3576 made using the NH3 (1,1) and (2,2) data from the ATCA H75 array observations only. At a resolution of ![]() 23
23
![]() ,
the map reflects the beam averaged temperature of gas above a density of
,
the map reflects the beam averaged temperature of gas above a density of
![]() cm-3 (Swade 1989). Higher resolution
observations would doubtlessly reveal regions with hotter or cooler
temperatures than average. An obvious temperature gradient exists
across parts of the filament. Figure 8b plots
kinetic temperature as a function of angular offset from the peak of
the ionised emission. The data were sampled at 12 positions,
corresponding roughly to the peaks of the NH3 clumps in
Fig. 2. The median precision on
the kinetic temperature values is approximately 2.4 K and stems
from the uncertainties in the Gaussian fits. We find that the kinetic
temperature is higher towards regions adjacent to the H II region. In the outlying positions the kinetic temperature is
cm-3 (Swade 1989). Higher resolution
observations would doubtlessly reveal regions with hotter or cooler
temperatures than average. An obvious temperature gradient exists
across parts of the filament. Figure 8b plots
kinetic temperature as a function of angular offset from the peak of
the ionised emission. The data were sampled at 12 positions,
corresponding roughly to the peaks of the NH3 clumps in
Fig. 2. The median precision on
the kinetic temperature values is approximately 2.4 K and stems
from the uncertainties in the Gaussian fits. We find that the kinetic
temperature is higher towards regions adjacent to the H II region. In the outlying positions the kinetic temperature is
![]() 12 K, increasing to
12 K, increasing to ![]() 30 K towards the centre. Some hot
spots with temperatures above 40 K exist to the east of the H II region (between RAs of
11
30 K towards the centre. Some hot
spots with temperatures above 40 K exist to the east of the H II region (between RAs of
11![]() 12
12![]() 00
00![]() and 11
and 11![]() 12
12![]() 15
15![]() ), but the signal-to-noise
ratio in this part of the map is poor, hence the derived temperatures are more uncertain (
), but the signal-to-noise
ratio in this part of the map is poor, hence the derived temperatures are more uncertain (![]() 8 K). Derived temperatures above
8 K). Derived temperatures above
![]() 30 K have a large associated uncertainty because of
assumptions made during the calculations (see
Appendix A.1). However, below 20 K Tafalla et al. (2004)
find that kinetic temperatures calculated under the same assumptions
are accurate to better than 5 percent.
30 K have a large associated uncertainty because of
assumptions made during the calculations (see
Appendix A.1). However, below 20 K Tafalla et al. (2004)
find that kinetic temperatures calculated under the same assumptions
are accurate to better than 5 percent.
4.1.2 NH column density and core mass
Assuming local thermal equilibrium (LTE), the total column density of NH3 may be found directly from the integrated intensity of the J,K = (1,1) line via Eq. (A.5) in the appendix. An estimate of the total mass of gas may then be determined from the column density assuming a constant relative abundance to H2.
![\begin{figure}
\par\includegraphics[angle=0, width=17cm, trim=0 -20 0 0]{figs/11358fg9.eps}
\end{figure}](/articles/aa/full_html/2009/34/aa11358-08/img58.png) |
Figure 9:
a) The spatial distribution of cores detected in the NH3 (1,1) data cube using the FELLWALKER routine overplotted on the integrated intensity image. Circles mark the positions of the cores and the radii are scaled to the core mass, as reported in Table 5; b) histogram showing the distribution of core masses assuming a single value of [NH3] / [H2] =
|
| Open with DEXTER | |
Table 5: Properties of the NH3 (1,1) cores found using the FELLWALKER routine in the ATCA data.
In the ![]() 11
11
![]() resolution NH3 (1,1) map we begin to
resolve substructure within the 1.2-mm clumps imaged by SIMBA. We have attempted to decompose the emission using the FELLWALKER
resolution NH3 (1,1) map we begin to
resolve substructure within the 1.2-mm clumps imaged by SIMBA. We have attempted to decompose the emission using the FELLWALKER![]() routine. FELLWALKER attempts to divide regions of emission into cores by searching for positive gradients in the datacube. The algorithm considers each pixel in turn above a lower brightness cutoff and ``walks uphill'', following the steepest ascent until an isolated local peak is reached. All pixels visited are assigned to the same core, which may already exist. Finally, cellular automata fill any holes in the cores and clean up the edges by replacing each cores' index with the the most common value occurring within a
routine. FELLWALKER attempts to divide regions of emission into cores by searching for positive gradients in the datacube. The algorithm considers each pixel in turn above a lower brightness cutoff and ``walks uphill'', following the steepest ascent until an isolated local peak is reached. All pixels visited are assigned to the same core, which may already exist. Finally, cellular automata fill any holes in the cores and clean up the edges by replacing each cores' index with the the most common value occurring within a
![]() pixel cube. The signal/noise
ratio was not constant across the mosaiced NH3 (1,1) map, so the FELLWALKER routine was run on the five SIMBA regions
individually (using the mosaicked data-cube), starting at the same
lower cutoff of 2-
pixel cube. The signal/noise
ratio was not constant across the mosaiced NH3 (1,1) map, so the FELLWALKER routine was run on the five SIMBA regions
individually (using the mosaicked data-cube), starting at the same
lower cutoff of 2-![]() ,
but slightly different tuning
parameters. The results were inspected by
eye and compared to the original data-cube for consistency. Cores
with fewer pixels than the area of the synthesised beam were omitted
as unreliable detections.
,
but slightly different tuning
parameters. The results were inspected by
eye and compared to the original data-cube for consistency. Cores
with fewer pixels than the area of the synthesised beam were omitted
as unreliable detections.
Twenty-five believable cores were found, whose positions are plotted in Fig. 9a. The mass of NH3 in each
core was calculated from the sum of the integrated intensities of the
individual pixels in the core. We assumed excitation
temperatures corresponding to those derived from the
23
![]() resolution H75 data. The total core mass was then estimated
assuming an abundance ratio [NH3] / [H2] of
resolution H75 data. The total core mass was then estimated
assuming an abundance ratio [NH3] / [H2] of
![]() (Wang et al. 2008), and a correction factor of 1.38 for the abundance of
helium and heavier elements in the interstellar medium
(Allen 1973). Table 5
presents the properties of the detected cores and the distribution of
core masses is illustrated in
Fig. 9b. In
Sect. 5.2, below, we have calculated the
NH3 abundance at different positions in the cloud via a
comparison to 450
(Wang et al. 2008), and a correction factor of 1.38 for the abundance of
helium and heavier elements in the interstellar medium
(Allen 1973). Table 5
presents the properties of the detected cores and the distribution of
core masses is illustrated in
Fig. 9b. In
Sect. 5.2, below, we have calculated the
NH3 abundance at different positions in the cloud via a
comparison to 450 ![]() m data. Column 11 presents the core masses
corrected for these results.
m data. Column 11 presents the core masses
corrected for these results.
Virial masses were calculated from the velocity width and average
radius of the NH3 cores reported by FELLWALKER.
Neglecting support from magnetic fields or internal heating sources, the virial mass of a simple spherical system is given by (MacLaren et al. 1988):
where
4.2 Physical properties from other molecules
The molecules observed with Mopra towards NGC 3576 were chosen
specifically to probe the physical conditions in different parts of
the cloud. 13CO (
![]() cm-3, see
Table A.1) and C18O emission traces the gas
in the envelope surrounding the dense filament. HCO+ and
H13CO+ have higher critical densities (
cm-3, see
Table A.1) and C18O emission traces the gas
in the envelope surrounding the dense filament. HCO+ and
H13CO+ have higher critical densities (
![]() cm-3) and so probe conditions at
greater depths, but are also proven tracers of outflows and bulk gas
motions (e.g. Rawlings et al. 2004). CS and N2H+ (
cm-3) and so probe conditions at
greater depths, but are also proven tracers of outflows and bulk gas
motions (e.g. Rawlings et al. 2004). CS and N2H+ (
![]() cm-3) have comparable critical
densities but in practise have been shown to trace dense gas (e.g.,
Pirogov et al. 2003; Evans 1999 and references therein).
N2H+ especially, is considered to be useful indicator of the coldest (
cm-3) have comparable critical
densities but in practise have been shown to trace dense gas (e.g.,
Pirogov et al. 2003; Evans 1999 and references therein).
N2H+ especially, is considered to be useful indicator of the coldest (![]() 10 K) and most dense
regions, where it is predicted to be the most abundant gas-phase ion
(Caselli et al. 1995). This is due to the depletion of its main
destruction partner, CO, onto the dust grains.
10 K) and most dense
regions, where it is predicted to be the most abundant gas-phase ion
(Caselli et al. 1995). This is due to the depletion of its main
destruction partner, CO, onto the dust grains.
Assuming LTE conditions, we independently solved for the optical depth, excitation temperature and total column density of CO and HCO+ via the procedure detailed in the Appendix A.3. Figure 10 presents the final column density maps towards NGC 3576. The 13CO peak optical depth ranges from 0.1 to 4.4 and the excitation temperature from 6.4 to 36 K. Peak HCO+ optical depth ranges from 1.9 to 13.1 and excitation temperatures from 4.2 to 13 K. We were unable to independently estimate the excitation temperatures of the CS and N2H+ transitions and so adopted temperatures derived from the NH3 data. This is a reasonable assumption for N2H+ as we expect both nitrogen bearing compounds to be intermixed in the gas phase. We were forced to assume that CS was optically thin, which may not be valid as some of the line profiles appear saturated.
We calculated the total mass of the molecular cloud by assuming the
following abundance ratios to H2: [13CO] / [H2] =
![]() (Goldsmith et al. 1997, assuming an
abundance ratio of [12CO] / [H2] = 45 at a galactocentric
radius of 8 kpc - see Langer & Penzias 1990), [HCO+] / [H
(Goldsmith et al. 1997, assuming an
abundance ratio of [12CO] / [H2] = 45 at a galactocentric
radius of 8 kpc - see Langer & Penzias 1990), [HCO+] / [H
![]() (Zhu et al. 2007),
[CS] / [H2] =
(Zhu et al. 2007),
[CS] / [H2] =
![]() (Pirogov et al. 2007), and
[N2H+]/[H2] =
(Pirogov et al. 2007), and
[N2H+]/[H2] =
![]() (Pirogov et al. 2007). The
values for total cloud mass derived from the CO, HCO+ and
N2H+ observations are all approximately 8300
(Pirogov et al. 2007). The
values for total cloud mass derived from the CO, HCO+ and
N2H+ observations are all approximately 8300 ![]() .
The mass
derived from CS is 12 700
.
The mass
derived from CS is 12 700 ![]() .
These values assume calibration onto the Mopra ``extended beam'' temperature scale, which includes power received from the first sidelobe and is appropriate for data more extended than 80
.
These values assume calibration onto the Mopra ``extended beam'' temperature scale, which includes power received from the first sidelobe and is appropriate for data more extended than 80
![]() (see Sect. 2.1 of Ladd et al. 2005).
(see Sect. 2.1 of Ladd et al. 2005).
![\begin{figure}
\par\includegraphics[angle=00, width=17.0cm, trim=0 -10 0 0]{figs/11358fg10.eps}
\end{figure}](/articles/aa/full_html/2009/34/aa11358-08/img87.png) |
Figure 10: Column density maps of the four species targeted by the Mopra telescope. Contours are set at 10 per cent intervals, beginning at 10 per cent, except in the HCO+ column density map, where they start at 30 per cent of the peak value. |
| Open with DEXTER | |
5 Analysis and discussion
5.1 H2O masers
The
three well-known water maser sites within the central H II region
(labelled M4, M5 and M9 in Fig. 5) have been
investigated by Caswell (2004), who summarises their
properties. At the M4 site (G291.274-0.709) the H2O maser
coexists with 6.67 GHz CH3OH and 1.67 GHz OH masers. In the
H2O maser spectrum we detect bright maser features ranging from -37 km s-1 to 23 km s-1, in agreement with Caswell, however, we also detect weak (<5 Jy) lines out to velocities of -51 km s-1 and +20 km s-1. The M5 site (G291.270-0.719) hosts a weak CH3OH maser at -26 km s-1 and a bright H2O maser at a velocity of -102 km s-1. First reported by Caswell et al. (1989), we find this H2O maser has an unusually broad linewidth (2.9 km s-1) and a peak flux density of 69 Jy, consistent with the original observations. The
![]() of this spectral feature is reported to have become increasingly negative since its discovery in 1989 when it had a velocity of -88 km s-1. This has been interpreted as being due to acceleration of the emitting gas, perhaps in a high velocity outflow (Caswell 2004; Caswell & Phillips 2008). Alternatively, we suggest that the
-102 km s-1 line may be a new maser feature not associated with the component seen at -88 km s-1, which may have been quenched in the intervening time. The
final known site, M9 (G291.284-0.716), exhibits a single intense maser at a velocity of -130 km s-1 and with a
linewidth of 4.8 km s-1. We measure an intensity of 670 Jy in contrast
to the earlier value of 945 Jy (Caswell et al. 1989), perhaps
reflecting a real decrease in the intensity over the intervening
time. We note that this maser feature falls on the edge of our
bandpass, which may make the flux density measurement unreliable.
of this spectral feature is reported to have become increasingly negative since its discovery in 1989 when it had a velocity of -88 km s-1. This has been interpreted as being due to acceleration of the emitting gas, perhaps in a high velocity outflow (Caswell 2004; Caswell & Phillips 2008). Alternatively, we suggest that the
-102 km s-1 line may be a new maser feature not associated with the component seen at -88 km s-1, which may have been quenched in the intervening time. The
final known site, M9 (G291.284-0.716), exhibits a single intense maser at a velocity of -130 km s-1 and with a
linewidth of 4.8 km s-1. We measure an intensity of 670 Jy in contrast
to the earlier value of 945 Jy (Caswell et al. 1989), perhaps
reflecting a real decrease in the intensity over the intervening
time. We note that this maser feature falls on the edge of our
bandpass, which may make the flux density measurement unreliable.
The six new maser sites reported here (M1, M2, M3, M6, M7 and M8) are
located in the ``arms'' of the filament. As can be seen from
Fig. 5 all sites are within a few arc-seconds of
NH3 emission peaks. With the exception of M8, it is notable
that the spectra of these new masers exhibit, at most, two bright
features. These features have velocities close to the systemic velocity and intensities below 10 Jy. In contrast, the maser spectrum of M8 has four strong peaks spread over ![]() 35 km s-1, the brightest of which has an intensity of 25 Jy. The mid-infrared image of the host SIMBA
clump (S5) also exhibits some nebulous emission, on the south-west edge (see Fig. 1a), while the dense molecular gas tracers (see Sects. 3.1, 3.2 and 3.3) show a ``notch'' in the emission at the same site. We interpret these features as evidence of a deeply embedded
young stellar cluster evacuating an open-ended cavity.
35 km s-1, the brightest of which has an intensity of 25 Jy. The mid-infrared image of the host SIMBA
clump (S5) also exhibits some nebulous emission, on the south-west edge (see Fig. 1a), while the dense molecular gas tracers (see Sects. 3.1, 3.2 and 3.3) show a ``notch'' in the emission at the same site. We interpret these features as evidence of a deeply embedded
young stellar cluster evacuating an open-ended cavity.
5.2 Core masses
Core masses derived from NH3 rely on the assumption of a constant
[NH3] / [H2] abundance ratio, whose value may vary across
the cloud. Independent estimates of the gas + dust-mass in NGC 3576 have been made by André et al. (2008), who mapped the 450 ![]() m thermal
emission using the P-ArTéMiS
m thermal
emission using the P-ArTéMiS![]() bolometer camera on APEX
bolometer camera on APEX![]() . With a beam size of 10
. With a beam size of 10
![]() the 450
the 450 ![]() m map has a comparable resolution to our NH3 (1,1) observations and the morphology of the 450
m map has a comparable resolution to our NH3 (1,1) observations and the morphology of the 450 ![]() m emission corresponds almost exactly to the integrated molecular emission.
m emission corresponds almost exactly to the integrated molecular emission.
Table 6:
Comparison of masses derived from p-ArTéMiS 450 ![]() m and ATCA NH3 (1,1) emission.
m and ATCA NH3 (1,1) emission.
We expanded the analysis of André et al. (2008) by decomposing the 2-D
450 ![]() m emission into cores using FELLWALKER and
deriving their individual masses via the relation:
m emission into cores using FELLWALKER and
deriving their individual masses via the relation:
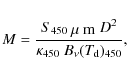
where S450 is the measured flux density,
Eight equivalent cores were detected in the 450 ![]() m P-ArtéMiS and
ATCA NH3 (1,1) integrated intensity maps, whose positions
and masses are presented in Table 6. Mass values
from 450
m P-ArtéMiS and
ATCA NH3 (1,1) integrated intensity maps, whose positions
and masses are presented in Table 6. Mass values
from 450 ![]() m data range from
m data range from ![]() 89
89 ![]() to
to
![]() 712
712 ![]() .
Some 450
.
Some 450 ![]() m cores encompass two or more
NH3 (1,1) cores and in such cases we summed the masses of the
components quoted in Col. 10 of Table 5.
Relative [NH3] / [H2] abundance values
range from 0.4
m cores encompass two or more
NH3 (1,1) cores and in such cases we summed the masses of the
components quoted in Col. 10 of Table 5.
Relative [NH3] / [H2] abundance values
range from 0.4
![]() to
to
![]() and are distinctly different in adjacent
cores. We note that the error on the abundance values is
approximately a factor of 3, including the calibration uncertainty of
the P-ArtéMiS data, assumptions about the dust emissivity and
opacity, dust-to-gas ratio, temperature and relative angular size. The
abundance differences may also be
attributed to environmental factors. Cores S3-a and -b exhibit the lowest
abundance values, but lie adjacent to the H II region. Here they may
be exposed to the ultraviolet-radiation field from the central cluster,
leading to enhanced destruction of large molecules. Core
S4-a, and to a much lesser extent S4-b, have elevated abundances of
NH3. Interestingly, this SIMBA clump also has an enhanced
abundance of N2H+, possibly due to depletion of CO onto the dust
grain surface (see Sect. 5.3, below). In light of
the varying abundance values we have attempted to correct the masses
derived for the cores found in the 3-D NH3 data-cube. Where an equivalent 450
and are distinctly different in adjacent
cores. We note that the error on the abundance values is
approximately a factor of 3, including the calibration uncertainty of
the P-ArtéMiS data, assumptions about the dust emissivity and
opacity, dust-to-gas ratio, temperature and relative angular size. The
abundance differences may also be
attributed to environmental factors. Cores S3-a and -b exhibit the lowest
abundance values, but lie adjacent to the H II region. Here they may
be exposed to the ultraviolet-radiation field from the central cluster,
leading to enhanced destruction of large molecules. Core
S4-a, and to a much lesser extent S4-b, have elevated abundances of
NH3. Interestingly, this SIMBA clump also has an enhanced
abundance of N2H+, possibly due to depletion of CO onto the dust
grain surface (see Sect. 5.3, below). In light of
the varying abundance values we have attempted to correct the masses
derived for the cores found in the 3-D NH3 data-cube. Where an equivalent 450 ![]() m core does not exist we revert to the
canonical value of
m core does not exist we revert to the
canonical value of
![]() (Wang et al. 2008).
These ``corrected'' values are presented in Col. 11 of
Table 5.
(Wang et al. 2008).
These ``corrected'' values are presented in Col. 11 of
Table 5.
![\begin{figure}
\par\includegraphics[angle=-90, width=8.5cm, trim=0 0 -20 0]{figs/11358fg11.ps} .
\end{figure}](/articles/aa/full_html/2009/34/aa11358-08/img104.png) |
Figure 11:
Distributions of
|
| Open with DEXTER | |
Figure 11 compares the corrected LTE and
virial masses for the NH3 cores in
Table 5. The factor
![]() /
/
![]() measures the ratio of gravitational to
kinetic energy. Values less than one indicate that the core may be a
transient structure or confined by an over-pressured external medium,
while a value of
measures the ratio of gravitational to
kinetic energy. Values less than one indicate that the core may be a
transient structure or confined by an over-pressured external medium,
while a value of ![]() suggests that the core is close to
gravitational equilibrium. Cores with
suggests that the core is close to
gravitational equilibrium. Cores with ![]() are likely to be
gravitationally unstable, meaning that internal magnetic fields are
required to counteract the effects of self-gravity. We find that in
all cases
are likely to be
gravitationally unstable, meaning that internal magnetic fields are
required to counteract the effects of self-gravity. We find that in
all cases ![]() (within errors) and seventeen cores
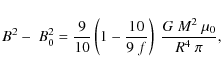
have f-values between three and thirty. The magnetic field strength
necessary to support each core may be calculated after
Bot et al. (2007) via
(within errors) and seventeen cores
have f-values between three and thirty. The magnetic field strength
necessary to support each core may be calculated after
Bot et al. (2007) via
 |
(3) |
where B0 = 0.3 nT is the ambient magnetic field strength in the
Milky Way (Han et al. 2006), R is the core radius in metres and M is
the core mass in kilograms. G and ![]() take their usual values in
SI units. We calculate that field strengths ranging from
take their usual values in
SI units. We calculate that field strengths ranging from ![]() 1 mG
to
1 mG
to ![]() 40 mG, with a median of
40 mG, with a median of ![]() 4 mG, are required to balance
self-gravity in addition to the turbulent pressure. By comparison,
Curran & Chrysostomou (2007) conducted polarimetry measurements of the magnetic
field strengths in fourteen massive star forming regions and found
values from <0.1 mG to
4 mG, are required to balance
self-gravity in addition to the turbulent pressure. By comparison,
Curran & Chrysostomou (2007) conducted polarimetry measurements of the magnetic
field strengths in fourteen massive star forming regions and found
values from <0.1 mG to ![]() 6 mG. Our values are higher on
average, suggesting that some of our NH3 cores may indeed be
collapsing. In Sect. 5.4 below we present evidence
of collapse in the SIMBA clump S4.
6 mG. Our values are higher on
average, suggesting that some of our NH3 cores may indeed be
collapsing. In Sect. 5.4 below we present evidence
of collapse in the SIMBA clump S4.
André et al. (2008) estimated the envelope mass of the dominant
protostellar object in each 450 ![]() m core by scaling
the mass corresponding to the peak flux density to a uniform diameter
of 6000 AU, assuming a density profile
m core by scaling
the mass corresponding to the peak flux density to a uniform diameter
of 6000 AU, assuming a density profile
![]() r-2. The values range from 21 to 45
r-2. The values range from 21 to 45 ![]() .
They also estimated the bolometric
luminosities by fitting the SIMBA, P-ArTéMiS and
MSX
.
They also estimated the bolometric
luminosities by fitting the SIMBA, P-ArTéMiS and
MSX![]() data with a grid of
spectral energy distribution models computed by Robitaille et al. (2006,2007). When plotted on a
data with a grid of
spectral energy distribution models computed by Robitaille et al. (2006,2007). When plotted on a
![]() versus
versus
![]() diagram (see Fig. 4 of André et al. 2008) the objects are
bracketed by evolutionary tracks corresponding to final stellar masses of 15 to 50
diagram (see Fig. 4 of André et al. 2008) the objects are
bracketed by evolutionary tracks corresponding to final stellar masses of 15 to 50 ![]() ,
implying that the cores are undergoing
high-mass star-formation. The relative positions of the cores on the
diagram also indicates their relative evolutionary
ages. Interestingly, the cores furthest from the H II region, at
positions S1-b, S1-c, S4-a, and S5, are significantly less evolved
than the adjacent cores at S3-a and S3-b. This evolutionary
gradient is consistent with the hypothesis that the central
H II region has triggered sequential star-formation in the filament.
,
implying that the cores are undergoing
high-mass star-formation. The relative positions of the cores on the
diagram also indicates their relative evolutionary
ages. Interestingly, the cores furthest from the H II region, at
positions S1-b, S1-c, S4-a, and S5, are significantly less evolved
than the adjacent cores at S3-a and S3-b. This evolutionary
gradient is consistent with the hypothesis that the central
H II region has triggered sequential star-formation in the filament.
![\begin{figure}
\par\includegraphics[width=17cm, trim=0 0 0 0]{figs/11358fg12.eps}
\end{figure}](/articles/aa/full_html/2009/34/aa11358-08/img114.png) |
Figure 12: Maps of the relative abundance of [N2H+] / [CO] ( left) and [N2H+] / [CS] ( right) made from individual column density maps. Greyscale and contours are set at 10 per cent intervals, starting at 30 per cent of peak. The N2H+ abundance is significantly enhanced towards clump S4. This difference is especially pronounced in the [N2H+] / [CO] map but is not as clear when comparing N2H+ and CS. We note that the column density of CS is the least well known of the three species. |
| Open with DEXTER | |
![\begin{figure}
\par\includegraphics[width=11cm,clip]{figs/11358fg13.eps}
\end{figure}](/articles/aa/full_html/2009/34/aa11358-08/img115.png) |
Figure 13:
Position-velocity cuts through the
13CO data-cube. The top-left panel is an integrated
intensity map of 13CO showing the orientations and
positions of the PV-slices presented in panels 1-4.
Centre positions of the slices are marked with black and white
filled circles. Panel 1 shows the azimuthly averaged intensity as a function of velocity and angular offset from position 11 |
| Open with DEXTER | |
5.3 Chemistry
Once the physical conditions of temperature, density and optical-depth have been determined, we can begin to examine the chemistry in NGC 3576. Ratios of column density provide beam-averaged measures of the relative abundances between two species. For key molecules this ratio is tied directly to the physical conditions and hence to the embedded star formation activity.
Figure 12 presents maps of the relative abundance of [N2H+] / [CO] and [N2H+] / [CS] made by taking the ratios of the column density maps. The abundance ratios are beam-averaged and assumes all of the gas is above the critical density for each species. Immediately clump S4 stands out in the [N2H+] / [CO] map, as it has an over-abundance of N2H+ compared to the other SIMBA clumps. The difference is not as pronounced in the [N2H+] / [CS] map, however, we note the optical depth of CS is not known and hence there are significant uncertainties in the column density across the map. A comparison between the N2H+ and HCO+ column densities also reveals the same enhancement in clump S4, which we believe to be a real chemical difference. Because of the low signal-to-noise we do not show this map.
The abundance of N2H+ is predicted to be enhanced in cold
(![]() 10 K) or dense clumps. This is because its parent molecule
N2 is one of the least affected by the condensation process and
N2H+ survives in the gas phase, at least for densities in the
range 105-106 cm-3. In such environments its main
destruction partner CO depletes onto the grains and the abundance of
N2H+ consequently increases (Bergin et al. 2002). Interestingly,
13CO and C18O emission are noticeably absent from clump
S4, providing further confidence in this interpretation. Conditions
such as these are found in starless cores, but particularly in cold
collapsing clumps evolving towards forming stars. Clump S4 has an
average kinetic temperature of
10 K) or dense clumps. This is because its parent molecule
N2 is one of the least affected by the condensation process and
N2H+ survives in the gas phase, at least for densities in the
range 105-106 cm-3. In such environments its main
destruction partner CO depletes onto the grains and the abundance of
N2H+ consequently increases (Bergin et al. 2002). Interestingly,
13CO and C18O emission are noticeably absent from clump
S4, providing further confidence in this interpretation. Conditions
such as these are found in starless cores, but particularly in cold
collapsing clumps evolving towards forming stars. Clump S4 has an
average kinetic temperature of ![]() 25 K according to our analysis
of NH3 data. This seems high for an infrared dark cloud (see
Fig. 1a) undergoing collapse, however, CO
depletion may still occur at these temperatures if the density is high
enough (Aikawa et al. 2001). In the following sub-section we will
examine the evidence for inflowing gas motions in this clump.
25 K according to our analysis
of NH3 data. This seems high for an infrared dark cloud (see
Fig. 1a) undergoing collapse, however, CO
depletion may still occur at these temperatures if the density is high
enough (Aikawa et al. 2001). In the following sub-section we will
examine the evidence for inflowing gas motions in this clump.
5.4 Morphology and kinematics
![\begin{figure}
\par\includegraphics[angle=0,width=14.5cm,clip]{figs/11358fg14.eps}
\end{figure}](/articles/aa/full_html/2009/34/aa11358-08/img118.png) |
Figure 14:
a) Map of the difference between the peak intensities of the F
|
| Open with DEXTER | |
We have examined the molecular emission for evidence of velocity
gradients indicating bulk gas motions, expansion or
contraction. Figure 13 presents position-velocity
(PV) diagrams made using the 13CO Mopra data and annotated on
the inset integrated intensity map. Panel 1 was made using
the kshell tool![]() and shows the azimuthly
averaged intensity as a function of velocity and angular offset from
position 11
and shows the azimuthly
averaged intensity as a function of velocity and angular offset from
position 11![]() 11
11![]() 58.0
58.0![]() -61
-61![]() 18
18![]() 35.0
35.0![]() J2000. The
`C' shaped profile is a classic indicator of an expanding shell of
gas, in this case centred approximately on the H II region. Towards
the centre position (zero offset) the spatial pixels sample
gas moving directly towards and away from the observer, hence the
average spectrum peaks at the systemic velocity
J2000. The
`C' shaped profile is a classic indicator of an expanding shell of
gas, in this case centred approximately on the H II region. Towards
the centre position (zero offset) the spatial pixels sample
gas moving directly towards and away from the observer, hence the
average spectrum peaks at the systemic velocity ![]() the shell
expansion velocity. At offsets approaching the shell radius the pixels sample gas moving perpendicular to the observer, hence the emission peaks at the systemic velocity (-24 km s-1). The clumpy shell seen here
in 13CO is approximately 1 arcminute in diameter and
encompasses the free-free emission from the H II region. We see
exactly the same C-shape in C18O, although the plot is
noisier.
the shell
expansion velocity. At offsets approaching the shell radius the pixels sample gas moving perpendicular to the observer, hence the emission peaks at the systemic velocity (-24 km s-1). The clumpy shell seen here
in 13CO is approximately 1 arcminute in diameter and
encompasses the free-free emission from the H II region. We see
exactly the same C-shape in C18O, although the plot is
noisier.
Panels 2-4 present the PV-slices indicated on the inset
13CO moment map (top-left). The first cut, (centred at 11![]() 11
11![]() 09.90
09.90![]() ,
-61
,
-61![]() 15
15![]() 45.6
45.6![]() J2000 and at a position angle
J2000 and at a position angle
![]()
![]() )
is a longitudinal slice through the eastern arm of the filament and
reveals a forked cross-section: two tenuous tentacles of emission
merge into the eastern-most SIMBA clump (S1). PV-slices through the
dense gas tracers (NH3 and CS) show the same structure, meaning
that this morphology is not due to optical depth or chemical
effects. Ionised gas from the H II region overlays this part of the
eastern arm, likely inter-penetrating the molecular emission. Combined
with the existence of an expanding shell and a temperature gradient, we
conclude that the H II region is expanding eastwards, and has played a
significant role in sculpting these features.
)
is a longitudinal slice through the eastern arm of the filament and
reveals a forked cross-section: two tenuous tentacles of emission
merge into the eastern-most SIMBA clump (S1). PV-slices through the
dense gas tracers (NH3 and CS) show the same structure, meaning
that this morphology is not due to optical depth or chemical
effects. Ionised gas from the H II region overlays this part of the
eastern arm, likely inter-penetrating the molecular emission. Combined
with the existence of an expanding shell and a temperature gradient, we
conclude that the H II region is expanding eastwards, and has played a
significant role in sculpting these features.
The second cut (11![]() 11
11![]() 48.60
48.60![]() ,
-61
,
-61![]() 20
20![]() 57.6
57.6![]() J2000,
J2000,
![]()
![]() )
follows the line of emission evident in
Fig. 13 at -20 km s-1. It is clear from the
PV-diagram that two velocity components exist, separated by
)
follows the line of emission evident in
Fig. 13 at -20 km s-1. It is clear from the
PV-diagram that two velocity components exist, separated by
![]() 4 km s-1. Both appear to merge into the strong emission
immediately west of the H II region. These two velocity features are
clearly visible in the third cut (11
4 km s-1. Both appear to merge into the strong emission
immediately west of the H II region. These two velocity features are
clearly visible in the third cut (11![]() 11
11![]() 39.50
39.50![]() ,
-61
,
-61![]() 21
21![]() 46.9
46.9![]() J2000,
J2000,
![]() = 268
= 268![]() ), which presents the velocity structure of the
western arm in cross-section. The bulk of the emission in this arm
derives from the component at -24 km s-1, while the component at
-20 km s-1 is not seen in the dense gas tracers NH3, N2H+ or
CS. Considering the dense gas only, we see the peak V
), which presents the velocity structure of the
western arm in cross-section. The bulk of the emission in this arm
derives from the component at -24 km s-1, while the component at
-20 km s-1 is not seen in the dense gas tracers NH3, N2H+ or
CS. Considering the dense gas only, we see the peak V
![]() of
the filament is approximately constant between -24 to
-25 km s-1 over its length. No large opposing velocity gradients or
discontinuities are evident and small variations may be explained by
optical depth effects or motions on small scales
(<30
of
the filament is approximately constant between -24 to
-25 km s-1 over its length. No large opposing velocity gradients or
discontinuities are evident and small variations may be explained by
optical depth effects or motions on small scales
(<30
![]() ). We see no evidence for large scale flows of
gas, at least in the 40
). We see no evidence for large scale flows of
gas, at least in the 40
![]() resolution Mopra data, and conclude that the
majority of the emission derives from the same cloud and is not merely
a projection or line-of-sight effect. The velocity structure in the
11
resolution Mopra data, and conclude that the
majority of the emission derives from the same cloud and is not merely
a projection or line-of-sight effect. The velocity structure in the
11
![]() resolution NH3 data is complex within the bounds of
each SIMBA clump and will be analysed in detail in a separate paper.
resolution NH3 data is complex within the bounds of
each SIMBA clump and will be analysed in detail in a separate paper.
We are interested in probing for bulk gas motions in clump S4, where we
find an over-abundance of N2H+, common in collapsing
clumps. Asymmetric spectra towards
star forming regions are often interpreted as indicators of inward or
outward motions. In the case of NH3 (1,1) asymmetries may be
produced by a combination of non-LTE effects and bulk
motions. Park (2001) has modelled NH3 (1,1) spectra over a
wide range of physical conditions, predicting that asymmetries
between the inner satellite lines indicates inward or outward
flows of gas. On the other hand, asymmetries between the outer
satellites are indicative of selective radiative trapping and non-LTE
excitation (Stutzki & Winnewisser 1985). The amount by which both effects skew
the profiles increases with optical depth. Figure 14a
presents a map showing the difference between the blue minus red peak
intensities of the inner satellite NH3(1,1) lines, for
SIMBA clump S4. Only pixels with absolute differences greater than 0.2 K (![]() 3-
3-![]() above the spectral noise) have been
plotted. Asymmetries on the order of
above the spectral noise) have been
plotted. Asymmetries on the order of ![]() 10 percent are observed
over distinct regions within the SIMBA clump. We note that there are
few pixels with significant red-skewed spectra (values less than
-0.2 K in Fig. 14a) and the map is dominated by
regions of blue-skewed spectra which cover angular areas greater than
the beam. Sample spectra from the three largest regions are presented
in Fig. 14b. The optical depth of NH3 (1,1)
in this clump ranges between
10 percent are observed
over distinct regions within the SIMBA clump. We note that there are
few pixels with significant red-skewed spectra (values less than
-0.2 K in Fig. 14a) and the map is dominated by
regions of blue-skewed spectra which cover angular areas greater than
the beam. Sample spectra from the three largest regions are presented
in Fig. 14b. The optical depth of NH3 (1,1)
in this clump ranges between
![]() and we do not expect large asymmetries under these conditions, hence, we believe the differences are significant and tentatively imply inward gas motions.
and we do not expect large asymmetries under these conditions, hence, we believe the differences are significant and tentatively imply inward gas motions.
5.5 H II region - cloud interaction
It is clear from the temperature map presented in
Fig. 8 that the central star-forming complex is
heating the gas in its immediate surroundings. The heating is gradual
on the western side of the filament and the temperature decreases
linearly towards the extremes.
The gradient in temperature strongly suggests that the
H II region is embedded within the filament and is not
merely a line of sight projection. The temperature fluctuates between
![]() 15 and
15 and ![]() 30 K in the S2 clump, immediately east of the
H II region's peak. Diffuse free-free emission is observed to extend
into this region and the molecular gas has a clumpy distribution and
is less evenly heated. It is interesting to note that there is a weak
linewidth gradient in the western arm also, as plotted in
Fig. 8c. This may reflect the turbulent
energy injected into the cloud via shocks driven by the expanding
ionised gas in the H II region. Clear evidence for this continuing
expansion is seen in the 13CO data as an expanding shell of
molecular gas surrounding the free-free emission.
30 K in the S2 clump, immediately east of the
H II region's peak. Diffuse free-free emission is observed to extend
into this region and the molecular gas has a clumpy distribution and
is less evenly heated. It is interesting to note that there is a weak
linewidth gradient in the western arm also, as plotted in
Fig. 8c. This may reflect the turbulent
energy injected into the cloud via shocks driven by the expanding
ionised gas in the H II region. Clear evidence for this continuing
expansion is seen in the 13CO data as an expanding shell of
molecular gas surrounding the free-free emission.
5.6 Infrared excess stars
Previous studies have focused on the infrared properties
of embedded stars in NGC 3576. Emission in the K (2.2 ![]() m) and L (3.6
m) and L (3.6 ![]() m) bands, which cannot be accounted for by interstellar
reddening, has been interpreted as the signature of thermal emission
from a dusty disk. Maercker et al. (2006) imaged the region in J(1.3
m) bands, which cannot be accounted for by interstellar
reddening, has been interpreted as the signature of thermal emission
from a dusty disk. Maercker et al. (2006) imaged the region in J(1.3 ![]() m), H (1.7
m), H (1.7 ![]() m), K and L, and found 113 stars with
infrared excess. Their distribution is plotted in Fig. 15 over the 13CO (1-0) integrated
intensity map. Foreground stars have been filtered from the list. A
dense cluster of IR-excess stars is centred on the Giant HII region,
as reported in work by Persi et al. (1994) using Las Campanas
Observatory. It is clear that the distribution of IR-excess stars is
anti-correlated with the molecular gas in the dense arms of the
filament. The high extinction in this area likely makes it impossible
to detect even bright IR-excess sources behind or embedded in the
filament. This suggests that the clumps are not associated with
star-formation at an advanced stage of development. If
young stars are present in the filament, they are probably at such a
young age that they are still deeply embedded and not yet visible in
the near-infrared.
m), K and L, and found 113 stars with
infrared excess. Their distribution is plotted in Fig. 15 over the 13CO (1-0) integrated
intensity map. Foreground stars have been filtered from the list. A
dense cluster of IR-excess stars is centred on the Giant HII region,
as reported in work by Persi et al. (1994) using Las Campanas
Observatory. It is clear that the distribution of IR-excess stars is
anti-correlated with the molecular gas in the dense arms of the
filament. The high extinction in this area likely makes it impossible
to detect even bright IR-excess sources behind or embedded in the
filament. This suggests that the clumps are not associated with
star-formation at an advanced stage of development. If
young stars are present in the filament, they are probably at such a
young age that they are still deeply embedded and not yet visible in
the near-infrared.
5.7 Triggered star formation in NGC 3576?
![\begin{figure}
\par\includegraphics[angle=-90, width=8.5cm,clip]{figs/11358fg15.ps} \end{figure}](/articles/aa/full_html/2009/34/aa11358-08/img126.png) |
Figure 15: The distribution of stars with infrared excess determined by Maercker et al. (2006), plotted over the molecular gas traced by 13CO (1-0) emission. |
| Open with DEXTER | |
Our observations provide an interesting glimpse into star formation activity within NGC 3576. It is clear that the H II region is embedded within the dusty filament and is exerting a powerful influence on its immediate surroundings. We have investigated whether the H II region expansion into the ambient molecular cloud is consistent with triggering the formation of high-mass stars along the dusty filament.
By comparing the morphology of the H II region (traced by the 23 GHz
continuum emission) to the dense molecular gas (traced by NH3, CS
and N2H+) and thermal dust emission (traced by 1.2-mm and
450 ![]() m continuum), we see that the young star cluster at the heart
of the complex has destroyed or dispersed much of the gas in the
central clump. There is also clear evidence for an expanding shell in
the 13CO and C18O data, centred on the H II region.
m continuum), we see that the young star cluster at the heart
of the complex has destroyed or dispersed much of the gas in the
central clump. There is also clear evidence for an expanding shell in
the 13CO and C18O data, centred on the H II region.
To the east of the H II region, molecular gas is sparse and does not follow the morphology of the dust, while at 3.4-cm wavelengths the ionised gas is observed to extend throughout most of field S2 (see Fig. 1c). In contrast, the western edge of the free-free continuum emission is observed to have a well defined boundary. We find from our molecular-line observations that this edge coincides with a dense molecular clump, implying that the H II region is pressure-confined on this side. At the same time, the H II region appears to be heating the arms of the filament and the western arm exhibits a clear temperature gradient, peaking adjacent to the H II region. In the eastern arm, the clumpy nature of the gas gives rise to ``hot spots'' with higher temperatures, consistent with our ``dispersal'' interpretation. The gradients in temperature strongly suggest that the H II region is embedded within the filament. Some of the structures visible in the eastern arm are reminiscent of the ``elephant's trunks'' pillars in the Eagle Nebula (White et al. 1999).
![\begin{figure}
\par\includegraphics[angle=0, width=18.0cm, trim=0 0 0 0]{figs/11358fg16.eps}
\end{figure}](/articles/aa/full_html/2009/34/aa11358-08/img127.png) |
Figure 16:
Schematic of the environment of
NGC 3576 ( right panel). 13CO integrated intensity
contours tracing the extended molecular cloud, overlaid on a
H- |
| Open with DEXTER | |
Besides the heating evidence, there is also evidence for kinematical interaction
between the H II region and the ambient molecular cloud. We
do see evidence that the H II region is expanding
into the eastern arm, sweeping up a clumpy shell of gas. Such an expansion is expected in the collect and collapse scenario for triggered star formation (see Sect. 1).
Multiple velocity components have been identified within the arms
of the filament (see Fig. 13). Velocity gradients
and dislocations may be the archaeological remains of cloud-cloud
collisions or quickly collapsing elongated clumps
(c.f. Peretto et al. 2006). However, when considering only the
dense gas we see that the velocity structure of the gas is smooth,
confined to a narrow range and does not support either
interpretation, at least at the 40
![]() scale of the Mopra data.
scale of the Mopra data.
Different diagnostics have been employed to identify signatures of early phases of star formation in the
filaments and gas clumps. Water masers have always been associated with star formation (see
Beuther et al. 2002 for a summary). That we
detect water-maser emission towards the arms of the filament confirms
the presence of shocks and hence that stars are forming within the
molecular gas. However, unlike 6.67 GHz CH3OH masers, 22 GHz
water masers are not a clear confirmation of high-mass star formation as they are also found towards sites where intermediate mass (4-8 ![]() )
stars are forming. Water masers are thought to originate in the shocked gas
associated with outflows and are collisionally pumped (e.g.,
Kylafis & Pavlakis 1992).
Core masses derived from NH3 range from
5
)
stars are forming. Water masers are thought to originate in the shocked gas
associated with outflows and are collisionally pumped (e.g.,
Kylafis & Pavlakis 1992).
Core masses derived from NH3 range from
5 ![]() to
to ![]() 516
516 ![]() ,
with a median value of
,
with a median value of ![]() 45
45 ![]() .
Seven cores have masses greater than 100
.
Seven cores have masses greater than 100 ![]() and
for a typical star formation efficiency of 0.3
(c.f. Lada & Lada 2003) are likely to form stars with masses
greater than 8
and
for a typical star formation efficiency of 0.3
(c.f. Lada & Lada 2003) are likely to form stars with masses
greater than 8 ![]() .
.
We have confirmed that protostellar objects are likely forming in the arms of
the filament and that the H II region is clearly influencing the
conditions in the bulk of the cloud, as evidenced by the temperature
gradients and gas-morphology. Whether the formation of the new stars
is triggered by the expansion of the H II region is difficult to prove
categorically, but to be consistent requires evidence of an ``age
gradient'', as argued by Persi et al. (1994). Recent
450-![]() m continuum observations (André et al. 2008) partially
resolved the 1.2-mm continuum SIMBA clumps and detected continuum
emission counterparts to the NH3 cores. Based on a ``protostellar mass envelope vs. bolometric luminosity diagram'' (hereafter
m continuum observations (André et al. 2008) partially
resolved the 1.2-mm continuum SIMBA clumps and detected continuum
emission counterparts to the NH3 cores. Based on a ``protostellar mass envelope vs. bolometric luminosity diagram'' (hereafter
![]() -
-
![]() diagram),
André et al. (2008) estimated the evolutionary stage of these candidate
massive protostars and positioned them on evolutionary tracks for
high mass star formation. Interestingly, S3-a and S3-b, the
closest candidate protostars to the H II region, appear to be the most evolved objects on the
diagram),
André et al. (2008) estimated the evolutionary stage of these candidate
massive protostars and positioned them on evolutionary tracks for
high mass star formation. Interestingly, S3-a and S3-b, the
closest candidate protostars to the H II region, appear to be the most evolved objects on the
![]() -
-
![]() diagram. In contrast, the
other candidate protostars, those in the arms, appear to be less
evolved on the diagram and are possibly class 0-type
protostars. The non detection of ionised gas toward these protostars
confirms their very early evolutionary stage.
All detected protostars will evolve into stars of masses between
15 and 50
diagram. In contrast, the
other candidate protostars, those in the arms, appear to be less
evolved on the diagram and are possibly class 0-type
protostars. The non detection of ionised gas toward these protostars
confirms their very early evolutionary stage.
All detected protostars will evolve into stars of masses between
15 and 50 ![]() according to the evolutionary tracks on the
according to the evolutionary tracks on the
![]() -
-
![]() diagram.
diagram.
Another signature of early phases of star formation is the evidence for collapsing
cores. On examination of the relative molecular abundances, SIMBA clump S4 stands out as having an over-abundance of N2H+ and an
under-abundance of CO. Such a chemical signature is typical of dense
and cold regions, which is often found towards collapsing cores. We
searched for signatures of inflowing motions in the NH3 line
profiles. Asymmetries on the order of ![]() 10 per cent are observed between the inner satellites for discrete regions in clump S4.
10 per cent are observed between the inner satellites for discrete regions in clump S4.
High-mass star formation is clearly underway in the dusty arms of the NGC 3576 filament. Evidence for interaction through temperature gradients as well as an evolutionary sequence for the embedded protostars from the H II region to the arms, is consistent with the hypothesis that the H II region is triggering star formation in NGC 3576. The geometry of the H II region and associated clumps does not resemble the typical collect and collapse scenario, hence the observations are also in agreement with spontaneous star formation, at least in the clumps further away from the ionisation front. However, it is also possible that the H II region is responsible for initiating star formation in these clumps via shock driven globule squeezing. Further investigation is necessary to distinguish between these two cases.
6 Summary and conclusions
We have mapped the molecular environment of the giant H II region NGC 3576 in lines of NH3, CO, HCO+, CS and N2H+. In addition, we have
searched for UCH II regions via 23 GHz free-free emission and
for 22 GHz water masers. Figure 16 summarises our
observational results as a schematic, overlaid on an amateur
H-![]() image (Schedler, 2009) which illustrates the large
scale structure of the ISM in the region. Our main conclusions are as
follows:
image (Schedler, 2009) which illustrates the large
scale structure of the ISM in the region. Our main conclusions are as
follows:
- 1.
- We have detected molecular emission from all clumps identified in the 1.2-mm SIMBA map (Hill et al. 2005). Dense gas tracers (NH3, N2H+ and CS) follow the morphology of the thermal dust emission, except within the H II region, where the 1.2-mm emission is highly contaminated by free-free continuum emission. Molecules with low and intermediate critical densities or with high abundances (CO, HCO+) trace the extended envelope well.
- 2.
- We searched for UCH II regions in the arms of the filament via their 23 GHz emission, but found none down to a detection limit of 0.5 mJy/beam. The central H II region was mapped and exhibited a similar morphology to the earlier 3.4-cm image by de Pree et al. (1999).
- 3.
- Six new sites of 22 GHz water maser emission were detected, all of which lie adjacent to discrete NH3 cores in the arms of the filament. Most of the new masers have flux densities less than ten Janskys, compared to the three known sites in the H II region, which have flux densities between 40-640 Jy. Of all the new masers, the site in clump S5 has the greatest range of velocities and warrants further investigation.
- 4.
- NH3 (1,1) and (2,2) were used to derive the kinetic
temperature of the dense gas. We find a temperature gradient exists
in the western arm, with temperatures ranging from
 11 K at
the extremes to
11 K at
the extremes to  30 K adjacent to the H II region. Clearly, the
H II region is responsible for the heating.
30 K adjacent to the H II region. Clearly, the
H II region is responsible for the heating.
- 5.
- There is clear evidence in 13CO and
C18O for an expanding swept-up shell of diameter
1
 completely encompassing the H II region.
- 6.
- The 11
 resolution NH3 (1,1) emission
was decomposed into twenty-five individual cores, ranging in mass
from 5
resolution NH3 (1,1) emission
was decomposed into twenty-five individual cores, ranging in mass
from 5  to 516 ,
when scaled to the 2-D clump masses
derived from the 450
to 516 ,
when scaled to the 2-D clump masses
derived from the 450  m P-ArTéMiS map.
- 7.
-
 /
/
 for all
NH3 cores, implying they are at least
gravitationally bound. Seveneen cores have
/
for all
NH3 cores, implying they are at least
gravitationally bound. Seveneen cores have
/
 and to avoid
collapsing under self-gravity require support from internal magnetic fields with strengths between 1 mG and
40 mG. These values are on average higher than measured in
recent observations of massive star-formation regions and suggest
that some of the cores may be collapsing.
and to avoid
collapsing under self-gravity require support from internal magnetic fields with strengths between 1 mG and
40 mG. These values are on average higher than measured in
recent observations of massive star-formation regions and suggest
that some of the cores may be collapsing.
- 8.
- Clump S4 in Fig. 1 is over-abundant in N2H+ and shows evidence for depletion of CO, consistent with the expected chemistry in a cold, dense clump. We examined our NH3 data for line-profile asymmetries indicating bulk gas motions and found distinct regions with blue profiles, tentatively indicating inflowing gas.
- 9.
- The filament displays a complex velocity structure, with two
main components in each arm seen in the 13CO data. Molecules
tracing high density gas show that a single component at
 km s-1 dominates the cloud.
- 10.
- The positions of stars with infrared-excess, indicative of circumstellar disks, are anti-correlated with the dense molecular gas, implying star formation has not yet advanced far enough to be visible in the near-infrared. Alternatively, there is likely sufficient extinction to hide such stars embedded within the molecular cloud.
Acknowledgements
The Mopra radio telescope is part of the Australia Telescope which is funded by the Commonwealth of Australia for operations as a National Facility managed by CSIRO. During 2002-2005 the Mopra telescope was operated through a collaborative arrangement between the University of New South Wales and the CSIRO.We wish to thank the Australian research council and UNSW for grant support. C.R.P. was supported by a School of Physics Scholarship during the course of his PhD.
V. Minier and F. Herpin acknowledge the use of a French-Australian Science & Technology (FAST) Program grant. The FAST program is jointly managed by the Department of Innovation, Industry, Science & Research and its French counterparts, the Ministry of Higher Education and Research and the Ministry of Foreign and European Affairs.
P.A.J. acknowledges partial support from Centro de Astrofísica FONDAP 15010003 and the GEMINI-CONICYT FUND.
Many thanks also to Johannes Schedler, who kindly provided his H-
image of NGC 3576.
We are also grateful to the anonymous referee for very thorough comments and discussions that helped improve the presentation.
Table 7:
Molecular constants ![]() .
.
Appendix A: Physical properties from molecular lines
This work makes heavy use of standard methods to derive physical properties from molecular line data. Here we summarise the methodology used and gather the equations and constants in one place. All calculations were performed in SI units.
A.1 Kinetic temperature from NH3
Firstly, we calculate the optical depth of the NH3 (1,1) transition via a comparison of brightness temperature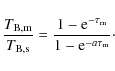 |
(A.1) |
The subscripts ``m'' and ``s'' indicate the main and satellite groups, respectively, and ``a'' is the theoretical
![\begin{displaymath}{\tau_{~2,2} = -\frac{1}{f_{2,2}}\ln\left[1-\frac{T_{B_{2,2}~...
...\left(1-{\rm e}^{-\tau_{1,1}^{\rm tot}f_{1,1}}\right)\right],}
\end{displaymath}](/articles/aa/full_html/2009/34/aa11358-08/img163.png) |
(A.2) |
where f1,1 = 0.502 and f2,2 = 0.796 are the fractional intensities in the (1,1) and (2,2) main groups, respectively, compared to their satellites. The rotational temperature is found from the optical depth ratio
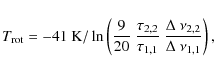 |
(A.3) |
where
![\begin{displaymath}
T_{\rm rot} = \frac{T_{\rm kin}}{[1+(T_{\rm kin}/41~K)\ln(1+C_{23}/C_{21})]}\cdot
\end{displaymath}](/articles/aa/full_html/2009/34/aa11358-08/img168.png)
Danby et al. (1988) have used large velocity gradient (LVG) models to calculate the collisional coefficients C23 and C21, for kinetic temperatures ranging from 5-300 K. To derive Eq. (A.4) we assume that only the J,K = (1,1), (2,1) and (2,2) transitions are involved. At low temperatures this assumption is valid, however, above
A.2 Column density and core mass
If the optical depth and excitation temperature in any
(J,K) transition are known, the total column density of
emitting molecules may be calculated assuming local thermal
equilibrium (LTE) via the equation
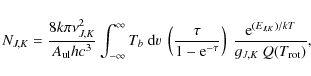
where
| Q(T) = 0.1266 T1.48. | (A.6) |
A.3 CO and HCO+
Physical conditions were calculated on a pixel-by-pixel basis in the
Mopra data. Using the regrid task in MIRIAD, the
CO data-cubes were first resampled to the same pixel-scale in RA, Dec
and velocity. The maths task was used to perform all subsequent
calculations. For each spatial pixel we calculated the optical depth
as a function of frequency using a modified version of the isotope
ratio (Bourke et al. 1997):
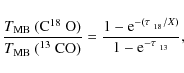 |
(A.7) |
In the above equation,
![\begin{displaymath}T_{\rm ex} = \frac{h\nu_u}{k}~\left[ln~\left(1+\frac{(h\nu_u/k)}{T_{13}/C_{\tau}+J_{\nu}(T_{bg})}\right)\right]^{-1},
\end{displaymath}](/articles/aa/full_html/2009/34/aa11358-08/img175.png) |
(A.8) |
where
| (A.9) |
The CO column density map is presented in Fig. 10a.
We calculated the column-density of HCO+ using the same procedure,
and a partition function of the form:
| (A.10) |
The [HCO+] / [H13CO+] was set to 40 for these calculations.
A.4 N H
H and CS
A slightly different approach was taken for the N2H+ data.
In a similar manner to NH3, the hyperfine structure in the spectrum of N2H+ (1-0) allows the direct determination of optical depth. We fit all spectra in the N2H+ data-cube using the HFS method in CLASS and
found that the N2H+ emission was
consistent with it being optically thin (
![]() )
over the entire cloud. Hence, no independent estimate could be made of the excitation temperature. N2H+ and NH3 have similar critical densities and, being nitrogen bearing molecules, are often detected under similar
conditions. We calculated the column
density of N2H+ assuming excitation temperatures equal to the
NH3 rotational temperatures. In practise, we smoothed the
)
over the entire cloud. Hence, no independent estimate could be made of the excitation temperature. N2H+ and NH3 have similar critical densities and, being nitrogen bearing molecules, are often detected under similar
conditions. We calculated the column
density of N2H+ assuming excitation temperatures equal to the
NH3 rotational temperatures. In practise, we smoothed the
![]() (NH3) map to the same resolution as the Mopra
N2H+ data. We then produced a column density map by combining this
(NH3) map to the same resolution as the Mopra
N2H+ data. We then produced a column density map by combining this
![]() map with the N2H+ integrated map via
Eq. (A.5) in the limit that
map with the N2H+ integrated map via
Eq. (A.5) in the limit that
![]() .
The partition function for N2H+ was again interpolated from the values in the Pickett, et al. (1998) catalogue:
.
The partition function for N2H+ was again interpolated from the values in the Pickett, et al. (1998) catalogue:
| (A.11) |
A column density map of CS was prepared in a similar manner, although we note that our assumption of optically thin emission may not be valid. Judging by the non-Gaussian shapes of some line profiles, regions with strong emission may have significant optical depths.
References
- Aikawa, Y., Ohashi, N., Inutsuka, S.-I., Herbst, E., & Takakuwa, S. 2001, ApJ, 552, 639 [NASA ADS] [CrossRef] (In the text)
- Allen, C. W. 1973, Astrophysical quantities (London: University of London, Athlone Press, |c1973, 3rd ed.) (In the text)
- Allen, L. E., Burton, M. G., Ryder, S. D., Ashley, M. C. B., & Storey, J. W. V. 1999, MNRAS, 304, 98 [NASA ADS] [CrossRef]
- André, P., Minier, V., Gallais, P., et al. 2008, A&A, 490, L27 [NASA ADS] [CrossRef] [EDP Sciences] (In the text)
- Barbosa, C. L., Damineli, A., Blum, R. D., et al. 2003, AJ, 126, 2411 [NASA ADS] [CrossRef] (In the text)
- Bergin, E. A., Alves, J., Huard, T., et al. 2002, ApJ, 570, L101 [NASA ADS] [CrossRef] (In the text)
- Beuther, H., Walsh, A., Schilke, P., et al. 2002, A&A, 390, 289 [NASA ADS] [CrossRef] [EDP Sciences] (In the text)
- Bot, C., Boulanger, F., Rubio, M., et al. 2007, A&A, 471, 103 [NASA ADS] [CrossRef] [EDP Sciences] (In the text)
- Bourke, T. L., Hyland, A. R., Robinson, G., James, S. D., & Wright, C. M. 1995, MNRAS, 276, 1067 [NASA ADS]
- Bourke, T. L., Garay, G., Lehtinen, K. K., et al. 1997, ApJ, 476, 781 [NASA ADS] [CrossRef] (In the text)
- Caselli, P., Myers, P. C., & Thaddeus, P. 1995, ApJ, 455, L77 [NASA ADS] [CrossRef] (In the text)
- Caswell, J. L. 2004, MNRAS, 351, 279 [NASA ADS] [CrossRef] (In the text)
- Caswell, J. L., Batchelor, R. A., Forster, J. R., et al. 1989, Austr. J. Phys., 42, 331 [NASA ADS] (In the text)
- Caswell, J. L., & Phillips, C. J. 2008, MNRAS, 386, 1521 [NASA ADS] [CrossRef]
- Cesaroni, R., Walmsley, C. M., & Churchwell, E. 1992, A&A, 256, 618 [NASA ADS]
- Cheung, L. H., Frogel, J. A., Hauser, M. G., et al. 1980, ApJ, 240, 74 [NASA ADS] [CrossRef] (In the text)
- Curran, R. L., & Chrysostomou, A. 2007, MNRAS, 382, 699 [NASA ADS] [CrossRef] (In the text)
- Danby, G., Flower, D. R., Valiron, P., Schilke, P., & Walmsley, C. M. 1988, MNRAS, 235, 229 [NASA ADS] (In the text)
- de Pree, C. G., Nysewander, M. C., & Goss, W. M. 1999, AJ, 117, 2902 [NASA ADS] [CrossRef] (In the text)
- Deharveng, L., Lefloch, B., Kurtz, S., et al. 2008, A&A, 482, 585 [NASA ADS] [CrossRef] [EDP Sciences] (In the text)
- Deharveng, L., Zavagno, A., Schuller, F., et al. 2009, A&A, 496, 177 [NASA ADS] [CrossRef] [EDP Sciences] (In the text)
- Elmegreen, B. G. 1998, in ASP Conf. Ser. 148: Origins, ed. C. E. Woodward, J. M. Shull, & H. A. Thronson, Jr., 150 (In the text)
- Evans, II, N. J. 1999, ARA&A, 37, 311 [NASA ADS] [CrossRef] (In the text)
- Frogel, J. A., & Persson, S. E. 1974, ApJ, 192, 351 [NASA ADS] [CrossRef] (In the text)
- Genzel, R. 1991, in NATO ASIC Proc. 342: The Physics of Star Formation and Early Stellar Evolution, ed. C. J. Lada, & N. D. Kylafis, 155 (In the text)
- Goldsmith, P. F., Bergin, E. A., & Lis, D. C. 1997, ApJ, 491, 615 [NASA ADS] [CrossRef] (In the text)
- Greenhill, L. J., Booth, R. S., Ellingsen, S. P., et al. 2003, ApJ, 590, 162 [NASA ADS] [CrossRef] (In the text)
- Han, J. L., Manchester, R. N., Lyne, A. G., Qiao, G. J., & van Straten, W. 2006, ApJ, 642, 868 [NASA ADS] [CrossRef] (In the text)
- Hanson, M. M., & Conti, P. S. 1993, Bull. Amer. Astron. Soc., 25, 1456 [NASA ADS] (In the text)
- Henning, T., Begemann, B., Mutschke, H., et al. 1995, A&AS, 112, 143 [NASA ADS] (In the text)
- Hill, T., Burton, M. G., Thompson, M. A., et al. 2005, MNRAS, 363, 405 [NASA ADS] (In the text)
- Hjellming, R. M. 1966, ApJ, 143, 420 [NASA ADS] [CrossRef] (In the text)
- Ho, P. T. P., & Townes, C. H. 1983, ARA&A, 21, 239 [NASA ADS] [CrossRef] (In the text)
- Ho, P. T. P., Martin, R. N., Myers, P. C., & Barrett, A. H. 1977, ApJ, 215, L29 [NASA ADS] [CrossRef] (In the text)
- Hollenbach, D. J., & Tielens, A. G. G. M. 1999, Rev. Mod. Phys., 71, 173 [NASA ADS] [CrossRef] (In the text)
- Karr, J. L., & Martin, P. G. 2003, ApJ, 595, 900 [NASA ADS] [CrossRef] (In the text)
- Kutner, M. L., & Ulich, B. L. 1981, ApJ, 250, 341 [NASA ADS] [CrossRef] (In the text)
- Kylafis, N. D., & Pavlakis, K. G. 1992, ApJ, 400, 344 [NASA ADS] [CrossRef] (In the text)
- Lada, C. J., & Lada, E. A. 2003, ARA&A, 41, 57 [NASA ADS] [CrossRef] (In the text)
- Ladd, E. F., Purcell, C. R., Wong, T., et al. 2005, PASA, 22, 62 [NASA ADS] (In the text)
- Langer, W. D., & Penzias, A. A. 1990, ApJ, 357, 477 [NASA ADS] [CrossRef] (In the text)
- MacLaren, I., Richardson, K. M., & Wolfendale, A. W. 1988, ApJ, 333, 821 [NASA ADS] [CrossRef] (In the text)
- Maercker, M., Burton, M. G., & Wright, C. M. 2006, A&A, 450, 253 [NASA ADS] [CrossRef] [EDP Sciences] (In the text)
- Moneti, A. 1992, A&A, 259, 627 [NASA ADS] (In the text)
- Moorwood, A. F. M., & Salinari, P. 1981, A&A, 102, 197 [NASA ADS] (In the text)
- Motte, F., Andre, P., & Neri, R. 1998, A&A, 336, 150 [NASA ADS] (In the text)
- Norris, R. P., Whiteoak, J. B., Caswell, J. L., Wieringa, M. H., & Gough, R. G. 1993, ApJ, 412, 222 [NASA ADS] [CrossRef] (In the text)
- Oliva, E., & Moorwood, A. F. M. 1986, A&A, 164, 104 [NASA ADS] (In the text)
- Park, Y.-S. 2001, A&A, 376, 348 [NASA ADS] [CrossRef] [EDP Sciences] (In the text)
- Peretto, N., André, P., & Belloche, A. 2006, A&A, 445, 979 [NASA ADS] [CrossRef] [EDP Sciences] (In the text)
- Persi, P., Roth, M., Tapia, M., Ferrari-Toniolo, M., & Marenzi, A. R. 1994, A&A, 282, 474 [NASA ADS] (In the text)
- Pickett, H. M., Poynter, R. L., Cohen, E. A., et al. 1998, J. Quant. Spec. Radiat. Transf., 60, 883 [NASA ADS] [CrossRef] (In the text)
- Pillai, T., Wyrowski, F., Carey, S. J., et al. 2006, A&A, 450, 569 [NASA ADS] [CrossRef] [EDP Sciences] (In the text)
- Pirogov, L., Zinchenko, I., Caselli, P., Johansson, L. E. B., & Myers, P. C. 2003, A&A, 405, 639 [NASA ADS] [CrossRef] [EDP Sciences] (In the text)
- Pirogov, L., Zinchenko, I., Caselli, P., et al. 2007, A&A, 461, 523 [NASA ADS] [CrossRef] [EDP Sciences] (In the text)
- Rathborne, J. M., Jackson, J. M., & Simon, R. 2006, ApJ, 641, 389 [NASA ADS] [CrossRef] (In the text)
- Rawlings, J. M. C., Redman, M. P., Keto, E., et al. 2004, MNRAS, 351, 1054 [NASA ADS] [CrossRef] (In the text)
- Robitaille, T. P., Whitney, B. A., Indebetouw, R., Wood, K., & Denzmore, P. 2006, ApJS, 167, 256 [NASA ADS] [CrossRef]
- Robitaille, T. P., Whitney, B. A., Indebetouw, R., et al. 2007, ApJS, 169, 328 [NASA ADS] [CrossRef]
- Rydbeck, O. E. H., Sume, A., Hjalmarson, A., et al. 1977, ApJ, 215, L35 [NASA ADS] [CrossRef] (In the text)
- Sault, R. J., Teuben, P. J., & Wright, M. C. H. 1995, in Astronomical Data Analysis Software and Systems IV, ed. R. A. Shaw, H. E. Payne, & J. J. E. Hayes, ASP Conf. Ser. 77, 433 (In the text)
- Stutzki, J., & Winnewisser, G. 1985, A&A, 144, 13 [NASA ADS] (In the text)
- Swade, D. A. 1989, ApJ, 345, 828 [NASA ADS] [CrossRef] (In the text)
- Tafalla, M., Myers, P. C., Caselli, P., et al. 2004, A&A, 416, 191 [NASA ADS] [CrossRef] [EDP Sciences] (In the text)
- Townes, C. H., Genzel, R., Watson, D. M., et al. 1983, ApJ, 269, L11 [NASA ADS] [CrossRef] (In the text)
- Townsley, L. K. 2006, ArXiv Astrophysics e-prints (In the text)
- Ungerechts, H., Walmsley, C. M., & Winnewisser, G. 1980, A&A, 88, 259 [NASA ADS] (In the text)
- Ungerechts, H., Winnewisser, G., & Walmsley, C. M. 1986, A&A, 157, 207 [NASA ADS]
- Ungerechts, H., Bergin, E. A., Goldsmith, P. F., et al. 1997, ApJ, 482, 245 [NASA ADS] [CrossRef]
- Urquhart, J. S., Thompson, M. A., Morgan, L. K., et al. 2006, A&A, 450, 625 [NASA ADS] [CrossRef] [EDP Sciences] (In the text)
- Wang, Y., Zhang, Q., Pillai, T., Wyrowski, F., & Wu, Y. 2008, ApJ, 672, L33 [NASA ADS] [CrossRef] (In the text)
- Ward-Thompson, D., Motte, F., & Andre, P. 1999, MNRAS, 305, 143 [NASA ADS] [CrossRef] (In the text)
- White, G. J., Nelson, R. P., Holland, W. S., 1999, A&A, 342, 233 [NASA ADS]
- Whitney, B. A., Indebetouw, R., Babler, B. L., et al. 2004, ApJS, 154, 315 [NASA ADS] [CrossRef] (In the text)
- Zavagno, A., Deharveng, L., Comerón, F., et al. 2006, A&A, 446, 171 [NASA ADS] [CrossRef] [EDP Sciences] (In the text)
- Zhu, L.-B., Yang, J., & Wang, M. 2007, Chin. Astron. Astrophys., 31, 387 [NASA ADS] [CrossRef] (In the text)
Footnotes
- ...
SIMBA
![[*]](/icons/foot_motif.png)
- Sest IMaging Bolometer Array on the Sweedish ESO Submillimeter Telescope.
- ...
ATNF
- http://www.atnf.csiro.au/computing/software/
- ... FELLWALKER
- The FELLWALKER routine is part of the STARLINK package maintained at http://starlink.jach.hawaii.edu/
- ...éMiS
- See http://irfu.cea.fr/Sap/en/Phocea/Vie_des_labos/Ast/ast_technique.php?id_ast=2295
- ... APEX
- Atacama Pathfinder Experiment http://www.apex-telescope.org/
- ...
MSX
- Midcourse Space Experiment (MSX) http://irsa.ipac.caltech.edu/applications/MSX/
- ... tool
- kshell is part of the KARMA suite of analysis software available from the ATNF at http://www.atnf.csiro.au/computing/software/
All Tables
Table 1: Details of the Australia Telescope Compact Array observing runs.
Table 2: Centre coordinates of the ATCA fields corresponding approximately to the peak 1.2-mm emission.
Table 3: 22 GHz H2O masers in NGC 3576.
Table 4: ATCA NH3 percentage flux detected.
Table 5: Properties of the NH3 (1,1) cores found using the FELLWALKER routine in the ATCA data.
Table 6:
Comparison of masses derived from p-ArTéMiS 450 ![]() m and ATCA NH3 (1,1) emission.
m and ATCA NH3 (1,1) emission.
Table 7:
Molecular constants ![]() .
.
All Figures
| |
Figure 1:
Overview of the NGC 3576 star forming region. a) SPITZER 5.8 |
| Open with DEXTER | |
| In the text | |
| |
Figure 2:
a) Integrated intensity map of the NH3 (1,1) emission (thin black and white contours, and greyscale) made using the combined ATCA H75 and EW367 data. Contours are at 1.6, 7.9, 13.8, 20.0, 25.7, 31.5, 37.4, 43.6 and 50.1 K. The extent of the 23 GHz continuum emission from the central H II region is marked by the thick black contour. The 1.2-mm dust emission is outlined by a single white contour ( |
| Open with DEXTER | |
| In the text | |
| |
Figure 3:
23-GHz continuum emission from the
H II region at the centre of the NGC 3576 complex
(contours) overlaid on the 3.6 |
| Open with DEXTER | |
| In the text | |
| |
Figure 4: Cumulative H2O maser spectrum from a single baseline showing lines from across the filament. The two broad maser lines at -130 km s-1and -102 km s-1 derive from positions M9 and M5, respectively, towards the central H II region (see Table 3). The bulk of the maser lines concentrated near the systemic velocity at -24 km s-1 are scattered across the filament. The units of amplitude are arbitrary. |
| Open with DEXTER | |
| In the text | |
| |
Figure 5:
Positions and spectra for the 22 GHz H2O masers
detected in our ATCA EW367 array data. Six masers (M1, M2, M3, M6,
M7 and M8) are new detections. Greyscale and black contours are
the NH3 (1,1) integrated intensity map. The white line is
the |
| Open with DEXTER | |
| In the text | |
| |
Figure 6: NH3 (1,1) and (2,2) integrated intensity maps made using the 70-m Tidbinbilla telescope (greyscale and contours). Contours levels are at 10 percent intervals. The single thick black contour shows the extent of the 1.2 mm continuum emission (Hill et al. 2005). The grid inset into the NH3 (1,1) map illustrates the spectra which contributed to the map of the S5 field. |
| Open with DEXTER | |
| In the text | |
| |
Figure 7: Integrated intensity (zeroth-moment) maps of NGC 3576 in the six molecular transitions observed with the Mopra telescope ( left panels). Sample spectra, extracted from the data cube at the positions S1-S5, are presented to the right of each map. 13CO is generally optically thick and is a good tracer of the extended molecular envelope. HCO+ and H13CO+ trace similar gas densities to CO, while CS and N2H+ trace denser gas. |
| Open with DEXTER | |
| In the text | |
| |
Figure 8:
a) Map of the kinetic temperature derived from the ratio of the NH3 (1,1) and (2,2)
lines. The beam size is
|
| Open with DEXTER | |
| In the text | |
| |
Figure 9:
a) The spatial distribution of cores detected in the NH3 (1,1) data cube using the FELLWALKER routine overplotted on the integrated intensity image. Circles mark the positions of the cores and the radii are scaled to the core mass, as reported in Table 5; b) histogram showing the distribution of core masses assuming a single value of [NH3] / [H2] =
|
| Open with DEXTER | |
| In the text | |
| |
Figure 10: Column density maps of the four species targeted by the Mopra telescope. Contours are set at 10 per cent intervals, beginning at 10 per cent, except in the HCO+ column density map, where they start at 30 per cent of the peak value. |
| Open with DEXTER | |
| In the text | |
| |
Figure 11:
Distributions of
|
| Open with DEXTER | |
| In the text | |
| |
Figure 12: Maps of the relative abundance of [N2H+] / [CO] ( left) and [N2H+] / [CS] ( right) made from individual column density maps. Greyscale and contours are set at 10 per cent intervals, starting at 30 per cent of peak. The N2H+ abundance is significantly enhanced towards clump S4. This difference is especially pronounced in the [N2H+] / [CO] map but is not as clear when comparing N2H+ and CS. We note that the column density of CS is the least well known of the three species. |
| Open with DEXTER | |
| In the text | |
| |
Figure 13:
Position-velocity cuts through the
13CO data-cube. The top-left panel is an integrated
intensity map of 13CO showing the orientations and
positions of the PV-slices presented in panels 1-4.
Centre positions of the slices are marked with black and white
filled circles. Panel 1 shows the azimuthly averaged intensity as a function of velocity and angular offset from position 11 |
| Open with DEXTER | |
| In the text | |
| |
Figure 14:
a) Map of the difference between the peak intensities of the F
|
| Open with DEXTER | |
| In the text | |
| |
Figure 15: The distribution of stars with infrared excess determined by Maercker et al. (2006), plotted over the molecular gas traced by 13CO (1-0) emission. |
| Open with DEXTER | |
| In the text | |
| |
Figure 16:
Schematic of the environment of
NGC 3576 ( right panel). 13CO integrated intensity
contours tracing the extended molecular cloud, overlaid on a
H- |
| Open with DEXTER | |
| In the text | |
Copyright ESO 2009
Current usage metrics show cumulative count of Article Views (full-text article views including HTML views, PDF and ePub downloads, according to the available data) and Abstracts Views on Vision4Press platform.
Data correspond to usage on the plateform after 2015. The current usage metrics is available 48-96 hours after online publication and is updated daily on week days.
Initial download of the metrics may take a while.