| Issue |
A&A
Volume 502, Number 1, July IV 2009
|
|
|---|---|---|
| Page(s) | 175 - 187 | |
| Section | Interstellar and circumstellar matter | |
| DOI | https://doi.org/10.1051/0004-6361/200911820 | |
| Published online | 27 May 2009 | |
A spatial study of the mid-IR emission features in four Herbig Ae/Be stars
C. Boersma1 - E. Peeters2,3,4 - N. L. Martín-Hernández5 - G. van der Wolk1 - A. P. Verhoeff6 - A. G. G. M. Tielens7 - L. B. F. M. Waters6 - J. W. Pel1
1 - Kapteyn Astronomical Institute, PO Box 800, 9700 AV, Groningen, The Netherlands
2 - Department of Physics and Astronomy, University of Western Ontario, London, ON N6A 3K7, Canada
3 - SETI Institute, 515 N. Whisman Road, Mountain View, CA 94043, USA
4 - NASA-Ames Research Center, Mail Stop 245-6, Moffet Field, CA 94035, USA
5 - Instituto de Astrofísica de Canarias, vía Láctea s/n, E38205 La Laguna, Spain
6 - Astronomical Institute ``Anton Pannekoek'', University of Amsterdam, Kruislaan 403, 1098 SJ Amsterdam, The Netherlands
7 - NASA-Ames Research Center, Mail Stop 245-3, Moffet Field, CA 94035, USA
Received 10 February 2009 / Accepted 9 May 2009
Abstract
Context. Infrared (IR) spectroscopy and imaging provide a prime tool to study the characteristics of polycyclic aromatic hydrocarbon (PAH) molecules and the mineralogy in regions of star formation. Herbig Ae/Be stars are known to have varying amounts of natal cloud material present in their vicinity.
Aims. Our aim is to study the characteristics of the mid-IR emission originating in Herbig Ae/Be stars, especially the extent of the emission and how this relates to the (proto-)stellar characteristics.
Methods. Today's powerful ground- and space-based telescopes provide images and spectra at unprecedented spectral and spatial resolution. We analyse the images and spectra from four Herbig Ae/Be stars (IRAS 06084-0611, CD-42 11721, TY CrA, and HD 176386), as obtained with TIMMI2 on the ESO 3.6 m telescope and VISIR on the VLT. These observations are supplemented with data from ISO-SWS and Spitzer-IRAC.
Results. We find evidence for large-scale structure and extended emission in all four sources, except for HD 176386, which only shows silicate emission, all sources show PAH emission in their spectra. In addition, a spatially resolved silicate and PAH spectrum could be extracted for TY CrA.
Conclusions. The variety in emission scales distinguishes two classes. In the first, the morphology and spectral characteristics resemble those of reflection nebulae. In the second, the characteristics are in-line with Herbig A stars. This separation simply reflects a difference in stellar characteristics (e.g. luminosity). In Herbig B stars, dust emission from the surroundings dominates, where for Herbig A stars, the disk dominates the emission. In this scheme, IRAS 06084-0611 and CD-42 11721 resemble reflection nebulae and HD 176386 a more typical Herbig Ae/Be star. TY CrA shows characteristics common to both genuine reflection nebulae and Herbig B stars. We propose a geometry for TY CrA, with most notably, a ![]() 70 AU inner gap in the 340 AU circumtertiary disk cleared by a fourth stellar companion.
70 AU inner gap in the 340 AU circumtertiary disk cleared by a fourth stellar companion.
Key words: techniques: spectroscopic - infrared: ISM - ISM: molecules - astrochemistry
1 Introduction
Herbig Ae/Be stars are pre-main sequence stars of intermediate mass and spectral class A or B that exhibit emission lines and have associated nebulosities. Many Herbig Ae/Be stars show an infrared excess of thermal origin and non-zero polarisation at optical wavelengths. These are signs for circumstellar material, possibly distributed in a proto-planetary disk (Herbig 1960). Often, Herbig Ae/Be stars are considered as the younger/heavier counterparts of T Tauri stars (Waters & Waelkens 1998).
Herbig Ae/Be stars form in large molecular clouds, which initially can obscure them from sight. When the stellar light is able to break through, the star starts to illuminate its surroundings. Continuing their pre-main sequence evolution, the star will evacuate a cavity in the surrounding medium (e.g. NGC 2023 and NGC 7023). The (proto-)stellar mass determines the total luminosity and the number of ionising photons. More massive stars can clear out their direct surroundings more rapidly than less massive stars. Moreover, they provide stronger illumination, therefore, the neutral natal cloud material located far away will then become a reflection nebula. For less massive stars, hence less luminous, only their direct environment (e.g. circumstellar envelope) will be illuminated. In the final stages of the star's pre-main sequence evolution, the newly formed star will have removed most of its surrounding envelope, leaving only the remnant, dusty, accretion disk. These objects are known collectively as ``isolated'' Herbig Ae/Be stars (Waelkens & Waters 1997).
The infrared spectra of Herbig Ae/Be stars reveal a wide variety of
dust particles, including carbonaceous and (crystalline) silicate
grains (van den Ancker et al. 2000; Bouwman et al. 2000;
Waelkens et al. 1996). Specifically, many sources show IR
emission around 3.3, 6.2, 7.6, 7.8, 11.2, and 12.7 ![]() m, attributed
to polycyclic aromatic hydrocarbons (PAHs), i.e. large molecules of
many fused aromatic rings (Leger & Puget 1984;
Cohen et al. 1985; Allamandola et al. 1989).
m, attributed
to polycyclic aromatic hydrocarbons (PAHs), i.e. large molecules of
many fused aromatic rings (Leger & Puget 1984;
Cohen et al. 1985; Allamandola et al. 1989).
Isolated Herbig Ae/Be stars often show evidence for the onset of planet formation (dust coagulation, settling) and even planet formation itself (in a few cases, Reipurth et al. 2007).
Table 1: Stellar data.
Based on the size of the infrared excess and where in the spectrum it starts to dominate, a sub-division is made in Group I and II sources (Meeus et al. 2001). In the latter case, the infrared emission is more modest. This difference has been attributed to differences in disk geometry (Meeus et al. 2001): Group I sources have flaring disks and Group II sources have more flattened disks with a shadowed region. PAHs are a good diagnostic for this geometry, as they emit through UV-pumped fluorescence. Flaring disks subtend a larger solid angle viewed from the star and are thus able to reprocess more stellar light than flat disks.
The observed spectra reveal that PAHs undergo considerable processing during the early evolution of the YSO. Specifically, embedded object show a PAH spectrum resembling that of the ISM. More isolated Herbig Ae/Be stars show a more processed spectrum. These spectral variations imply considerable chemical changes, likely driven by the strong radiation field in the YSO's environment (Sloan et al. 2007; Boersma et al. 2008; Keller et al. 2008). Many aspects behind the processing, e.g. in what way the PAHs are modified, what process drives it, and when it commences, are not yet well understood. In this paper we compare spectra and images of four Herbig Ae/Be stars and speculate on the influence of stellar characteristics on the dust and morphology.
The paper has been organised as follows. In Sect. 2, the sources are introduced. In Sect. 3, the observations and data reduction are discussed. In Sect. 4 we describe our analysis and results. Subsequently, Sect. 5 presents a discussion and highlights the astronomical implications. Section 6 summarises our main conclusions.
2 The sources
CD-42 11721 is a southern galactic star embedded in a small and extremely thick dark cloud. While it has been suggested that CD-42 11721 possibly is an evolved B[e] super-giant (e.g. Borges Fernandes et al. 2007, and references therein), its association with a star forming region as well as more general characteristics, e.g. its luminosity class (IV), establishes it in our view as a young stellar object.
IRAS 06084-0611 is a red nebulous object embedded in the Monoceros molecular cloud. Two bright mid-infrared sources are seen in the mid-IR images from Persi & Tapia (2003) and are identified with the cometary H II region VLA1 (IRS 4) and the faint compact radio continuum source VLA4 (IRS 2). Persi & Tapia (2003) suggest the latter is probably a Herbig Ae/Be star.
TY CrA is a multiple star-system consisting of at least four
stars. Three stars are within 1.5 AU of each other, of which one is a
Herbig Ae/Be star. The fourth star is located at a projected distance
of ![]() 0.3
0.3
![]() (40 AU) from the compact tertiary
system. The three companions of the Herbig Ae/Be star are of later
M-type (Chauvin et al. 2003). TY CrA is located near one of the
densest parts of the R Corona Australis star-forming region, embedded
in the bright reflection nebula NGC 6726/6727.
(40 AU) from the compact tertiary
system. The three companions of the Herbig Ae/Be star are of later
M-type (Chauvin et al. 2003). TY CrA is located near one of the
densest parts of the R Corona Australis star-forming region, embedded
in the bright reflection nebula NGC 6726/6727.
HD 176386 is an optically detected pre-main sequence star with a
companion at ![]()
![]() (i.e. CCDM
J19017-3653B, Jeffers et al. 1963). The companion is likely a
low-mass star (Turon et al. 1993). Also, signs of ongoing
accretion have been reported (Grady et al. 2001). HD 176386 is
located in the R Corona Australis star-forming region,
(i.e. CCDM
J19017-3653B, Jeffers et al. 1963). The companion is likely a
low-mass star (Turon et al. 1993). Also, signs of ongoing
accretion have been reported (Grady et al. 2001). HD 176386 is
located in the R Corona Australis star-forming region,
![]()
![]() from TY CrA.
from TY CrA.
The stellar characteristics of the four objects considered here are summarised in Table 1.
3 Observations and reduction
We have performed a 10 ![]() m spectral imaging study of the four
Herbig Ae/Be stars introduced in Sect. 2. The Thermal
Infrared MultiMode Instrument (TIMMI2) at the ESO 3.6 m telescope
(Reimann et al. 2000) was used to obtain N-band imaging and
spectroscopy of CD-42 11721 and the two bright mid-IR positions in
IRAS 06084-0611 (VLA1 and VLA4). The Very large Imager and
Spectrometer for the mid-IR (VISIR, Lagage et al. 2004)
instrument at the Very Large Telescope (VLT) was used to obtain
imaging and spectra of HD 176386 and TY CrA. The data are supplemented
with data from the Short Wavelength Spectrometer
(SWS, de Graauw et al. 1996) on board ESA's Infrared Space
Observatory (ISO, Kessler et al. 1996) and from the InfraRed
Array Camera (IRAC, Fazio et al. 2004) on board NASA's
Spitzer space telescope. Table 2 summarises the data
obtained for each target. The ground-based observation log is shown in
Table 3.
m spectral imaging study of the four
Herbig Ae/Be stars introduced in Sect. 2. The Thermal
Infrared MultiMode Instrument (TIMMI2) at the ESO 3.6 m telescope
(Reimann et al. 2000) was used to obtain N-band imaging and
spectroscopy of CD-42 11721 and the two bright mid-IR positions in
IRAS 06084-0611 (VLA1 and VLA4). The Very large Imager and
Spectrometer for the mid-IR (VISIR, Lagage et al. 2004)
instrument at the Very Large Telescope (VLT) was used to obtain
imaging and spectra of HD 176386 and TY CrA. The data are supplemented
with data from the Short Wavelength Spectrometer
(SWS, de Graauw et al. 1996) on board ESA's Infrared Space
Observatory (ISO, Kessler et al. 1996) and from the InfraRed
Array Camera (IRAC, Fazio et al. 2004) on board NASA's
Spitzer space telescope. Table 2 summarises the data
obtained for each target. The ground-based observation log is shown in
Table 3.
Table 2: Collected data.
Table 3: Observation log of the TIMMI2 and VISIR data.
3.1 IRAC
The InfraRed Array Camera (IRAC, Fazio et al. 2004) is a
four channel camera providing simultaneous
![]() images at 3.6, 4.5, 5.8 and 8.0
images at 3.6, 4.5, 5.8 and 8.0 ![]() m. The detectors are 256
m. The detectors are 256![]() 256 pixels in size, giving a
pixel scale of
256 pixels in size, giving a
pixel scale of ![]() 1.2
1.2
![]() .
.
A large portion of the R Corona Australis star-forming region and the
Monoceros molecular cloud have been observed in the programme entitled
``Structure and Incidence of Young Embedded Clusters'' (PID 6). We
retrieved the post-Basic Calibrated Data (bcd; data that went through
the extended pipeline) for these regions from the Spitzer Science
Center (SSC) where it has been processed with pipeline version
S14.0.0. From the High-Dynamical-Range (hdr; short exposure) mosaic, a
![]() pixel sub-image was extracted around TY CrA and
HD 176386. For IRAS 06084-0611, a
pixel sub-image was extracted around TY CrA and
HD 176386. For IRAS 06084-0611, a
![]() pixel sub-image was
extracted around the positions of VLA1 and VLA4.
pixel sub-image was
extracted around the positions of VLA1 and VLA4.
CD-42 11721 has been observed by the Spitzer Legacy programme
GLIMPSE-Galactic Plane Survey (PID 192). Enhanced data products, made
available by the GLIMPSE team, were retrieved and from the mosaics, a
![]() pixel sub-image was extracted around CD-42 11721. Near
the centre, the image appears saturated in two distinct peaks.
pixel sub-image was extracted around CD-42 11721. Near
the centre, the image appears saturated in two distinct peaks.
For each source, the 3.6, 5.8 and 8.0 ![]() m maps were combined into a
single RGB-colour image, with the blue, green, and blue channel
representing 3.6, 5.8, and 8.0
m maps were combined into a
single RGB-colour image, with the blue, green, and blue channel
representing 3.6, 5.8, and 8.0 ![]() m, respectively. The resulting
images are presented in Fig. 1.
m, respectively. The resulting
images are presented in Fig. 1.
![\begin{figure}
\par\mbox{\includegraphics[height=75mm]{11820f01} \includegraphic...
...ight=75mm]{11820f02} }
\par\includegraphics[height=75mm]{11820f03}
\end{figure}](/articles/aa/full_html/2009/28/aa11820-09/img42.png) |
Figure 1:
Three colour composite IRAC images (red: 8.0, green: 5.8 and blue: 3.6 |
| Open with DEXTER | |
3.2 TIMMI2
TIMMI2 has a camera that uses a
![]() pixel Raytheon Si:As
array. In imaging, the N11.9-OCLI filter was selected and a pixel
scale of 0.2
pixel Raytheon Si:As
array. In imaging, the N11.9-OCLI filter was selected and a pixel
scale of 0.2
![]() ,
providing a total field of view of
,
providing a total field of view of
![]() .
For long-slit
spectroscopy, the 10
.
For long-slit
spectroscopy, the 10 ![]() m low-resolution grism was used. The grism
covers wavelengths from 7.5 to 13.9
m low-resolution grism was used. The grism
covers wavelengths from 7.5 to 13.9 ![]() m and provides a spectral
resolving power
m and provides a spectral
resolving power
![]() .
The slit was
.
The slit was
![]() in size and the pixel
scale,
in size and the pixel
scale,
![]() .
At the time of the observation, the slit
could only be oriented North-South.
.
At the time of the observation, the slit
could only be oriented North-South.
The slit was positioned across the two bright mid-IR components of
IRAS 06084-0611, VLA1 and VLA4, and across the central star of CD-42
11721 (see Fig. 1). In order to correct for background
emission from the sky, the observations were performed using a
standard North-South chopping/nodding technique. The applied nod
amplitude was the same as the chop amplitude, and the telescope nodded
opposite to the chopping direction of the secondary mirror. The
amplitude was
![]() for IRAS 06084-0611 and
for IRAS 06084-0611 and
![]() for CD-42 11721. These chop throws were large
enough to avoid confusion.
for CD-42 11721. These chop throws were large
enough to avoid confusion.
The N-band imaging of the standard stars were performed in the same filter as the target and used for photometric flux conversion from photon count rates (ADU/s) into astronomical units (Jy), for atmospheric corrections and for establishing the point spread function (PSF). To minimise residuals of the telluric line cancellation, the standard star and the target were observed at similar air masses. A flux correction provided by the TIMMI2 instrument team takes care of the (small) differential air mass between the target and the standard star that remains. The synthetic calibrated spectra for the standard stars are taken from Cohen et al. (1999).
Data processing included the removal of bad frames and summing of all
good chopping and nodding pairs. This procedure is applied to
both target and calibrator star. For each pixel, the uncertainty,
dominated by variations of the sky transparency, was propagated along
each step of the processing. However, the chop amplitude of
![]() used for CD-42 11721 turned out to be too large
for the telescope mechanics. This resulted in a varying chop amplitude
that introduced shifts of several pixels between the central position
of the source on each frame, producing a chopping smearing along the
North-South direction. This problem was solved by summing only the
chopping and nodding pairs with a shift
used for CD-42 11721 turned out to be too large
for the telescope mechanics. This resulted in a varying chop amplitude
that introduced shifts of several pixels between the central position
of the source on each frame, producing a chopping smearing along the
North-South direction. This problem was solved by summing only the
chopping and nodding pairs with a shift ![]() 1 pixel. For imaging and
spectroscopy this was 4 out of 48 and 196 out of 320 frames,
respectively.
1 pixel. For imaging and
spectroscopy this was 4 out of 48 and 196 out of 320 frames,
respectively.
The spectra were extracted over apertures of 1.5 times the (average)
full-width-at-half-maximum (FWHM) measured along the spatial
direction, where the FWHM for VLA1 and VLA4 are 4.7 and
3.6
![]() ,
respectively. The source profile of CD-42 11721
along the slit shows three emission peaks (see Figs. 1
and 2). Each of these peaks has been fitted
with a Gaussian. These were then used to extract the spectrum of each
component. In particular, the corresponding FWHM of the central peak
is 1.8
,
respectively. The source profile of CD-42 11721
along the slit shows three emission peaks (see Figs. 1
and 2). Each of these peaks has been fitted
with a Gaussian. These were then used to extract the spectrum of each
component. In particular, the corresponding FWHM of the central peak
is 1.8
![]() and 4.7
and 4.7
![]() for both the
bracketing peaks. The pixel-to-wavelength correspondence provided by
the TIMMI2 support team is applied for wavelength calibration. The
fully reduced spectra are presented in Figs. 3 and 4.
for both the
bracketing peaks. The pixel-to-wavelength correspondence provided by
the TIMMI2 support team is applied for wavelength calibration. The
fully reduced spectra are presented in Figs. 3 and 4.
![\begin{figure}
\par\includegraphics[width=9cm]{11820f04}
\end{figure}](/articles/aa/full_html/2009/28/aa11820-09/img51.png) |
Figure 2:
Two spatial cross-cuts of the TIMMI2 spectra of CD-42 11721. The top panel plots the continuum between 9.7 and 10.9 |
| Open with DEXTER | |
![\begin{figure}
\par\includegraphics[width=9cm,clip]{11820f05} \end{figure}](/articles/aa/full_html/2009/28/aa11820-09/img52.png) |
Figure 3:
The top two panels show the TIMMI2 spectra of IRAS 06084-0611 VLA1 and VLA4. A comparison between the ISO-SWS spectrum and the TIMMI2 spectra of IRAS 06084-0611 VLA4 (see Fig. 1 for the apertures) is plotted in the middle panel. The lower two panels shows the FWHM of both sources as a function of wavelength (black diamonds), the FWHM of the sources in the 11.9 |
| Open with DEXTER | |
![\begin{figure}
\par\includegraphics[width=8.9cm,clip]{11820f06}
\end{figure}](/articles/aa/full_html/2009/28/aa11820-09/img54.png) |
Figure 4:
The TIMMI2 spectra of the three components of CD-42 11721 (see Figs. 1 and 2, and Sect. 3.2) are shown in the top three panels. The fourth panel shows a comparison of the TIMMI2 spectrum of the four emission peaks combined with the ISO-SWS spectrum. The dashed lines show the fit made to the star (
|
| Open with DEXTER | |
3.3 VISIR
VISIR has two DRS, former Boeing,
![]() BIB detectors. In
spectroscopy the pixel scale was set to 0.127
BIB detectors. In
spectroscopy the pixel scale was set to 0.127
![]() .
The
low resolution (
.
The
low resolution (
![]() -390) configuration
with a 1
-390) configuration
with a 1
![]() slit was chosen to obtain spectra in the
8.8, 9.8, 11.4 and 12.2
slit was chosen to obtain spectra in the
8.8, 9.8, 11.4 and 12.2 ![]() m wavelength settings. A standard
chop-nodding along the slit was applied to correct for background
emission. The orientation of the slit was chosen such that, for TY
CrA, both the ``bar'' and the central star are probed (see
Fig. 1). For HD 17386 the orientation was chosen such that
it encompasses the two emission sources visible in the K-band (2.2
m wavelength settings. A standard
chop-nodding along the slit was applied to correct for background
emission. The orientation of the slit was chosen such that, for TY
CrA, both the ``bar'' and the central star are probed (see
Fig. 1). For HD 17386 the orientation was chosen such that
it encompasses the two emission sources visible in the K-band (2.2 ![]() m) acquisition image (see Fig. 1). Due to the extent
of TY CrA and HD 176386 and their direct surroundings, chopping was
done off the detector. Standard calibration has been done with
calibrators with similar air masses at the time of
observation. Detector Integration Times (DITs) were 0.0625 s for
both the 8.8 and 9.8
m) acquisition image (see Fig. 1). Due to the extent
of TY CrA and HD 176386 and their direct surroundings, chopping was
done off the detector. Standard calibration has been done with
calibrators with similar air masses at the time of
observation. Detector Integration Times (DITs) were 0.0625 s for
both the 8.8 and 9.8 ![]() m wavelength settings and 0.05 and 0.04 s for the 11.4 and 12.2
m wavelength settings and 0.05 and 0.04 s for the 11.4 and 12.2 ![]() m wavelength settings,
respectively. To improve the signal-to-noise, all four wavelength
settings were observed two times 10 min for TY CrA, and four times
10 min for HD 176386.
m wavelength settings,
respectively. To improve the signal-to-noise, all four wavelength
settings were observed two times 10 min for TY CrA, and four times
10 min for HD 176386.
The initial reduction steps are performed by the standard ESO reduction pipeline software, making use of the graphical user interface to the pipeline, GASGANO. Pipeline products include the final, summed, distortion-corrected 2D spectrum for each wavelength setting, a pixel-to-wavelength map and a synthetic spectrum of the calibrator. The following reduction steps, are applied to the 2D spectra.
The residual background is corrected by fitting, ignoring the target's
dispersion profile, each pixel row with a second order polynomial and
subtracting it. Weight maps are constructed from the 2D spectra by
collapsing them into the wavelength direction and forcing the area
underneath the resulting spatial profile to one. The next step is
multiplying the weight maps with the 2D spectra and collapsing the
results in the spatial direction. The obtained 1D spectra are
wavelength calibrated using the earlier obtained pixel-to-wavelength
mapping. The target is flux calibrated by multiplying the target
spectra by the synthetic spectra and dividing by the calibrator's
spectra. Also, in view of the difference in chopping technique (off
and on the slit), the number of beams on the detector is taken into
account: two for the off-source chopped target and four for the
calibrators. The four different wavelength settings are spliced to the
mean of the overlapping area by multiplication by a factor, keeping
the 9.8 ![]() m wavelength setting constant. In the final reduction
steps, all observations are combined. A correction for any uniform
differences in flux is made by multiplying by a factor that brings the
separate observations to the mean. The uncertainties are constructed
by taking the statistical difference between all observations.
m wavelength setting constant. In the final reduction
steps, all observations are combined. A correction for any uniform
differences in flux is made by multiplying by a factor that brings the
separate observations to the mean. The uncertainties are constructed
by taking the statistical difference between all observations.
On top of the general reduction scheme described above, additional
steps were required for TY CrA and HD 176386. Inspection of the
(wavelength collapsed) spatial emission profile of TY CrA reveals two
blended components in the source profile.
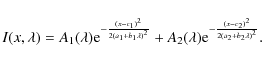
To disentangle both components we fit a function described by Eq. (1), where each diffraction pattern is assumed Gaussian and the wavelength dependent FWHM of the pattern is taken linear (
The 2D spectral images of HD 176386 display two spatially separated sources. Hereafter these sources are referred to as Position 1 and Position 2. Position 1 corresponds to HD 176386 itself. For some observations, some wavelength settings show a strong varying background. Therefore, the Position 1 and 2 spectra are extracted by masking out the emission from the other position and following the reduction steps described above, but disregarding the wavelength settings where the background turns out to be too unstable for a proper extraction. Fortunately, for each wavelength setting there were at least two good observations, allowing for the construction of a complete spectrum. Figure 7 presents the spectrum of Position 1, median smoothed over 5 resolution elements.
![\begin{figure}
\par\includegraphics[width=9cm]{11820f07}
\end{figure}](/articles/aa/full_html/2009/28/aa11820-09/img62.png) |
Figure 5: Spectra for the total, amorphous silicate and PAH component of TY CrA when integrating the area underneath the Gaussians fitted to the spatial profile (see text for details). |
| Open with DEXTER | |
| |
Figure 6: FWHM as a function of wavelength of the amorphous silicate and PAH components in TY CrA. Also shown is the FWHM of the calibrator as a function of wavelength. |
| Open with DEXTER | |
![\begin{figure}
\par\includegraphics[width=8cm]{11820f09}
\end{figure}](/articles/aa/full_html/2009/28/aa11820-09/img64.png) |
Figure 7: VISIR spectrum of HD 176386 Position 1, median smoothed over 5 elements. |
| Open with DEXTER | |
3.4 ISO-SWS
ISO's SWS instrument provided medium and high spectral resolution in
the wavelength region from 2.38 to 45.2 ![]() m. For wavelengths
smaller than 12
m. For wavelengths
smaller than 12 ![]() m, the aperture on the sky was
m, the aperture on the sky was
![]() in size, for wavelengths
between 12 and 27.5
in size, for wavelengths
between 12 and 27.5 ![]() m
m
![]() .
These apertures are
indicated in Fig. 1.
.
These apertures are
indicated in Fig. 1.
All data were processed with IA3, the SWS Interactive Analysis package, using calibration files and procedures equivalent with pipeline version 10.1. A detailed account of the reduction can be found in Peeters et al. (2002b). Table 4 summarises the observations and the fully reduced spectra are presented in Fig. 8.
4 Analysis and results
For ISO-SWS data, PAH bands strengths are taken from Hony et al. (2001), van Diedenhoven et al. (2004) and Hony et al. (2001). When unavailable, these were calculated directly from the ISO-SWS spectrum following the procedures outlined by these authors. The PAH band strengths are presented in Table 5.
The IRAC images display a wealth of structure (Fig. 1). Therefore, some confusion is likely present in the spectra from these sources. In the following subsections the extent of the different sources and emission components are determined. The results have been summarised in Table 6.
4.1 IRAS 06084-0611
The 3-colour IRAC image shows a nebulous region encompassing both VLA1 and VLA4, with an arm stretching towards the North-Eastern direction (Fig. 1).
The TIMMI2 spectra show for both sources quite different behaviour
(top two panels of Fig. 3). VLA1's spectral shape
resembles that of an embedded YSO, whereas VLA4 shows a far richer
spectrum with strong PAH features at 8.6, 11.2 and 12.7 ![]() m. The
ISO-SWS spectrum also shows these PAH features, in addition to those
at 3.3, 6.2 and ``7.7''
m. The
ISO-SWS spectrum also shows these PAH features, in addition to those
at 3.3, 6.2 and ``7.7'' ![]() m (Fig. 8).
m (Fig. 8).
The short wavelength ISO-SWS aperture only covers VLA4, while the long wavelength ISO-SWS aperture encompasses both VLA1 and VLA4. Comparison of the ISO-SWS observations with the TIMMI2 observations centred on VLA4 is done in the third panel of Fig. 3. The apparent flux difference reflects the extent of the emission and the difference in aperture/slit size between TIMMI2 and ISO-SWS. The similarity between the continuum in the ISO-SWS spectrum and the TIMMI2 spectrum of VLA1 is striking and suggests a contribution of VLA1 to the ISO-SWS spectrum of VLA4 (Fig. 3).
The ISO-SWS spectrum also shows the 15.25 ![]() m CO
m CO![]() -ice feature,
which we attribute to absorption by ice grains along the line of sight
towards the deeply embedded and very red object VLA1. Figure 9 presents the absorption profile in detail. Following the
procedure outlined by Boogert (1999, Chapter 5 of his thesis), we obtain an ice temperature of 100-110 K, typical for an
embedded YSO.
-ice feature,
which we attribute to absorption by ice grains along the line of sight
towards the deeply embedded and very red object VLA1. Figure 9 presents the absorption profile in detail. Following the
procedure outlined by Boogert (1999, Chapter 5 of his thesis), we obtain an ice temperature of 100-110 K, typical for an
embedded YSO.
Table 4: Summary of the ISO-SWS observations.
![\begin{figure}
\par\includegraphics[width=8cm]{11820f10}
\end{figure}](/articles/aa/full_html/2009/28/aa11820-09/img71.png) |
Figure 8:
ISO-SWS spectra of IRAS 06084-0611, CD-42 11721 and TY CrA. Indicated are the 3.3, 6.2, ``7.7'', 8.6, 11.2, 12.7, 16.4 and 17.4 |
| Open with DEXTER | |
To investigate the extent of the 10 ![]() m emission, the FWHM as a
function of wavelength is determined by fitting Gaussians to the
spatial profiles on the calibrated 2D spectral images at every
wavelength bin. The results are presented in the bottom two panels of
Fig. 3 and are compared to the FWHM of the
calibrator. VLA1 is resolved and has a size of about
2.8
m emission, the FWHM as a
function of wavelength is determined by fitting Gaussians to the
spatial profiles on the calibrated 2D spectral images at every
wavelength bin. The results are presented in the bottom two panels of
Fig. 3 and are compared to the FWHM of the
calibrator. VLA1 is resolved and has a size of about
2.8
![]() (2800 AU). VLA4 is also resolved and is more
extended in the PAH bands (
(2800 AU). VLA4 is also resolved and is more
extended in the PAH bands (![]() 2.2
2.2
![]() ;
2200 AU) than
in the continuum (
;
2200 AU) than
in the continuum (![]() 1.2
1.2
![]() ;
1300 AU). From the 11.9
;
1300 AU). From the 11.9
![]() m TIMMI2 image, a FWHM of
m TIMMI2 image, a FWHM of
![]() (2900 AU) and
(2900 AU) and
![]() (2000 AU) is derived for VLA1 and VLA4,
respectively. The sizes obtained from the images and spectra are in
reasonable agreement.
(2000 AU) is derived for VLA1 and VLA4,
respectively. The sizes obtained from the images and spectra are in
reasonable agreement.
In Fig. 10, the 11.2 and 10.5 ![]() m spatial profiles
of VLA4 are compared to the 11.2
m spatial profiles
of VLA4 are compared to the 11.2 ![]() m spatial profile from the
calibrator. Both the continuum (9.7-10.9
m spatial profile from the
calibrator. Both the continuum (9.7-10.9 ![]() m) and the PAH
emission (11.1-11.31
m) and the PAH
emission (11.1-11.31 ![]() m) are resolved and show a skewed
profile. The continuum has an extent of 1700 AU (non-Gaussian FWHM is
1.6
m) are resolved and show a skewed
profile. The continuum has an extent of 1700 AU (non-Gaussian FWHM is
1.6
![]() )
and the PAH emission extends over 2000 AU
(non-Gaussian
)
and the PAH emission extends over 2000 AU
(non-Gaussian
![]() ). The small difference in
the extent between here and in Fig. 3 is likely
due to the profile's deviation from a Gaussian.
). The small difference in
the extent between here and in Fig. 3 is likely
due to the profile's deviation from a Gaussian.
Table 5: PAH band strengths determined from the ISO-SWS spectra.
4.2 CD-42 11721
The 3-colour IRAC image shows a nebulous region
(Fig. 1). Although the centre of the image is saturated,
there appear two distinct emission peaks. One is the star, the other a
close-by patch. Both peaks are separated by 4.3
![]() (1700 AU). Additionally, an arc stretching towards the South-East is
visible, which is also seen in the 11.9
(1700 AU). Additionally, an arc stretching towards the South-East is
visible, which is also seen in the 11.9 ![]() m TIMMI2 and the 8.0
m TIMMI2 and the 8.0 ![]() m IRAC images. It is evident from the good agreement between the
TIMMI2 and IRAC contours that the problems introduced by the varying
chop throw (see Sect. 3) have been largely
corrected for by our applied reduction steps (see
Sect. 3.2). Note how the TIMMI2 slit cuts through both
distinct emission peaks and the arc. These three components are also
identifiable in the wavelength collapsed spatial cross-cuts of the
TIMMI2 spectra, Fig. 2. The separation between
the central two emission peaks in the cross-cut
(
m IRAC images. It is evident from the good agreement between the
TIMMI2 and IRAC contours that the problems introduced by the varying
chop throw (see Sect. 3) have been largely
corrected for by our applied reduction steps (see
Sect. 3.2). Note how the TIMMI2 slit cuts through both
distinct emission peaks and the arc. These three components are also
identifiable in the wavelength collapsed spatial cross-cuts of the
TIMMI2 spectra, Fig. 2. The separation between
the central two emission peaks in the cross-cut
(![]() 4.0
4.0
![]() )
and the images are in reasonable
agreement. Additionally, Fig. 2 possibly shows
the arc extending onto larger scales, with its centre on the star and
a projected radius of
)
and the images are in reasonable
agreement. Additionally, Fig. 2 possibly shows
the arc extending onto larger scales, with its centre on the star and
a projected radius of ![]() 11
11
![]() .
.
Summing all frames for the 11.9 ![]() m image obtained with TIMMI2,
including those having shifts introduced by the chopping problem (see
Sect. 3.2), the spatial FWHM of the star is
m image obtained with TIMMI2,
including those having shifts introduced by the chopping problem (see
Sect. 3.2), the spatial FWHM of the star is ![]() 4.7 pixels (0.94
4.7 pixels (0.94
![]() ). When only frames with a shift in
pixels
). When only frames with a shift in
pixels ![]() 1 are considered, this FWHM decreases to
1 are considered, this FWHM decreases to ![]() 3.9 pixels (0.78
3.9 pixels (0.78
![]() ), closer to the FWHM of the standard
stars (i.e. 2.9 pixels; 0.58
), closer to the FWHM of the standard
stars (i.e. 2.9 pixels; 0.58
![]() )
and therefore likely
unresolved. The peaks of PAH emission are smeared out when all the
frames are summed.
)
and therefore likely
unresolved. The peaks of PAH emission are smeared out when all the
frames are summed.
Table 6: Gaussian FWHM of the different objects and emission components studied here (still convolved).
The ISO-SWS spectrum shows the prominent PAH features at 3.3, 6.2,
``7.7'', 11.2, 12.7 and 16.4 ![]() m (Fig. 8). The
strengths of most of these bands are listed in Table 5. The TIMMI2 spectra for the four individual emission
peaks are plotted in Fig. 4. The spectra of the
PAH peaks are very similar, all showing the 8.6, 11.2 and 12.7
m (Fig. 8). The
strengths of most of these bands are listed in Table 5. The TIMMI2 spectra for the four individual emission
peaks are plotted in Fig. 4. The spectra of the
PAH peaks are very similar, all showing the 8.6, 11.2 and 12.7 ![]() m
PAH bands. In the fourth panel of Fig. 4, a
scaled version of the ISO-SWS spectrum is compared to the total
combined TIMMI2 spectrum (i.e. star + PAH components). The higher flux
levels reflect the larger aperture of ISO-SWS and the extent of the
PAH emission. The similar shaped spectrum of the arc and the nearby
peak suggests that the same kind of material is radiating. As
expected, the central star shows an almost featureless spectrum.
m
PAH bands. In the fourth panel of Fig. 4, a
scaled version of the ISO-SWS spectrum is compared to the total
combined TIMMI2 spectrum (i.e. star + PAH components). The higher flux
levels reflect the larger aperture of ISO-SWS and the extent of the
PAH emission. The similar shaped spectrum of the arc and the nearby
peak suggests that the same kind of material is radiating. As
expected, the central star shows an almost featureless spectrum.
4.3 TY CrA
The 3-colour IRAC image shows a nebulous region surrounding TY CrA and a ``bar'' like structure to the South-East (Fig. 1).
![\begin{figure}
\par\includegraphics[width=8cm,clip]{11820f11}
\end{figure}](/articles/aa/full_html/2009/28/aa11820-09/img77.png) |
Figure 9:
15.25 |
| Open with DEXTER | |
![\begin{figure}
\par\includegraphics[width=8cm]{11820f12}
\end{figure}](/articles/aa/full_html/2009/28/aa11820-09/img78.png) |
Figure 10:
Spatial distribution of IRAS 06084-0611 VLA4 (solid line) and the calibration star (dotted line) from TIMMI2 at 11.22 |
| Open with DEXTER | |
From the VISIR 2D image we were able to decompose the central source
profile into two components (see Sect. 3.3), separated
by ![]() 2.5 pixels (0.32
2.5 pixels (0.32
![]() ). The two spectra extracted
are shown in Fig. 5: a PAH spectrum and an
amorphous silicate spectrum. The PAH spectrum, shown in the panel
labelled PAHs of Fig. 5, clearly shows strong
PAH bands at 8.6, 11.2 and 12.7
). The two spectra extracted
are shown in Fig. 5: a PAH spectrum and an
amorphous silicate spectrum. The PAH spectrum, shown in the panel
labelled PAHs of Fig. 5, clearly shows strong
PAH bands at 8.6, 11.2 and 12.7 ![]() m. Additionally, the shoulder of
the ``7.7''
m. Additionally, the shoulder of
the ``7.7'' ![]() m PAH band at the blue edge of the spectrum and the
minor PAH features at 11.0 and
m PAH band at the blue edge of the spectrum and the
minor PAH features at 11.0 and ![]() 12
12 ![]() m are present. The
ISO-SWS spectrum also shows these PAH bands, in addition to bands at
3.3, 6.2, ``7.7'', and 16.4
m are present. The
ISO-SWS spectrum also shows these PAH bands, in addition to bands at
3.3, 6.2, ``7.7'', and 16.4 ![]() m (Fig. 8). The
strengths of most of these bands are listed in Table 5. The amorphous silicate spectrum peaks near 9.8
m (Fig. 8). The
strengths of most of these bands are listed in Table 5. The amorphous silicate spectrum peaks near 9.8 ![]() m, indicative of the Si-O stretch in amorphous
silicate. Following van Boekel et al. (2005), the ratio of the
silicate feature peak/continuum is
m, indicative of the Si-O stretch in amorphous
silicate. Following van Boekel et al. (2005), the ratio of the
silicate feature peak/continuum is ![]() 3.26 and the 11.3/9.8
3.26 and the 11.3/9.8 ![]() m
ratio
m
ratio ![]() 0.74.
0.74.
The FWHM as a function of wavelength shows that both components are
resolved and extended, Fig. 6. The PAH component
extends over ![]()
![]() (
(![]() 390 AU) and the amorphous
silicate component over
390 AU) and the amorphous
silicate component over ![]()
![]() (
(![]() 130 AU) in the
spectra. On a larger scale, the spatial extent of the emission coming
from TY CrA is studied by constructing a calibrated 2D spectrum. The
different wavelength settings have been shifted, spliced and merged to
form a continuous 2D spectrum. The results are shown in
Fig. 11. Note that close to the blue and red cut-off
wavelengths of the grating, the terrestrial background varies strongly
with ambient conditions and atmospheric corrections are more
difficult. The same holds for the wavelength regions of strong
telluric lines near 9.58, 11.73 and 12.55
130 AU) in the
spectra. On a larger scale, the spatial extent of the emission coming
from TY CrA is studied by constructing a calibrated 2D spectrum. The
different wavelength settings have been shifted, spliced and merged to
form a continuous 2D spectrum. The results are shown in
Fig. 11. Note that close to the blue and red cut-off
wavelengths of the grating, the terrestrial background varies strongly
with ambient conditions and atmospheric corrections are more
difficult. The same holds for the wavelength regions of strong
telluric lines near 9.58, 11.73 and 12.55 ![]() m. Therefore, the
quality of the 2D spectrum is lower in those regions. At
m. Therefore, the
quality of the 2D spectrum is lower in those regions. At
![]() 11
11
![]() from TY CrA, the 11.2
from TY CrA, the 11.2 ![]() m PAH emission
from the ``bar'' to the South-East, is detected. The zoom-in (lower
panel) reveals particularly well the extended nature of the 11.0 and
11.2
m PAH emission
from the ``bar'' to the South-East, is detected. The zoom-in (lower
panel) reveals particularly well the extended nature of the 11.0 and
11.2 ![]() m PAH features.
m PAH features.
Given the extended nature of the mid-IR emission, spectra have been
extracted using the PSF, determined from the 12.2 ![]() m wavelength
setting, as extraction profile at positions along the slit, separated
by half the PSF's FWHM. Zero is at the centre position of the slit,
positions increase into the South-Eastern direction, see
Fig. 1. At each position, the continuum is established by
linear interpolation and subtracted from the PAH bands. For the 8.6
m wavelength
setting, as extraction profile at positions along the slit, separated
by half the PSF's FWHM. Zero is at the centre position of the slit,
positions increase into the South-Eastern direction, see
Fig. 1. At each position, the continuum is established by
linear interpolation and subtracted from the PAH bands. For the 8.6 ![]() m band, the resulting profile is fitted with a single
Lorentzian. The 11.0 and 11.2
m band, the resulting profile is fitted with a single
Lorentzian. The 11.0 and 11.2 ![]() m bands are decoupled by
simultaneously fitting a Gaussian for the 11.0
m bands are decoupled by
simultaneously fitting a Gaussian for the 11.0 ![]() m profile and a
Lorentzian for the 11.2
m profile and a
Lorentzian for the 11.2 ![]() m profile. This combination of
Lorentzians and Gaussians was chosen because it provided the best fit
with respect to the other possible combinations. The centres and
widths of the profiles are allowed to vary marginally. The fit is
assumed to be of intrinsically good quality. Therefore, uncertainties
have been established by multiplying the diagonal co-variance matrix
elements by the reduced
m profile. This combination of
Lorentzians and Gaussians was chosen because it provided the best fit
with respect to the other possible combinations. The centres and
widths of the profiles are allowed to vary marginally. The fit is
assumed to be of intrinsically good quality. Therefore, uncertainties
have been established by multiplying the diagonal co-variance matrix
elements by the reduced ![]() .
We expect that relative variations
along the slit are not much affected by systematic uncertainties
introduced by the fitting procedure. The strength of the
dust/continuum at each position is determined by integrating the
emission between 9.7 and 10.6
.
We expect that relative variations
along the slit are not much affected by systematic uncertainties
introduced by the fitting procedure. The strength of the
dust/continuum at each position is determined by integrating the
emission between 9.7 and 10.6 ![]() m. Here no error analysis has been
performed. The results are presented in Fig. 12.
m. Here no error analysis has been
performed. The results are presented in Fig. 12.
![\begin{figure}
\par\includegraphics[width=9cm]{11820f13} \includegraphics[width=9cm]{11820f14}
\end{figure}](/articles/aa/full_html/2009/28/aa11820-09/img82.png) |
Figure 11:
2D spectral image of TY CrA. Top: entire field of view (note the 11.2 |
| Open with DEXTER | |
![\begin{figure}
\par\includegraphics[width=7.1cm]{11820f15} \includegraphics[widt...
...ics[width=7.1cm]{11820f17} \includegraphics[width=7.1cm]{11820f18}
\end{figure}](/articles/aa/full_html/2009/28/aa11820-09/img83.png) |
Figure 12:
Integrated band strength as a function of position for the 8.6, 11.0 and 11.2 |
| Open with DEXTER | |
The spatial distribution of the individual components mostly differ
from each other, but do also show some common characteristics. All
spatial profiles show a higher flux level after the peak than before
and an asymmetric flank to the right of it. The 8.6 and 11.0 ![]() m
profiles are double peaked, whereas the 11.2
m
profiles are double peaked, whereas the 11.2 ![]() m and continuum
profiles are single peaked. Individual peaks show a slight
displacement from each other, traced out by the dashed lines in
Fig. 12. The (non-Gaussian) FWHM varies as
4.8
m and continuum
profiles are single peaked. Individual peaks show a slight
displacement from each other, traced out by the dashed lines in
Fig. 12. The (non-Gaussian) FWHM varies as
4.8
![]() ,
2.9
,
2.9
![]() ,
3.8
,
3.8
![]() ,
2.7
,
2.7
![]() and 1.4
and 1.4
![]() for the 8.6, 11.0, 11.2,
8.2
for the 8.6, 11.0, 11.2,
8.2 ![]() m and continuum profiles, respectively. These are in
reasonable agreement with Fig. 6 (specially
considering that the double peaked and asymmetric shape of the
profiles are not well defined by a single Gaussian FWHM). The 11.2
m and continuum profiles, respectively. These are in
reasonable agreement with Fig. 6 (specially
considering that the double peaked and asymmetric shape of the
profiles are not well defined by a single Gaussian FWHM). The 11.2 ![]() m flux is particularly interesting in that it stays at a
significant higher flux after peaking and coming down at
m flux is particularly interesting in that it stays at a
significant higher flux after peaking and coming down at
![]() 5
5
![]() ,
and rising again to form a double peak
around 12.5
,
and rising again to form a double peak
around 12.5
![]() ,
the position of the TY CrA ``bar''.
,
the position of the TY CrA ``bar''.
The varying 11.0/11.2 ![]() m band strength ratio as a function of
position is taken and presented in Fig. 13. The
ratio rises steeply and peaks around 2
m band strength ratio as a function of
position is taken and presented in Fig. 13. The
ratio rises steeply and peaks around 2
![]() ,
after which
it drops sharply and continues dropping steadily until reaching zero
around 7
,
after which
it drops sharply and continues dropping steadily until reaching zero
around 7
![]() .
The interpretation of these spatial
distributions will be addressed in Sect. 5.
.
The interpretation of these spatial
distributions will be addressed in Sect. 5.
![\begin{figure}
\par\includegraphics[width=9cm,clip]{11820f19}
\end{figure}](/articles/aa/full_html/2009/28/aa11820-09/img84.png) |
Figure 13:
11.0/11.2 |
| Open with DEXTER | |
4.4 HD 176386
The 3-colour IRAC image presented in Fig. 1 shows a
nebulous region surrounding HD 176386. The 8.0 ![]() m IRAC contours are
in good agreement with the VISIR K-band contours.
m IRAC contours are
in good agreement with the VISIR K-band contours.
Position 2 is a star identified as CCDM J19017-3653B; its featureless
spectrum is not shown and/or discussed here. The spectrum of Position 1, shown in Fig. 7, has some ozone
residuals. However, an amorphous silicate feature can clearly be
seen. Following van Boekel et al. (2005), we find a value of about
2.47 for the peak/continuum ratio, and about 1 for the 11.3/9.8 ![]() m
ratio.
m
ratio.
Concerning the extent of the emission, Position 1 and Position 2 are
not resolved with VISIR in spectroscopy. On the K-band acquisition
image, both sources have a FWHM of about 0.52
![]() (68 AU). Due to the unavailability of a K-band image of a point source calibrator we are unable to state whether the source is resolved. With spectroscopy, we derive an upper limit of 0.3
(68 AU). Due to the unavailability of a K-band image of a point source calibrator we are unable to state whether the source is resolved. With spectroscopy, we derive an upper limit of 0.3
![]() (40 AU), which is the FWHM of the calibrator.
(40 AU), which is the FWHM of the calibrator.
5 Discussion and astronomical implications
5.1 Silicate dust
The shape of the silicate feature is a measure of the amount of
processing that the material has undergone
(Bouwman et al. 2001). van Boekel et al. (2005) show that the
amount of crystallisation can be obtained from the 11.3/9.8 ![]() m
peak ratio. The peak/continuum ratio measures the feature's strength
and correlates with the 11.3/9.8
m
peak ratio. The peak/continuum ratio measures the feature's strength
and correlates with the 11.3/9.8 ![]() m peak ratio. This correlation
is interpreted as a relation between grain growth and crystallisation,
which assesses the amount of processing the material has
undergone. The values found for TY CrA and HD 176386 fall on the
correlation these authors present. Both these sources show silicate
emission originating from a disk; this is not the case for IRAS
06084-0611 VLA4 and CD-42 11721. The resulting 11.3/9.8
m peak ratio. This correlation
is interpreted as a relation between grain growth and crystallisation,
which assesses the amount of processing the material has
undergone. The values found for TY CrA and HD 176386 fall on the
correlation these authors present. Both these sources show silicate
emission originating from a disk; this is not the case for IRAS
06084-0611 VLA4 and CD-42 11721. The resulting 11.3/9.8 ![]() m peak
ratios indicate that TY CrA and HD 176386 have slightly processed
dust. The slightly higher value found for HD 176386 indicates more
extensive processing. Assuming similar systems, this might suggest
that HD 176386 is older. However, this is not really justified given
that TY CrA is a complex multiple star system. Furthermore, the
detailed evolutionary scenario involved in dust settling, grain growth
and crystallisation is not yet fully understood. A mineralogical
decomposition, which is beyond the scope of this paper, might provide
further insight.
m peak
ratios indicate that TY CrA and HD 176386 have slightly processed
dust. The slightly higher value found for HD 176386 indicates more
extensive processing. Assuming similar systems, this might suggest
that HD 176386 is older. However, this is not really justified given
that TY CrA is a complex multiple star system. Furthermore, the
detailed evolutionary scenario involved in dust settling, grain growth
and crystallisation is not yet fully understood. A mineralogical
decomposition, which is beyond the scope of this paper, might provide
further insight.
5.2 PAHs
Three out of the four Herbig Ae/Be stars studied here show PAH
emission. The PAH profiles peak near 6.2, 7.6, and 11.2 ![]() m,
referred to by Peeters et al. (2003,2002a) as
class A, and are consistent with non-isolated Herbig Ae/Be stars
(Peeters et al. 2002a). Class B profiles, with the PAH bands
peaking closer to 6.3, 7.8 and 11.3
m,
referred to by Peeters et al. (2003,2002a) as
class A, and are consistent with non-isolated Herbig Ae/Be stars
(Peeters et al. 2002a). Class B profiles, with the PAH bands
peaking closer to 6.3, 7.8 and 11.3 ![]() m, are associated with
isolated Herbig Ae/Be stars and are thought to probe directly the
circumstellar disk (Van Kerckhoven 2002; Boersma et al. 2008). Using the long-slit data, the measured extent
(FWHM) of the PAH emission is
m, are associated with
isolated Herbig Ae/Be stars and are thought to probe directly the
circumstellar disk (Van Kerckhoven 2002; Boersma et al. 2008). Using the long-slit data, the measured extent
(FWHM) of the PAH emission is ![]() 2
2
![]() (2100 AU) for
VLA4 in IRAS06084-0611,
(2100 AU) for
VLA4 in IRAS06084-0611, ![]() 1
1
![]() and
5
and
5
![]() (400 AU and 2000 AU, respectively) for the patch
near the star and arc components in CD-42 11721, and
(400 AU and 2000 AU, respectively) for the patch
near the star and arc components in CD-42 11721, and
![]() 3
3
![]() (390 AU) for TY CrA. Given these sizes, it is
clear that for VLA4 and CD-42 11721, the PAH emission from the
surroundings is dominating the spectrum. For TY CrA, the emission
associated with the central object likely originates from a large disk
(scale size
(390 AU) for TY CrA. Given these sizes, it is
clear that for VLA4 and CD-42 11721, the PAH emission from the
surroundings is dominating the spectrum. For TY CrA, the emission
associated with the central object likely originates from a large disk
(scale size ![]() 170 AU), while the more extended emission such, as
the bar to the South-East, represents surrounding molecular cloud
material set aglow by the radiation from the Herbig Ae/Be star.
170 AU), while the more extended emission such, as
the bar to the South-East, represents surrounding molecular cloud
material set aglow by the radiation from the Herbig Ae/Be star.
![\begin{figure}
\par\includegraphics[width=16.5cm]{11820f20}
\end{figure}](/articles/aa/full_html/2009/28/aa11820-09/img85.png) |
Figure 14: Cartoon of the proposed morphology for TY CrA depicting the different emission zones. |
| Open with DEXTER | |
5.3 Morphology
For HD 176386 (Position 1) we detect only silicate emission. This
emission is not spatially resolved and therefore, given the scale,
likely linked to a disk. The absence of PAH emission suggests a
self-shadowed Group II disk. The fact that we do not detect any PAH
emission, even at significant distances away from HD 176386, but do see
it on the IRAC images is due to the limited sensitivity of VISIR
compared to Spitzer. The estimated upper limit of the PAH emission
from the IRAC 8.0 ![]() m image is
m image is
![]() Jy
(IRAC
Jy
(IRAC
![]() [MJy/sr]
[MJy/sr] ![]() PSF
PSF
![]() [
[
![]() ]
]
![]() pixel
pixel
![]() [
[
![]() ]
]
![]()
![]() sr),
which is similar to the noise (see
Fig. 7). Siebenmorgen et al. (2000),
using ISOCAM, do detect PAH emission from HD 176386 and also from a
nearby ``bar''-like component. Due to the orientation of the VISIR slit,
the ``bar''-like component is not present in our data. Given the large
aperture of ISOCAM, the PAH emission Siebenmorgen et al. (2000) see
must be originating from the surrounding area.
sr),
which is similar to the noise (see
Fig. 7). Siebenmorgen et al. (2000),
using ISOCAM, do detect PAH emission from HD 176386 and also from a
nearby ``bar''-like component. Due to the orientation of the VISIR slit,
the ``bar''-like component is not present in our data. Given the large
aperture of ISOCAM, the PAH emission Siebenmorgen et al. (2000) see
must be originating from the surrounding area.
The difference in spatial distribution of the 8.6, 11.0 and 11.2 ![]() m features in the spectra of TY CrA (Fig. 12) point towards three distinct carriers
for these bands. The 8.6
m features in the spectra of TY CrA (Fig. 12) point towards three distinct carriers
for these bands. The 8.6 ![]() m PAH band has recently been attributed
to very large, compact and highly symmetric PAH cations (and
anions, Bauschlicher et al. 2008). The 11.0
m PAH band has recently been attributed
to very large, compact and highly symmetric PAH cations (and
anions, Bauschlicher et al. 2008). The 11.0 ![]() m band has been
assigned to the out-of-plane bending mode in solo C-H cationic PAHs,
while the 11.2
m band has been
assigned to the out-of-plane bending mode in solo C-H cationic PAHs,
while the 11.2 ![]() m band has been assigned to the out-of-plane
bending mode in solo C-H of neutral PAHs (Hudgins & Allamandola 1999; Hony et al. 2001). Although, recently this assignments has met
some opposition (Povich et al. 2007).
m band has been assigned to the out-of-plane
bending mode in solo C-H of neutral PAHs (Hudgins & Allamandola 1999; Hony et al. 2001). Although, recently this assignments has met
some opposition (Povich et al. 2007).
Attributing the PAH emission originating from a flaring disk, the
spatial distribution can be explained within the context of these
assignments. The proposed morphology of TY CrA is presented in
Fig. 14, where the quaternary star system is
surrounded by a single flaring disk. An inner gap beyond the orbit of
the fourth stellar component is inferred from the double peaked
spatial profiles of the 8.6 and 11.0 ![]() m PAH bands. The 11.0/11.2 ratio - and thus the ions to neutrals - peaks to the right, away from
the star and only to one side. This can be understood in the context
of a flaring disk seen under an angle, where the near side is
foreshortened and therefore unobserved. The 11.2
m PAH bands. The 11.0/11.2 ratio - and thus the ions to neutrals - peaks to the right, away from
the star and only to one side. This can be understood in the context
of a flaring disk seen under an angle, where the near side is
foreshortened and therefore unobserved. The 11.2 ![]() m emission
originates from the bulk of the disk. Both the neutral and
intrinsically stronger nature of the 11.2
m emission
originates from the bulk of the disk. Both the neutral and
intrinsically stronger nature of the 11.2 ![]() m PAH band allows for
this. The emission can even be traced all the way down to the TY CrA
``bar'', which we suspect to be the limb-brightened edge of a bowl where
the photo dissociation front is eating its way into the molecular
cloud. This in-between material is the non-limb brightened inside of
the bowl. The PAHs will be more easily ionised close to the star. In
agreement, the 8.6 and 11.0
m PAH band allows for
this. The emission can even be traced all the way down to the TY CrA
``bar'', which we suspect to be the limb-brightened edge of a bowl where
the photo dissociation front is eating its way into the molecular
cloud. This in-between material is the non-limb brightened inside of
the bowl. The PAHs will be more easily ionised close to the star. In
agreement, the 8.6 and 11.0 ![]() m PAH band emission is originating
from a narrow region at the inner disk. Furthermore, recent analysis
by Bauschlicher et al. (2008) suggest larger PAHs dominating the 11.0
m PAH band emission is originating
from a narrow region at the inner disk. Furthermore, recent analysis
by Bauschlicher et al. (2008) suggest larger PAHs dominating the 11.0 ![]() m emission than those dominating that at 8.6
m emission than those dominating that at 8.6 ![]() m. Hence, the
11.0
m. Hence, the
11.0 ![]() m emission should be more confined since only large PAHs are
able to survive close to the star, and this is what is
seen. Geers et al. (2007) measured the radial extent of the 3.3
m emission should be more confined since only large PAHs are
able to survive close to the star, and this is what is
seen. Geers et al. (2007) measured the radial extent of the 3.3 ![]() m PAH band emission to be 54 AU, which fits well within the
proposed morphology.
m PAH band emission to be 54 AU, which fits well within the
proposed morphology.
Interestingly, the fourth stellar component is separated
![]() 0.3
0.3
![]() (40 AU) from the central tertiary system,
which is similar to the separation of the dust and PAH component in
the VISIR spectrum. It is tempting to speculate that the fourth
companion, at a projected distance of 40 AU, is dynamically related to
the inferred large inner radius of the circumquartery disk. That would
imply that the actual distance of this star is some 70 AU from TY CrA
itself. It is tempting to conclude that the fourth companion is
inducing the dust emission. However, at this distance, the central
Herbig Ae/Be star still dominates the dust temperature (
(40 AU) from the central tertiary system,
which is similar to the separation of the dust and PAH component in
the VISIR spectrum. It is tempting to speculate that the fourth
companion, at a projected distance of 40 AU, is dynamically related to
the inferred large inner radius of the circumquartery disk. That would
imply that the actual distance of this star is some 70 AU from TY CrA
itself. It is tempting to conclude that the fourth companion is
inducing the dust emission. However, at this distance, the central
Herbig Ae/Be star still dominates the dust temperature (![]() 300 Kelvin, assuming LTE and an emissivity of 0.05). Furthermore, the M4 star is unable to heat the dust up to the scale of the observed distance (
300 Kelvin, assuming LTE and an emissivity of 0.05). Furthermore, the M4 star is unable to heat the dust up to the scale of the observed distance (![]() 65 AU). Therefore, the central Herbig Ae/Be star must
be responsible for heating the dust.
65 AU). Therefore, the central Herbig Ae/Be star must
be responsible for heating the dust.
5.4 Band strengths
Following Hony et al. (2001) and Galliano et al. (2008),
we have investigated the correlations between the strength of the PAH
bands presented in Table 5. The 6.2/11.2 ![]() m band
shows little variations, implying very similar physical conditions. In
contrast, other studies (Lebouteiller et al. 2008; Galliano et al. 2008) report little variation in the 7.7/6.2 ratios
with a typical value of 2.5, where most of the Herbig stars fall
(Fig. 15). There is no indication that this ratio
correlates with object type (e.g. isolated Herbig stars versus
reflection nebula). The origin of this variation may well provide
interesting insight in the chemical make-up of the emitting PAHs, for example the difference in photochemical activity.
m band
shows little variations, implying very similar physical conditions. In
contrast, other studies (Lebouteiller et al. 2008; Galliano et al. 2008) report little variation in the 7.7/6.2 ratios
with a typical value of 2.5, where most of the Herbig stars fall
(Fig. 15). There is no indication that this ratio
correlates with object type (e.g. isolated Herbig stars versus
reflection nebula). The origin of this variation may well provide
interesting insight in the chemical make-up of the emitting PAHs, for example the difference in photochemical activity.
| |
Figure 15:
Left:
|
| Open with DEXTER | |
The 11.2/6.2 versus 7.7/6.2 ![]() m band strength ratios have been
plotted in Fig. 15. Along with the ratios for two
reflection nebulae, NGC 7023 and NGC 2023, and two non-isolated Herbig
Ae/Be stars, HD 97048 and BD+40 4124 (Hony et al. 2001; van Diedenhoven et al. 2004). These band ratios may be
influenced by the physical conditions (e.g. charge) or by the chemical
history (e.g. difference in illuminating spectrum may control
photochemistry).
m band strength ratios have been
plotted in Fig. 15. Along with the ratios for two
reflection nebulae, NGC 7023 and NGC 2023, and two non-isolated Herbig
Ae/Be stars, HD 97048 and BD+40 4124 (Hony et al. 2001; van Diedenhoven et al. 2004). These band ratios may be
influenced by the physical conditions (e.g. charge) or by the chemical
history (e.g. difference in illuminating spectrum may control
photochemistry).
The ratio of the C-C to C-H modes (6.2/11.2 ![]() m band strength
ratio) is generally thought to reflect the degree of ionisation of the
emitting PAHs (Tielens 2008). Typically, these ratios
vary with a factor of
m band strength
ratio) is generally thought to reflect the degree of ionisation of the
emitting PAHs (Tielens 2008). Typically, these ratios
vary with a factor of ![]() 5 between sources and within sources
(Galliano et al. 2008). However as a class, these Herbig Ae/Be
stars reveal very similar values (Fig. 15), indicating
that the physical conditions (e.g. G0/
5 between sources and within sources
(Galliano et al. 2008). However as a class, these Herbig Ae/Be
stars reveal very similar values (Fig. 15), indicating
that the physical conditions (e.g. G0/![]() ,
where G0 is
the UV intensity and
,
where G0 is
the UV intensity and ![]() the electron density) in the emission
zone are much the same. Curiously in the same data, in terms of the
7.7/6.2 versus 11.2/6.2 band ratios, a larger variation is apparent
(Fig. 15). In particular, the sources HD 97048 and NGC 2023
have a 7.7/6.2 ratio which is almost a factor 2 higher than in the
other sources.
the electron density) in the emission
zone are much the same. Curiously in the same data, in terms of the
7.7/6.2 versus 11.2/6.2 band ratios, a larger variation is apparent
(Fig. 15). In particular, the sources HD 97048 and NGC 2023
have a 7.7/6.2 ratio which is almost a factor 2 higher than in the
other sources.
5.5 PAH emission from Herbig A vs Herbig B stars
The (proto-) stellar mass determines the total luminosity and the number of ionising photons. Heavier stars, and therefor more luminous, should be able to light up more of their surroundings than there less massive counterparts. At the same time the number of available ionising photons is larger for the heavier stars. Alterations to the silicates and PAH family, driven by photo-chemistry, should be sensitive to the spectral shape of the irradiating source and show up as variations in the band shapes.
Herbig B stars are more luminous analogs of the Herbig A stars. The
earliest B star, which are powering prominent reflection nebulae
(e.g. NGC 2023 and NGC 7023), have about a hundred times higher
luminosity at 6 eV than the later type Herbig B stars (e.g. TY CrA),
while mid A stars are another 100 times weaker yet. Hence, typical
spatial scales for the PAH emission will be ten times larger for early
B stars than later Herbig B stars and a hundred times larger than mid
Herbig A stars. Indeed, for reflection nebula spatial scales for PAH
emission are ![]() 0.1 pc, whereas for Herbig A stars only the
circumstellar disk re-radiates PAH emission (
0.1 pc, whereas for Herbig A stars only the
circumstellar disk re-radiates PAH emission (![]() 200 AU). In this
context, IRAS 06084-0611 VLA4 and CD-42 11721 are placed in the RNe
class and indeed their emission scale is large and consistent with
surrounding molecular cloud material illuminated by the star, but not
associated with it. TY CrA is possibly a transition object between the
Herbig A and genuine reflection nebulae. The reflection nebula
characteristics dominate on larger scales, while the disk and envelope
of TY CrA dominate on smaller scales.
200 AU). In this
context, IRAS 06084-0611 VLA4 and CD-42 11721 are placed in the RNe
class and indeed their emission scale is large and consistent with
surrounding molecular cloud material illuminated by the star, but not
associated with it. TY CrA is possibly a transition object between the
Herbig A and genuine reflection nebulae. The reflection nebula
characteristics dominate on larger scales, while the disk and envelope
of TY CrA dominate on smaller scales.
6 Summary and conclusions
The mid-IR images and spectra of four Herbig Ae/Be stars have been investigated in order to study the variation in the dust and PAH characteristics and hence, the processing of material in star and planet forming environments. We find evidence for large scale structure and extended emission in all four sources. Except for HD 176386, all sources show PAH emission in their TIMMI2/VISIR spectrum. Both HD 176386 and TY CrA show silicate emission. The scales on which these dust components emit varies significantly. The PAHs are detected from 390 AU up to 5700 AU. The silicate emission observed in HD 176386 is spatially unresolved, providing an upper limit of 40 AU. In TY CrA, the silicates are seen up to 130 AU. The extent of the continuum emission is similar to that of the silicates.
Following Hony et al. (2001) and Galliano et al. (2008),
we have investigated the correlation of the strength of the PAH
bands. The 6.2/11.2 ![]() m PAH band ratio shows little variation,
implying very similar physical conditions. In contrast to previous
studies, we find more variation in the 7.7/6.2
m PAH band ratio shows little variation,
implying very similar physical conditions. In contrast to previous
studies, we find more variation in the 7.7/6.2 ![]() m band strength
ratio within our sample. However there does not seem to be a
relationship with object type.
m band strength
ratio within our sample. However there does not seem to be a
relationship with object type.
For the individual objects we infer the following:
- IRAS 06084-0611: The two bright IR sources VLA1 and VLA4 have
been studied, where the spectrum of VLA1 resembles that of a YSO. For
this source, we were able to deduce a CO
 temperature of 100-110 K, consistent with an embedded YSO. VLA4 shows a far richer
spectrum. The PAH and continuum emission is extended on scales of 2800
and 2200 AU, respectively.
temperature of 100-110 K, consistent with an embedded YSO. VLA4 shows a far richer
spectrum. The PAH and continuum emission is extended on scales of 2800
and 2200 AU, respectively.
- CD-42 11721: We find evidence for several distinct emission
components. First, there is evidence for a PAH peak close to the
star. Second, an arc of PAH emission partially encompasses the star
and the nearby emission peak (``patch''). The nearby PAH peak and PAH
arc have both an emission scale of 1900 AU.
- TY CrA: Our analysis was particularly successful given our
ability to separate an amorphous silicate and PAH spectrum. The
silicates and PAHs are seen up to scales of 130 and 390 AU,
respectively. Extracting spectra separated 1 PSF over the source
profile allowed us to infer the morphology of TY CrA. The TY CrA
system is seen under an angle and includes a large circum-quaternary
disk with a inner gap of
 70 AU. Analyses of the 10
  m
feature given the paradigm of van Boekel et al. (2005) suggests the
presence of rather pristine silicates.
m
feature given the paradigm of van Boekel et al. (2005) suggests the
presence of rather pristine silicates.
- HD 176386: Spectra of two positions were acquired. One of them
was identified as CCDM J19017-3653B and has a stellar spectrum. At the
other position, a 10 m feature was detected. Following the
analysis of van Boekel et al. (2005), pristine silicate were
identified, but more processed than those of TY CrA. The absence of
PAH emission is consistent with a self-shadowed Group II disk.
A consistent large sample of high-spatial observations of reflection nebula and Herbig Ae/Be stars will help pin down the validity of our proposed connection between Herbig A and B stars and reflection nebulae and determine how smooth the transitions actually are. Such a study could form the basis for our understanding of the evolution of PAHs in regions of star and planet formation.
Acknowledgements
We are grateful to the staff at the European Southern Observatory in La Silla and Paranal for assisting with the observations. We would also like to extend our gratitude to Mario van den Ancker for providing an overview of the stellar data. We also thank Carsten Dominik for insights concerning disk geometry.
References
- Allamandola, L. J., Tielens, G. G. M., & Barker, J. R. 1989, ApJS, 71, 733 [NASA ADS] [CrossRef] (In the text)
- Bauschlicher, Jr., C. W., Peeters, E., & Allamandola, L. J. 2008, ApJ, 678, 316 [NASA ADS] [CrossRef] (In the text)
- Boersma, C., Bouwman, J., Lahuis, F., et al. 2008, A&A, 484, 241 [NASA ADS] [CrossRef] [EDP Sciences]
- Boogert, A. C. A. 1999, Ph.D. Thesis, AA (In the text)
- Borges Fernandes, M., Kraus, M., Lorenz Martins, S., & de Araújo, F. X. 2007, MNRAS, 377, 1343 [NASA ADS] [CrossRef] (In the text)
- Bouwman, J., de Koter, A., van den Ancker, M. E., & Waters, L. B. F. M. 2000, A&A, 360, 213 [NASA ADS] (In the text)
- Bouwman, J., Meeus, G., de Koter, A., et al. 2001, A&A, 375, 950 [NASA ADS] [CrossRef] [EDP Sciences] (In the text)
- Casey, B. W., Mathieu, R. D., Vaz, L. P. R., Andersen, J., & Suntzeff, N. B. 1998, AJ, 115, 1617 [NASA ADS] [CrossRef]
- Chauvin, G., Lagrange, A.-M., Beust, H., et al. 2003, A&A, 406, L51 [NASA ADS] [CrossRef] [EDP Sciences] (In the text)
- Cohen, M., Tielens, A. G. G. M., & Allamandola, L. J. 1985, ApJ, 299, L93 [NASA ADS] [CrossRef] (In the text)
- Cohen, M., Walker, R. G., Carter, B., et al. 1999, ApJ, 117, 1864 [NASA ADS] (In the text)
- de Graauw, T., Haser, L. N., Beintema, D. A., et al. 1996, A&A, 315, L49 [NASA ADS] (In the text)
- de Winter, D., & The, P. S. 1990, Ap&SS, 166, 99 [NASA ADS] [CrossRef]
- Fazio, G. G., Hora, J. L., Allen, L. E., et al. 2004, ApJS, 154, 10 [NASA ADS] [CrossRef] (In the text)
- Galliano, F., Madden, S. C., Tielens, A. G. G. M., Peeters, E., & Jones, A. P. 2008, ApJ, 679, 310 [NASA ADS] [CrossRef] (In the text)
- Geers, V. C., van Dishoeck, E. F., Visser, R., et al. 2007, A&A, 476, 279 [NASA ADS] [CrossRef] [EDP Sciences] (In the text)
- Gómez, Y., Rodríguez, L. F., & Garay, G. 2000, ApJ, 531, 861 [NASA ADS] [CrossRef]
- Grady, C. A., Polomski, E. F., Henning, T., et al. 2001, AJ, 122, 3396 [NASA ADS] [CrossRef] (In the text)
- Harvey, P. M., Wilking, B. A., Joy, M., & Lester, D. F. 1985, ApJ, 288, 725 [NASA ADS] [CrossRef]
- Herbig, G. H. 1960, ApJS, 4, 337 [NASA ADS] [CrossRef] (In the text)
- Hony, S., Van Kerckhoven, C., Peeters, E., et al. 2001, A&A, 370, 1030 [NASA ADS] [CrossRef] [EDP Sciences] (In the text)
- Houk, N., & Fuentes-Williams, T. H. 1982, in BAAS, 14, 615
- Hudgins, D. M., & Allamandola, L. J. 1999, ApJ, 516, L41 [NASA ADS] [CrossRef]
- Jeffers, H. M., van Denbos, W. H., & Greeby, F. M. 1963, Index catalogue of visual double stars, 1961.0 (Publications of the Lick Observatory, Mount Hamilton: University of California, Lick Observatory) (In the text)
- Keller, L. D., Sloan, G. C., Forrest, W. J., et al. 2008, ApJ, 684, 411 [NASA ADS] [CrossRef]
- Kessler, M. F., Steinz, J. A., Anderegg, M. E., et al. 1996, A&A, 315, L27 [NASA ADS] (In the text)
- Lagage, P. O., Pel, J. W., Authier, M., et al. 2004, The Messenger, 117, 12 [NASA ADS] (In the text)
- Lebouteiller, V., Bernard-Salas, J., Brandl, B., et al. 2008, ApJ, 680, 398 [NASA ADS] [CrossRef]
- Leger, A., & Puget, J. L. 1984, A&A, 137, L5 [NASA ADS] (In the text)
- Marraco, H. G., & Rydgren, A. E. 1981, AJ, 86, 62 [NASA ADS] [CrossRef]
- Meeus, G., Waters, L. B. F. M., Bouwman, J., et al. 2001, A&A, 365, 476 [NASA ADS] [CrossRef] [EDP Sciences] (In the text)
- Peeters, E., Hony, S., Van Kerckhoven, C., et al. 2002a, A&A, 390, 1089 [NASA ADS] [CrossRef] [EDP Sciences]
- Peeters, E., Martín-Hernández, N. L., Damour, F., et al. 2002b, A&A, 381, 571 [NASA ADS] [CrossRef] [EDP Sciences] (In the text)
- Peeters, E., van Diedenhoven, B., Van Kerckhoven, C., et al. 2003, in Astrophysics of Dust
- Persi, P., & Tapia, M. 2003, A&A, 406, 149 [NASA ADS] [CrossRef] [EDP Sciences] (In the text)
- Povich, M. S., Stone, J. M., Churchwell, E., et al. 2007, ApJ, 660, 346 [NASA ADS] [CrossRef] (In the text)
- Racine, R., & van den Bergh, S. 1970, in The Spiral Structure of our Galaxy, ed. W. Becker, & G. I. Kontopoulos, IAU Symp., 38, 219
- Reimann, H.-G., Linz, H., Wagner, R., et al. 2000, in Optical and IR Telescope Instrumentation and Detectors, ed. M. Iye, & A. F. Moorwood, Proc. SPIE, 4008, 1132 (In the text)
- Reipurth, B., Jewitt, D., & Keil, K. 2007, Protostars and Planets V (In the text)
- Shore, S. N., Brown, D. N., Bopp, B. W., et al. 1990, ApJS, 73, 461 [NASA ADS] [CrossRef]
- Siebenmorgen, R., Prusti, T., Natta, A., & Müller, T. G. 2000, A&A, 361, 258 [NASA ADS] (In the text)
- Sloan, G. C., Jura, M., Duley, W. W., et al. 2007, ApJ, 664, 1144 [NASA ADS] [CrossRef]
- Tielens, A. G. G. M. 2008, ARA&A, 45, 289 [NASA ADS] [CrossRef] (In the text)
- Turon, C., Creze, M., Egret, D., et al. 1993, Bulletin d'Information du Centre de Données Stellaires, 43, 5 [NASA ADS] (In the text)
- van Boekel, R., Min, M., Waters, L. B. F. M., et al. 2005, A&A, 437, 189 [NASA ADS] [CrossRef] [EDP Sciences] (In the text)
- van den Ancker, M. E., Bouwman, J., Wesselius, P. R., et al. 2000, A&A, 357, 325 [NASA ADS] (In the text)
- van Diedenhoven, B., Peeters, E., Van Kerckhoven, C., et al. 2004, ApJ, 611, 928 [NASA ADS] [CrossRef] (In the text)
- Van Kerckhoven, C. 2002, Ph.D. Thesis, Instituut voor Sterrenkunde, Katholieke universiteit Leuven
- Waelkens, C., & Waters, L. B. F. M. 1997, in Infrared Space Interferometry: Astrophysics & the Study of Earth-like Planets, ed. C. Eiroa, et al., 119 (In the text)
- Waelkens, C., Waters, L. B. F. M., de Graauw, M. S., et al. 1996, A&A, 315, L245 [NASA ADS] (In the text)
- Waters, L. B. F. M., & Waelkens, C. 1998, ARA&A, 36, 233 [NASA ADS] [CrossRef] (In the text)
All Tables
Table 1: Stellar data.
Table 2: Collected data.
Table 3: Observation log of the TIMMI2 and VISIR data.
Table 4: Summary of the ISO-SWS observations.
Table 5: PAH band strengths determined from the ISO-SWS spectra.
Table 6: Gaussian FWHM of the different objects and emission components studied here (still convolved).
All Figures
| |
Figure 1:
Three colour composite IRAC images (red: 8.0, green: 5.8 and blue: 3.6 |
| Open with DEXTER | |
| In the text | |
| |
Figure 2:
Two spatial cross-cuts of the TIMMI2 spectra of CD-42 11721. The top panel plots the continuum between 9.7 and 10.9 |
| Open with DEXTER | |
| In the text | |
| |
Figure 3:
The top two panels show the TIMMI2 spectra of IRAS 06084-0611 VLA1 and VLA4. A comparison between the ISO-SWS spectrum and the TIMMI2 spectra of IRAS 06084-0611 VLA4 (see Fig. 1 for the apertures) is plotted in the middle panel. The lower two panels shows the FWHM of both sources as a function of wavelength (black diamonds), the FWHM of the sources in the 11.9 |
| Open with DEXTER | |
| In the text | |
| |
Figure 4:
The TIMMI2 spectra of the three components of CD-42 11721 (see Figs. 1 and 2, and Sect. 3.2) are shown in the top three panels. The fourth panel shows a comparison of the TIMMI2 spectrum of the four emission peaks combined with the ISO-SWS spectrum. The dashed lines show the fit made to the star (
|
| Open with DEXTER | |
| In the text | |
| |
Figure 5: Spectra for the total, amorphous silicate and PAH component of TY CrA when integrating the area underneath the Gaussians fitted to the spatial profile (see text for details). |
| Open with DEXTER | |
| In the text | |
| |
Figure 6: FWHM as a function of wavelength of the amorphous silicate and PAH components in TY CrA. Also shown is the FWHM of the calibrator as a function of wavelength. |
| Open with DEXTER | |
| In the text | |
| |
Figure 7: VISIR spectrum of HD 176386 Position 1, median smoothed over 5 elements. |
| Open with DEXTER | |
| In the text | |
| |
Figure 8:
ISO-SWS spectra of IRAS 06084-0611, CD-42 11721 and TY CrA. Indicated are the 3.3, 6.2, ``7.7'', 8.6, 11.2, 12.7, 16.4 and 17.4 |
| Open with DEXTER | |
| In the text | |
| |
Figure 9:
15.25 |
| Open with DEXTER | |
| In the text | |
| |
Figure 10:
Spatial distribution of IRAS 06084-0611 VLA4 (solid line) and the calibration star (dotted line) from TIMMI2 at 11.22 |
| Open with DEXTER | |
| In the text | |
| |
Figure 11:
2D spectral image of TY CrA. Top: entire field of view (note the 11.2 |
| Open with DEXTER | |
| In the text | |
| |
Figure 12:
Integrated band strength as a function of position for the 8.6, 11.0 and 11.2 |
| Open with DEXTER | |
| In the text | |
| |
Figure 13:
11.0/11.2 |
| Open with DEXTER | |
| In the text | |
| |
Figure 14: Cartoon of the proposed morphology for TY CrA depicting the different emission zones. |
| Open with DEXTER | |
| In the text | |
| |
Figure 15:
Left:
|
| Open with DEXTER | |
| In the text | |
Copyright ESO 2009
Current usage metrics show cumulative count of Article Views (full-text article views including HTML views, PDF and ePub downloads, according to the available data) and Abstracts Views on Vision4Press platform.
Data correspond to usage on the plateform after 2015. The current usage metrics is available 48-96 hours after online publication and is updated daily on week days.
Initial download of the metrics may take a while.